Mind the Gap: The History of Rate Divergence Between the BoC and the Fed
James Orlando, CFA, Director & Senior Economist | 416-413-3180
Brett Saldarelli, Economist | 416-542-0072
Date Published: May 29, 2024
- Category:
- Canada
- Financial Markets
Highlights
- All eyes will be on the Bank of Canada as it is set to meet next week. With inflation stabilizing around the 2% target, investors are expecting that the central bank will either cut its policy rate, or at the very least, signal that a cut will happen soon.
- While it is clear that the BoC is closing in on its first rate cut, the same cannot be said for the Federal Reserve. Strong U.S. economic growth has led to an upturn in inflation, raising expectations that the BoC will have to go it alone when it comes to initiating rate cuts.
- This won’t be the first time that policy divergence has happened between the two central banks. But importantly, a repeat will have knock-on effects, justifying our year-end forecast for the loonie of 70 U.S. cents.
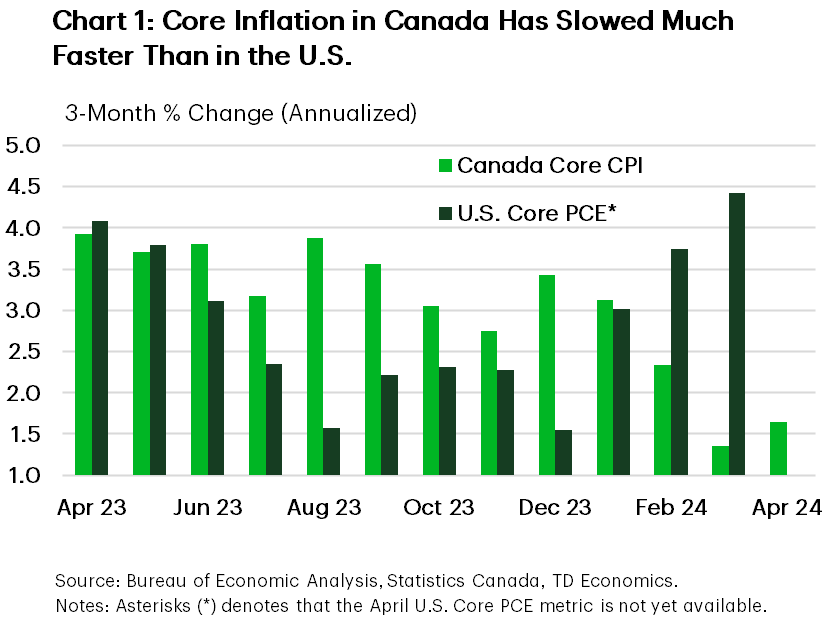
If there is one thing we have learned since central banks started hiking rates, it’s that interest rates affect economies differently. Case in point, the Canadian economy has grown below its trend rate for nearly two years – matching the start of the Bank of Canada’s (BoC) aggressive interest rate hiking cycle. At the same time, the U.S. economy has continued to grow at an above-trend pace even though the Federal Reserve hiked rates to a higher level. This economic divergence has resulted in different inflationary outcomes. The three-month average of the BoC’s core inflation metrics is at just 1.6%, while core PCE in the U.S. is 4.4% (Chart 1)! How should the BoC respond? While we’d understand if the BoC is hesitant to cut given what it is seeing with inflation in the U.S., the Canadian central bank needs to react to what is happening at home. If it believes that it has curbed economic growth enough to ensure inflation is on a sustainable path back to 2%, it should cut rates - even if the Fed doesn’t.
The history of policy rate divergence
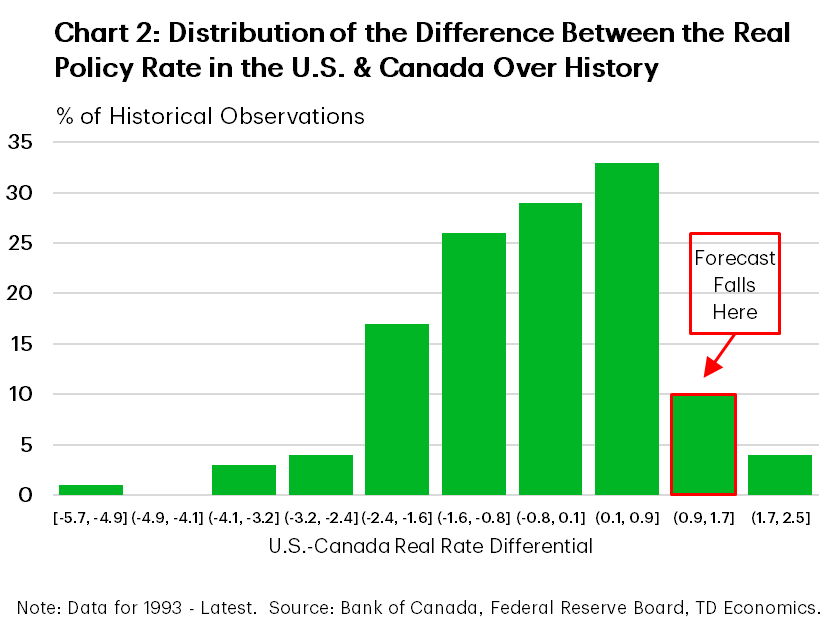
The pertinent question is not “if” the BoC can cut ahead of the Fed, but by “how much?”. Historically, a 100 basis point spread between the Fed and BoC policy rates appears sustainable (Chart 2). In fact, when we look back to the episodes where the BoC diverged from the Fed, there were clear macroeconomic justifications for this.
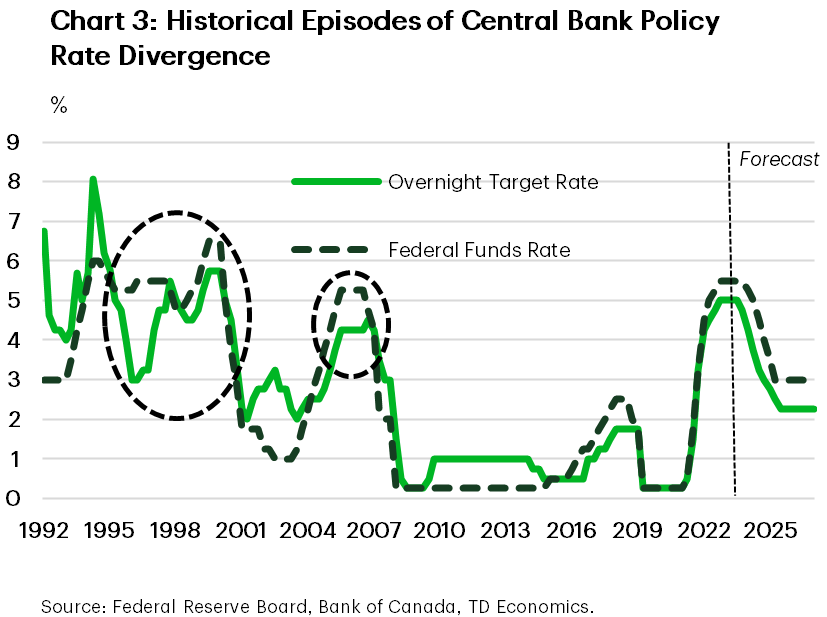
There are three episodes where the BoC’s policy rate maintained a significant negative spread relative to the Fed: (1) 1995-1998, (2) 1999-2000, and (3) 2003-2006 (Chart 3). For the former, that episode involved the BoC cutting more than the Fed, while the two others occurred because the BoC lagged behind on rate hikes. Indeed, following the Mexican peso crisis in 1994-1995, the BoC began aggressively lowering its policy rate (from 8.1% to 3%) as economic growth slowed markedly. During that time, the BoC noted that GDP was so weak that supply was consistently outstripping demand. Ring a bell to what we are hearing from the BoC today? This led to a further widening of the output gap and continued downward pressure on inflation (that bell is ringing again!). At the same time, the Fed made only modest adjustments to its policy rate as the U.S. economy was relatively insulated. By early 1997, the policy rate spread between the BoC and the Fed was a whopping 250 basis points (bps). Impressively, the loonie only moved sideways over this period, supported by rising energy prices.
The BoC didn’t maintain this policy rate divergence too long, as it began raising rates just seven months after reaching its trough. The BoC kept increasing rates through 1998, supported by strong economic growth and a narrowing of the output gap. This wasn’t enough to help the loonie, which fell to a low of 63 U.S. cents on the back of weak commodity prices stemming from uncertainty surrounding the Asian and Russian financial crises. To defend the loonie, the BoC hiked one last time in the summer of 1998 (by an additional 100 bps), closing the policy rate gap with the Fed.
The second policy rate divergence episode began in 1999. This followed the efforts from the Fed to quell volatility following the collapse of billion-dollar hedge fund Long-Term Capital Management. Fortunately the Fed’s intervention ensured that financial market volatility was short-lived. The economy continued to expand, driven by strong gains in productivity. Yet, policy makers stressed concerns that further productivity growth was limited and may not be able to offset wage gains, presenting an upside risk to inflation. This prompted the Fed to begin raising rates in mid-1999. Even though the BoC followed the Fed’s lead by hiking rates, it did so at a slower pace, causing policy rate divergence to reach 75 bps by mid-2000. This divergence alongside weak commodity prices, and financial market volatility sent the Canadian dollar down from its 2000 peak of 70 U.S. cents, to 64 U.S. cents towards the end of the year.1 The loonie continued its slide through 2002, reaching 62 U.S. cents (its lowest level on record) on the back of falling oil prices.2
In the third episode, from 2003 to 2006, policy divergence occurred as American economic growth was being aided by a rapid increase in real estate prices. U.S. economic growth averaged more than half a percentage point above Canadian growth over that time. To lean against rising real estate prices and slow economic growth, the Fed raised its policy rate by more than 1% above the BoC rate. Importantly, this time period was one of soaring commodity prices, with the price of oil having doubled over the four-year period. Higher oil prices benefited the Canadian economy, preventing the Canada-U.S. growth gap from widening too much. Interestingly, because higher oil prices improved the value of Canadian exports, the loonie appreciated from a low of 63 U.S. cents at the beginning of 2003, to 91 U.S. cents in 2006 (it continued to rise past parity in 2007). We all know what happened next. The U.S. economy fell into its worst recession since the Great Depression, while the Canadian economy was able to avoid a worst case outcome, due to the resiliency of its banking system. The Fed therefore had to cut rates to the zero lower bound, leaving rates there for the subsequent seven years.
What will happen in 2024?
Greater interest rate sensitivity in Canada means that economic growth this year is likely to once again underperform relative to the U.S. We have penciled in real GDP growth of 1.2% for Canada and 2.6% for the U.S. Below-trend growth in Canada should make the BoC confident that it has inflation under control. The Fed, however, does not have this luxury. Consequently, we expect the BoC to begin cutting rates this summer and start speeding up the pace of cuts at the end of 2024. On the other side of the border, we see the Fed taking its time, with December as the most likely start date for that first cut.
That means the spread between the BoC and Fed policy rates would hit 125 bps, before the Fed starts to accelerate its own rate cutting pace. This implies that the BoC will be managing monetary policy according to what is happening in Canada, with an eye fixed on what’s happening in the U.S. For the loonie, we do not expect there to be a commodity price tailwind this time around. This could risk the currency dropping below the psychological 70 U.S. cent level should a risk-off event, such as an intensification of geopolitical tensions, occur.
End Notes
- Bank of Canada Monetary Policy Report, November 2000.
- “Monetary Policy and Exchange Rate Movements”, David Dodge, Vancouver Board of Trade, February 17th, 2005.
Disclaimer
This report is provided by TD Economics. It is for informational and educational purposes only as of the date of writing, and may not be appropriate for other purposes. The views and opinions expressed may change at any time based on market or other conditions and may not come to pass. This material is not intended to be relied upon as investment advice or recommendations, does not constitute a solicitation to buy or sell securities and should not be considered specific legal, investment or tax advice. The report does not provide material information about the business and affairs of TD Bank Group and the members of TD Economics are not spokespersons for TD Bank Group with respect to its business and affairs. The information contained in this report has been drawn from sources believed to be reliable, but is not guaranteed to be accurate or complete. This report contains economic analysis and views, including about future economic and financial markets performance. These are based on certain assumptions and other factors, and are subject to inherent risks and uncertainties. The actual outcome may be materially different. The Toronto-Dominion Bank and its affiliates and related entities that comprise the TD Bank Group are not liable for any errors or omissions in the information, analysis or views contained in this report, or for any loss or damage suffered.
Download
Share: