Highlights
- As the Bank of Canada pivots to rate hikes, debt servicing costs are set to rise, rekindling a familiar concern about the vulnerability of heavily indebted Canadian households.
- Overall indebtedness is higher than it was before the health crisis, as households took advantage of rock bottom rates earlier in pandemic to pile on mortgage debt. Rates are increasing from a very low starting point, but they are poised to rise at a much faster clip than they did during the previous hiking cycle. Interest rates are also rising at the same time as households are contending with high inflation squeezing their budgets.
- We expect that higher borrowing costs will meaningfully temper Canadians’ appetite for new loans, slowing growth in household debt and stabilizing the debt-to-income ratio.
- As for existing borrowers, if the labour market remains healthy, most should be able to absorb higher interest rates and remain current on their payments. Still, we anticipate some deterioration in credit performance indicators as the pressure from rate increases adds up over time.
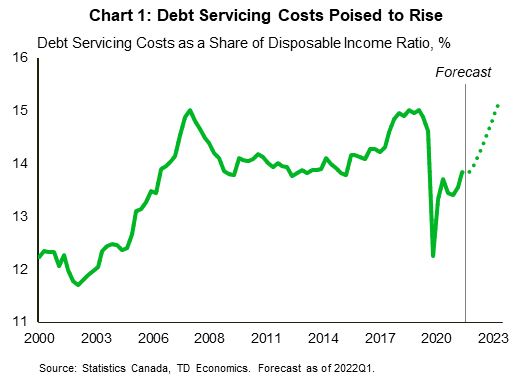
Rate hikes are underway in Canada, rekindling familiar concerns about the financial vulnerability of Canadian households. Even prior to the health crisis, Canadians held a significant amount of debt. That pile grew bigger during the pandemic, as households binged on cheap (mostly mortgage) credit. These lower interest rates also kept debt servicing costs down. Even as debt balances rose, the interest-related portion of the bill fell, offsetting higher principal payments. This is about to change. The debt service ratio is on track to surpass its pre-pandemic peak by the end of 2023 (Chart 1). This will lead households to spend an additional $43 billion on debt servicing over the next two years.
As interest rates turn from tailwind to headwind, higher debt servicing costs could spell financial troubles for some households. Credit performance indicators, such as insolvency and delinquency rates, which saw significant improvement during the pandemic, have likely hit their trough and will begin to trend higher in the face of rising interest rates and surging inflation.
Fortunately, households are facing those headwinds from a position of strength. The labour market is very healthy and household balance sheets have improved through the pandemic. Furthermore, the composition of household debt has shifted away from consumer debt and towards amortizing debt with fixed payments, which should cushion the blow. Provided the labour market stays healthy, most borrowers should be able to remain current on their payments in the rising interest rate environment. But the Bank of Canada will need to remain vigilant to the vulnerability created by high household indebtedness as it looks to take rates higher.
Households Face Higher Rates from a Position of Strength
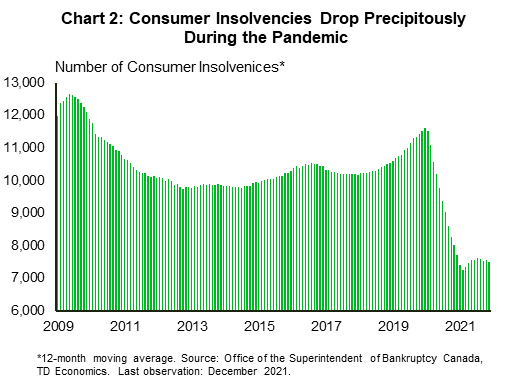
Before we delve into the impact of higher interest rates, it is important to take a step back and review the current state of household financial health. On this front, households have seen a notable and broad-based improvement in their finances during the pandemic. Low interest rates, loan payment deferrals, extensive government fiscal support, rising wealth and accumulated saving have all led to improvement in financial risk indicators. Delinquency rates have declined across all financial products. The number of households filing for insolvency is also well-below pre-pandemic levels both in absolute and in per-capita terms (Chart 2). Last year, average monthly insolvency claims were about 30% below their 2011-2019 average.
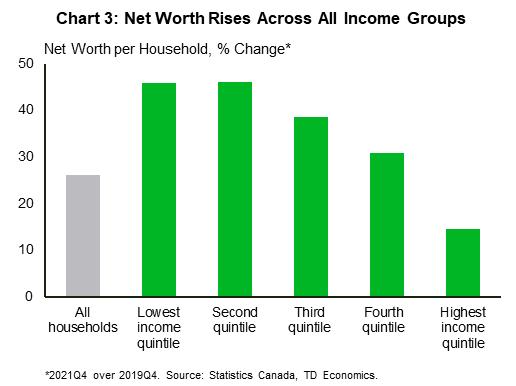
Canadians also saw strong gains in their asset portfolios, which benefited from rising property and equity prices. Household net worth has risen by nearly 30% since the fourth quarter of 2019. Even more encouraging, higher asset prices have benefited households across all income groups (Chart 3).
While households took on more mortgage debt during the pandemic, their consumer credit balances have declined. As a result, a larger portion of household debt is now mortgages, which amortize and has primarily fixed payments. This should make payments more predictable and reduce exposure to interest rate surprises.
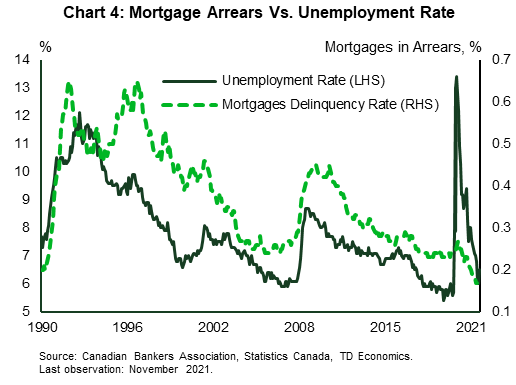
Last but not least, interest rates are rising at the time when the labor market is tight, and wage growth is picking. Rising employment and income will help to mitigate some of the drag emanating from higher rates. Historically, labour market performance has been a key driver of mortgage delinquencies (Chart 4). This suggests that unless the labour market sours, most mortgage borrowers should remain current on their payments even as interest rates increase.
Higher Interest Rates Will Cool Demand for Credit
New borrowers will feel the impact of higher interest rates the most. Higher rates will raise borrowing cost on new loans and temper demand for credit. When it comes to consumer loans, interest rates on secured and unsecured lines of credit are directly tied to the Bank of Canada’s policy rate, and will increase in tandem with rate hikes. Interest rates set on personal loans, such as car loans, will be impacted to a lesser extent, while those on credit cards are not directly affected by changes in the prime rate.
As for mortgages, as rates rise, the impact will be felt most acutely by first-time buyers and investors. The five-year fixed-term interest rate is expected to end this year at least 130 basis points higher than it was at the end of 2021. For an average-priced home with 20% down payment, higher interest rates combined with a jump in home prices in the first quarter of this year will result in a monthly mortgage payment that is about $600 higher at the end of 2022 than a year ago. Factoring in some modest home price growth over the rest of 2022 would lead to an even larger jump in monthly payments.
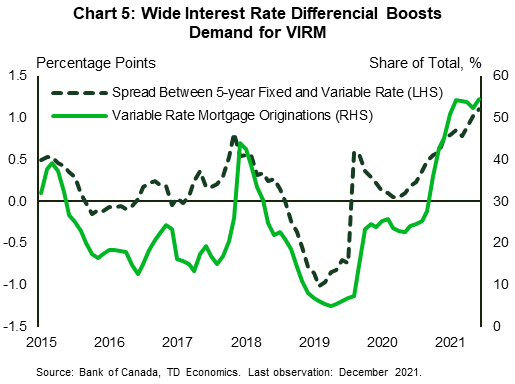
Variable rates are expected to rise by at least 150 basis points by the end of 2022. Higher rates will temper demand for mortgage credit broadly, but will also sway borrowers away from variable rate mortgages, as has occurred in previous instances when variable rates rose (Chart 5).
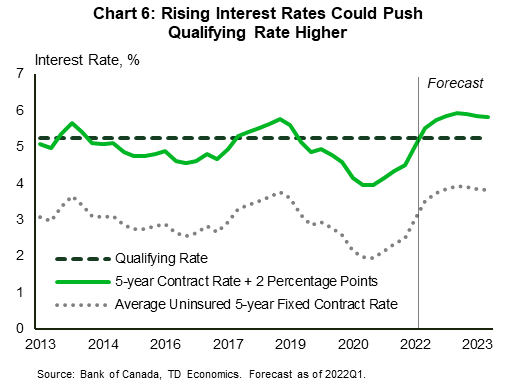
Higher interest rates could also limit borrowers’ ability to qualify for mortgages. Currently the qualifying rate is set at either 5.25% or the offered contract rate plus 2%, whichever is higher. Until recently, most borrowers were qualified at 5.25% as opposed to the contract rate, however, given the expected increase in mortgage rates, the qualifying rate for borrowers looking for a 5-year fixed rate is likely to move above this threshold next quarter, making it harder to get a mortgage (Chart 6).
Zooming In on Variable Rate Mortgages
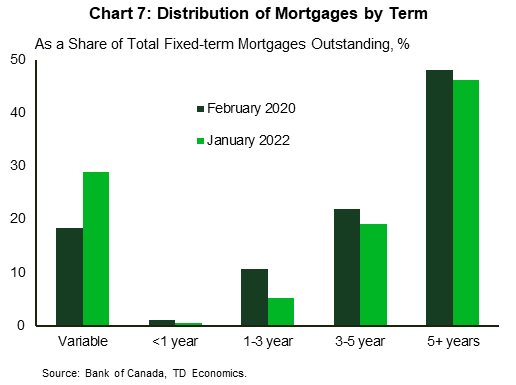
The popularity of variable rate mortgages has increased considerably during the pandemic. Until the Bank of Canada raised the overnight rate in March, variable mortgage rates were at rock bottom levels, leading to a widening spread between the variable and the five-year fixed rate. It is little surprise that demand for variable rate mortgages surged accounting for more than half of all originations in 2021. As a result, variable interest rate mortgages (VIRM) now account for nearly 30% of all outstanding mortgage credit – up considerably from 18% prior to the health crisis (Chart 7).
Most VIRM borrowers might not see any changes in their monthly mortgage bill as most them are structured with fixed monthly payments. This means that total mortgage payments stay fixed even as rates increase, but more of the payment goes toward interest and less to principal. This will shelter borrowers from higher interest rates in the near-term, but there could be implications when borrowers renew their mortgage. Keeping payments fixed in a rising interest rate environment lengthens the amortization of the loan, meaning that the borrower could face higher monthly payments when renewing in order to remain on the original amortization schedule.
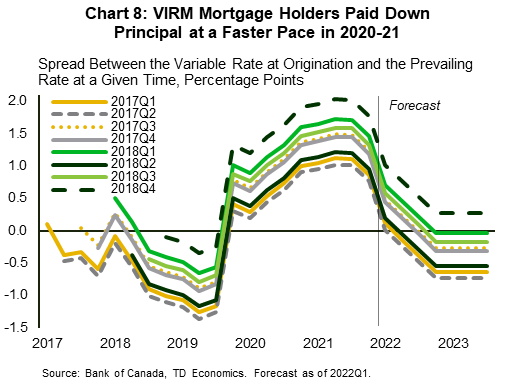
Still, many variable rate borrowers likely have some room to absorb higher rates before those will start pressuring their amortization. Variable rates were in decline since October 2019 until the end of 2021, enabling many existing VIRM holders to repay their mortgage ahead of their amortization schedule. Chart 8 shows that among VIRM borrows who will be renewing in 2022-2023 window, most have been paying down their mortgage ahead of their schedule over the last two years. Some of these borrowers (particularly those two took out a mortgage in 2017 and will be renewing this year) will face higher variable rates on renewal relative to their original interest rates, but this should be manageable if rates do not rise even faster than anticipated.
Variable rates have been relatively flat since the beginning of 2021, leaving borrowers who took out rates during this period the most “at risk” upon renewal in about five years’ time. Such loans account for about 10% of outstanding mortgages. Still, if they have at least a 20% equity stake in their home, these borrowers may be able to avoid higher payments by stretching out their amortization upon renewal.
Impact on Fixed-Rate Mortgage Holders
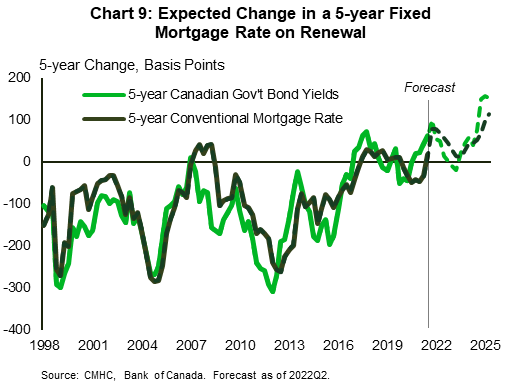
Most Canadian mortgage holders have fixed-rate mortgages. About 65% of outstanding mortgages have terms of 3 years or longer, with the 5-year term remaining the most popular, accounting for 46% of outstanding mortgage credit (Chart 7). For borrowers with 5-year fixed mortgages, the impact will vary depending on the interest rate at origination and their renewal date. For example, borrowers on a 5-year fixed renewing this year (such borrowers account for about 14% of mortgage debt outstanding) who would like to take out another 5-year mortgage could face a relatively significant interest rate increase on renewal of around 75 basis points. However, those renewing in 2023 might see little to no change in their borrowing cost because their interest rate was already comparatively high in 2018 when those mortgages were originated (Chart 9). Looking beyond 2023, homeowners renewing in 2024 and 2025 could once again see an increase in their mortgage rates since they took out a mortgage during a period of low interest rates during the pandemic.
HELOCs Present an Uncertainty
In addition to mortgages, home equity lines of credit (HELOCs) ballooned during the pandemic as homeowners took advantage of significant home price appreciation and low interest rates to renovate their existing houses, buy investment properties or consolidate debt.
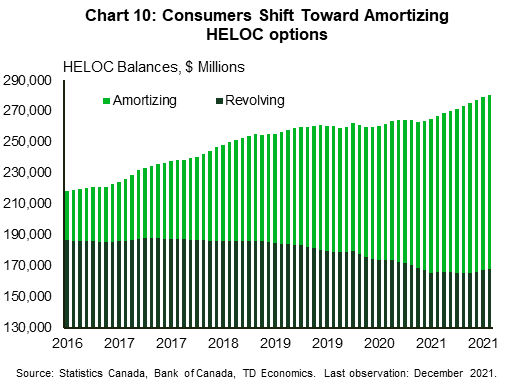
HELOC loans are exposed to changes in both variable and fixed rates since they can consist of both amortizing and revolving portions. Households’ exposure to higher interest rates via HELOCs is difficult to assess. On one hand, HELOC balances are higher than they were prior to the pandemic, but at the same time, a larger share of those balances is amortizing. The share of revolving HELOC balances declined by nearly 10 percentage points during the pandemic to about 60% down from 70% previously (Chart 10).
A rotation of HELOC balances away from revolving (which are sensitive to changes in the Bank of Canada rate) and toward amortizing component (the bulk of which have fixed-term rates) should, in principle, make future payments more predictable. Still, more than half of HELOC balances are revolving, suggesting that exposure to higher rates remains significant. Analysis by Equifax found that during the previous Bank of Canada rate hiking cycle in 2017-2018, delinquency rates on non-mortgage loans increased significantly more for borrowers with HELOC products relative to other borrowers, suggesting that consumers with HELOC balances are potentially more at risk from higher rates (Table 1).
Table 1: Non-Mortgage Delinquency
| Cumulative Change in the Bank of Canada Rate | 2017Q3 vs. 2016Q3 | 2018Q3 vs. 2016Q3 | 2019Q3 vs. 2016Q3 |
| Up 50 basis points | Up 100 basis points | Up 125 basis points | |
| All borrowers | -6% | -1% | 10% |
| With HELOC | -4% | 2% | 19% |
Exposure to Consumer Credit Declines
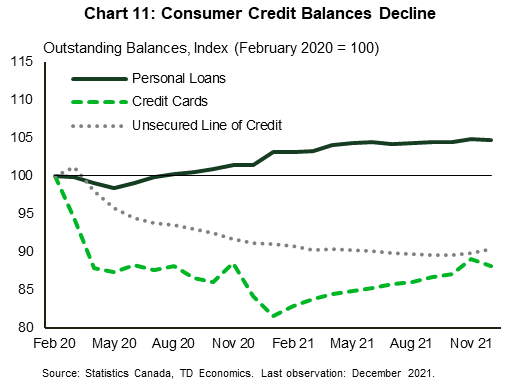
Housing-related debt grew during the pandemic, but exposure to consumer credit had declined. Consumer credit now accounts for 26% of household debt – down from 30% prior to the pandemic – with consumers carrying lower balances for all types of loans, other than personal loans (consisting mainly of car loans) (Chart 11).
Consumer credit plays a prominent role when it comes to consumer insolvencies. Data suggests that the bulk of borrowers filing for insolvency are non-homeowners, with significant of unsecured debt. Last year, the average insolvent debtor in Ontario owed $50,500 in unsecured debt.1 In contrast, only 3% of people filing for insolvency in Ontario last year were homeowners. On that front, it’s encouraging that non-mortgage debt balances declined for lower income quintile households (Chart 12).
That being said, together with rising debt service costs, rapidly increasing consumer prices, particularly on items such as food, gasoline and rents, threaten to squeeze budgets of low-income households. This could undo the improvement in financial health they’ve experienced during the pandemic. Another source of risk is an increase in tax-driven consumer insolvencies as Canada Revenue Agency resumes collection actions and ends interest relief on outstanding tax obligations for households that received Covid-19 benefits. Finally, official credit data may not be capturing all consumer credit obligations. For example, “buy now, pay later” payment plans offered by fintech companies have grown in popularity during the pandemic, but this data is not currently being captured by credit rating agencies.
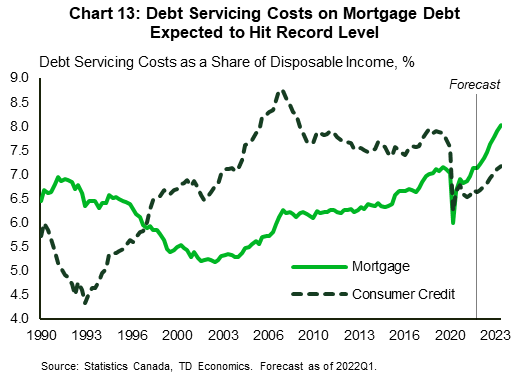
When it comes to households with a mortgage, they too will need to remain disciplined with their consumer credit balances. Mortgage payments are expected to take up a larger portion of household income relative to what has been the case historically. In fact, as a share of income, mortgage debt service payments are expected to reach an all-time high. By contrast, debt payments on consumer credit will account for a smaller share of disposable income relative to history, assuming cumulative growth in consumer credit over the next two years does not exceed 6% imbedded in this forecast (Chart 13).

Bottom Line
The days of low interest rates are numbered. The Bank of Canada is expected to make a series of brisk rate increases this year, with the overnight rate reaching its pre-pandemic level in only a half the time it took during the previous hiking cycle. Higher interest rates will cool Canadians’ appetite for new credit and slow growth in household debt. This in turn should stabilize the debt-to-income ratio.
Existing borrowers will also feel the pinch of higher rates through higher debt servicing costs, which are expected to reach pre-pandemic peak toward the end of 2023. Given the headwinds emanating from higher debt payments and surging inflation, as well as expiry of COVID-19 assistance programs, we anticipate some deterioration in credit performance as the tightening cycle matures. Fortunately, households are facing those headwinds in a strong labour market. As long as job growth persists, most borrowers should be able to accommodate higher interest rates and remain current on their debt obligations. Lower-income households remain vulnerable as they face a triple whammy of higher consumer prices and interest rates, and the loss of pandemic support programs. There is also some evidence to suggest that households with HELOC loans are more at risk of falling behind on payments as rates rise.
All in all, significant household indebtedness remains a vulnerability, which adds an extra layer of risk for the Bank of Canada’s tightening plans. It will need to remain vigilant to make sure this hiking cycle does not end in tears.
End Notes
- Hoyes Michalos Annual Bankruptcy Study. https://www.hoyes.com/press/joe-debtor/
Disclaimer
This report is provided by TD Economics. It is for informational and educational purposes only as of the date of writing, and may not be appropriate for other purposes. The views and opinions expressed may change at any time based on market or other conditions and may not come to pass. This material is not intended to be relied upon as investment advice or recommendations, does not constitute a solicitation to buy or sell securities and should not be considered specific legal, investment or tax advice. The report does not provide material information about the business and affairs of TD Bank Group and the members of TD Economics are not spokespersons for TD Bank Group with respect to its business and affairs. The information contained in this report has been drawn from sources believed to be reliable, but is not guaranteed to be accurate or complete. This report contains economic analysis and views, including about future economic and financial markets performance. These are based on certain assumptions and other factors, and are subject to inherent risks and uncertainties. The actual outcome may be materially different. The Toronto-Dominion Bank and its affiliates and related entities that comprise the TD Bank Group are not liable for any errors or omissions in the information, analysis or views contained in this report, or for any loss or damage suffered.
Download
Share this: