Show Me the Money: Canada’s Financial Flows and the Test of the U.S. Relationship
Maria Solovieva, CFA, Economist | 416-380-1195
Date Published: February 2, 2026
- Category:
- Canada
- Latest Research
- Government Finance & Policy
Highlights
- The United States remained the dominant destination for Canadian investment in 2025, with flows tracking about 8.0% of Canada’s GDP. This left Canada a net lender to the U.S. for the ninth straight year.
- Portfolio investment accounted for nearly all Canadian net new flows into the U.S., split roughly evenly across cash, bonds and equities. U.S. portfolio flows into Canada were also strong but concentrated almost entirely in debt.
- FDI is where the cracks have emerged. Cross-border direct investment has slowed, highlighting how trade uncertainty weighs on long-term, productivity-enhancing investment.
- Canada’s longer-term resilience will depend on its ability to broaden trade and investment relationships beyond the U.S. While this will take time, early signs of this gradual diversification could begin to emerge in 2026.
Shifts in trade flows between the U.S. and Canada have been stealing most of the spotlight so far during Trump 2.0. An equally important question is to what extent – if any – the path of financial flows has been altered between the two countries. The latter is the focus of this piece.
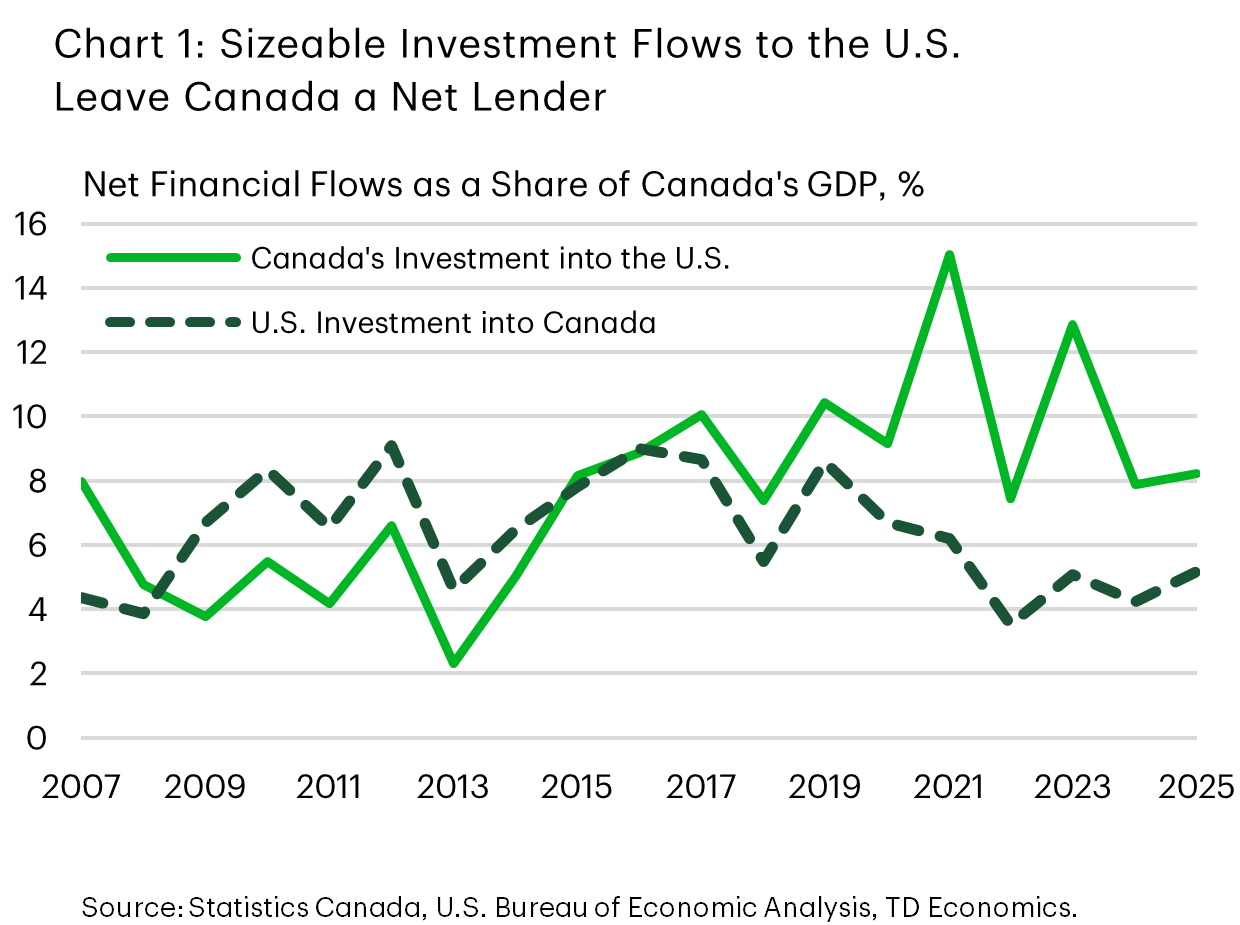
While Canada’s full-year financial accounts for 2025 are not yet released, the data available through Q3 allow us to draw clear conclusions about the overall direction. Chart 1 reveals an overall investment picture last year that wasn’t significantly different from 2024. The United States remained the dominant destination for Canadian investment abroad. Through Q3 2025, Canadian households, businesses and governments acquired more than C$230 billion in U.S. assets, and if the pace is sustained, total flows could reach roughly C$255 billion by year-end, or 8.0% of Canada’s nominal GDP. While this would place 2025 slightly above 2024, it remains below peaks seen in 2021 and 2023, when annual flows reached roughly $380 billion, equivalent to 15.1 and 12.9% of GDP, respectively.
By comparison, U.S. investment in Canada over the same period is expected to total around C$150 billion, or just over 5% of Canada’s GDP. The gap between these flows implies that Canada continued to run a sizeable net financial outflow to the United States and has remained a net U.S. lender since 2017. These figures underscore the depth of Canada’s economic exposure to, and interest in, the U.S. market. That said, not all forms of investment tell the same story, so it’s worth looking at the details.
Portfolio Investment: The Dominant Channel
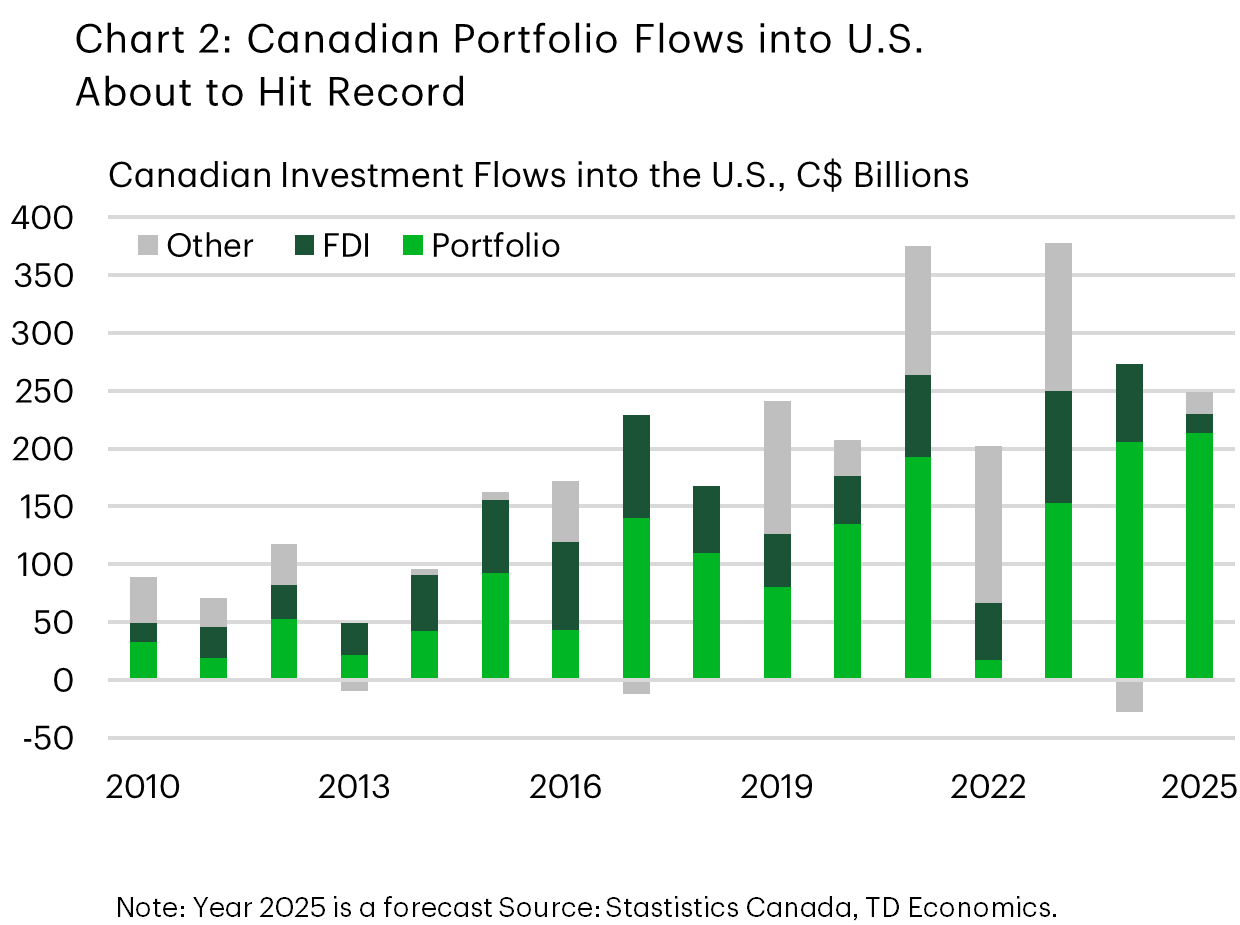
Virtually all of Canada’s net investment flows into the U.S. last year were accounted for by portfolio investment (Chart 2). In the first three quarters of last year, Canadian portfolio investment into U.S. securities reached C$200 billion, about C$34 billion higher than the same period in 2024, which itself had been a record year. The monthly data on international transactions in securities through November suggests that momentum has moderated somewhat in recent months. Even so, portfolio flows remain on track to set a new high in absolute terms and, at nearly 7% of Canada’s GDP, rank among the largest on record. This is occurring alongside more than C$100 billion in net divestment from other regions.
More than two-thirds of these portfolio flows this past year were directed toward U.S. debt securities, rather than equities and investment funds. Higher U.S. yields relative to those offered in the domestic market likely drove this demand, as the Bank of Canada moved further along the easing path. Within these debt holdings, flows were roughly equally split between money market instruments and longer-term securities.
The remainder of Canadian portfolio investment in the U.S. flowed into equity and investment funds, which remained positive even as the “elbows up” movement began gaining momentum in Canada. Through Q3, net investment in U.S. stocks reached C$64 billion, already exceeding full-year 2024 flows by C$8 billion, though still below the record C$131 billion registered in 2021. Demand was likely driven by strong interest in large-cap U.S. technology firms. Yet domestic equities ultimately delivered higher returns for Canadian investors – roughly 25% versus 13% on U.S. holdings, once the depreciation of the U.S. dollar is taken into account.
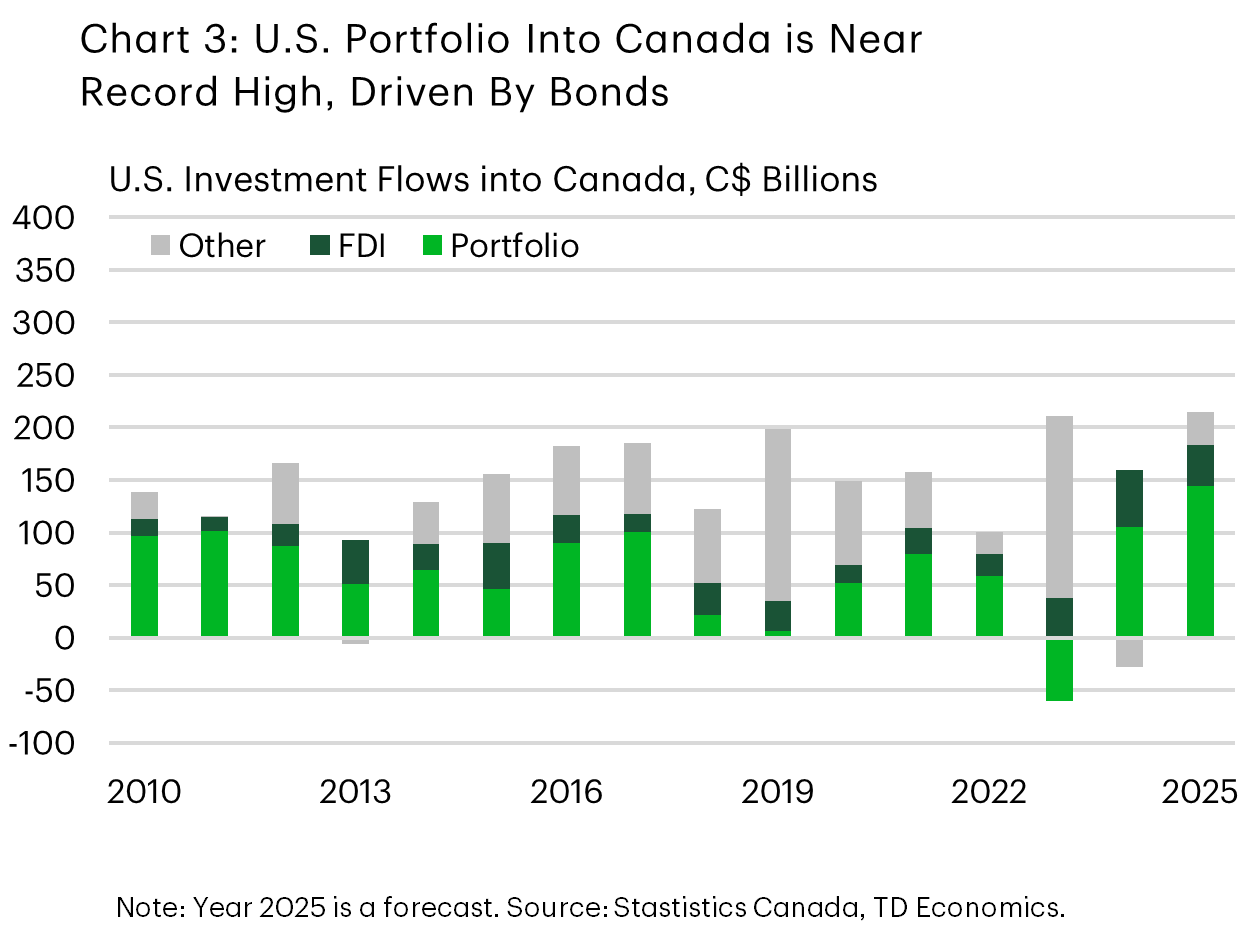
Portfolio flows from the U.S. into Canada were also robust in 2025, though entirely thanks to the debt channel. Canadian debt markets benefited from more than C$150 billion net inflows from the U.S. – the largest on record (Chart 3). This strength contrasted with a sharp pullback in investment from the rest of the world, particularly in the first half of the year, before staging a partial recovery in Q3. As a result, last year is set to be the weakest year for non-U.S. foreign investment in the Canadian bond market since 2018 (Chart 4).
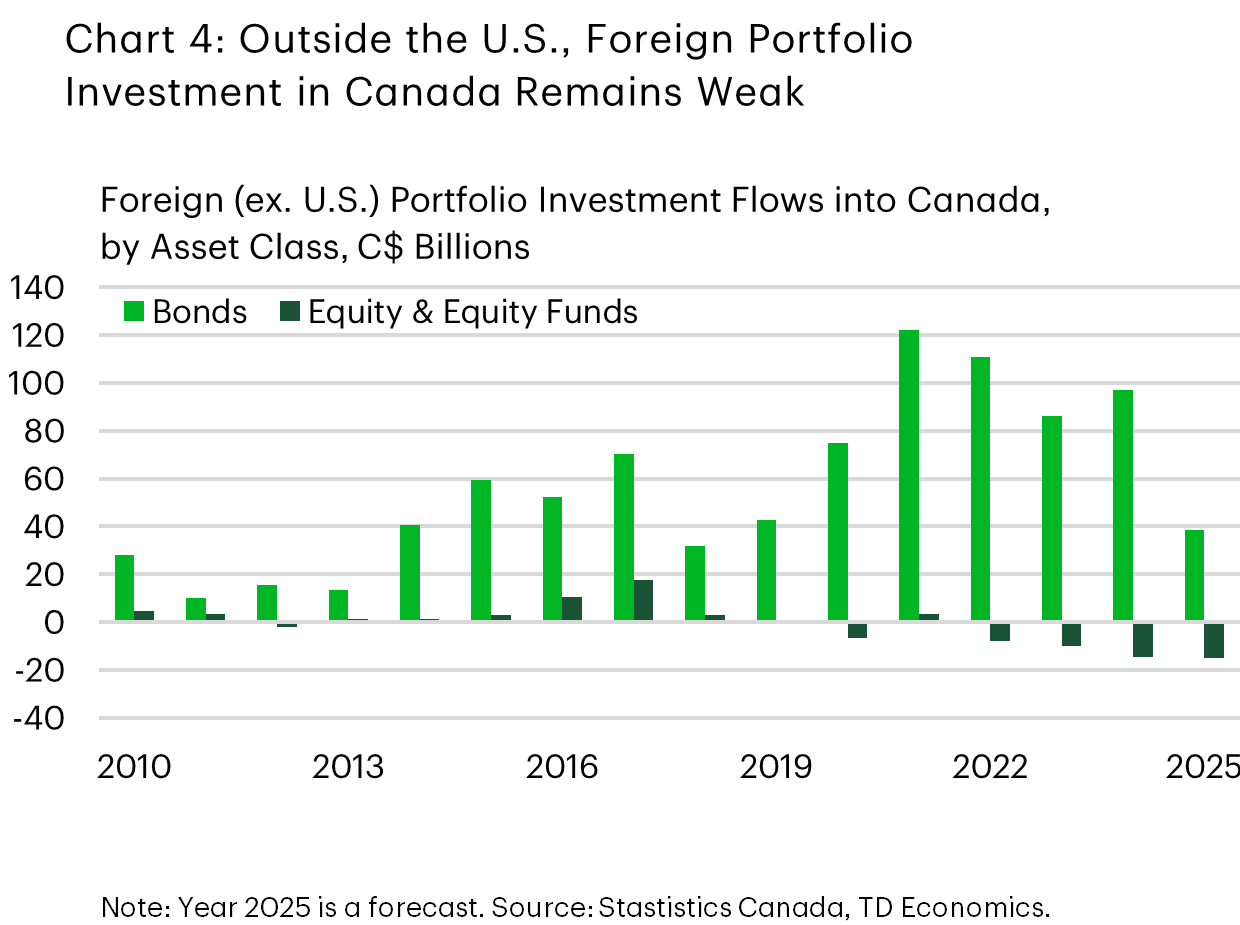
Portfolio flows into Canadian equities – already weak for much of the past decade – were tracking toward another year of a sizeable divestment in 2025, though monthly data suggests it is unlikely to surpass the record C$48 billion outflow recorded in 2023. While often dismissed as “hot money,” portfolio inflows tend to support economic activity by easing financing constraints and lowering funding costs.
Foreign Direct Investment: Under Pressure
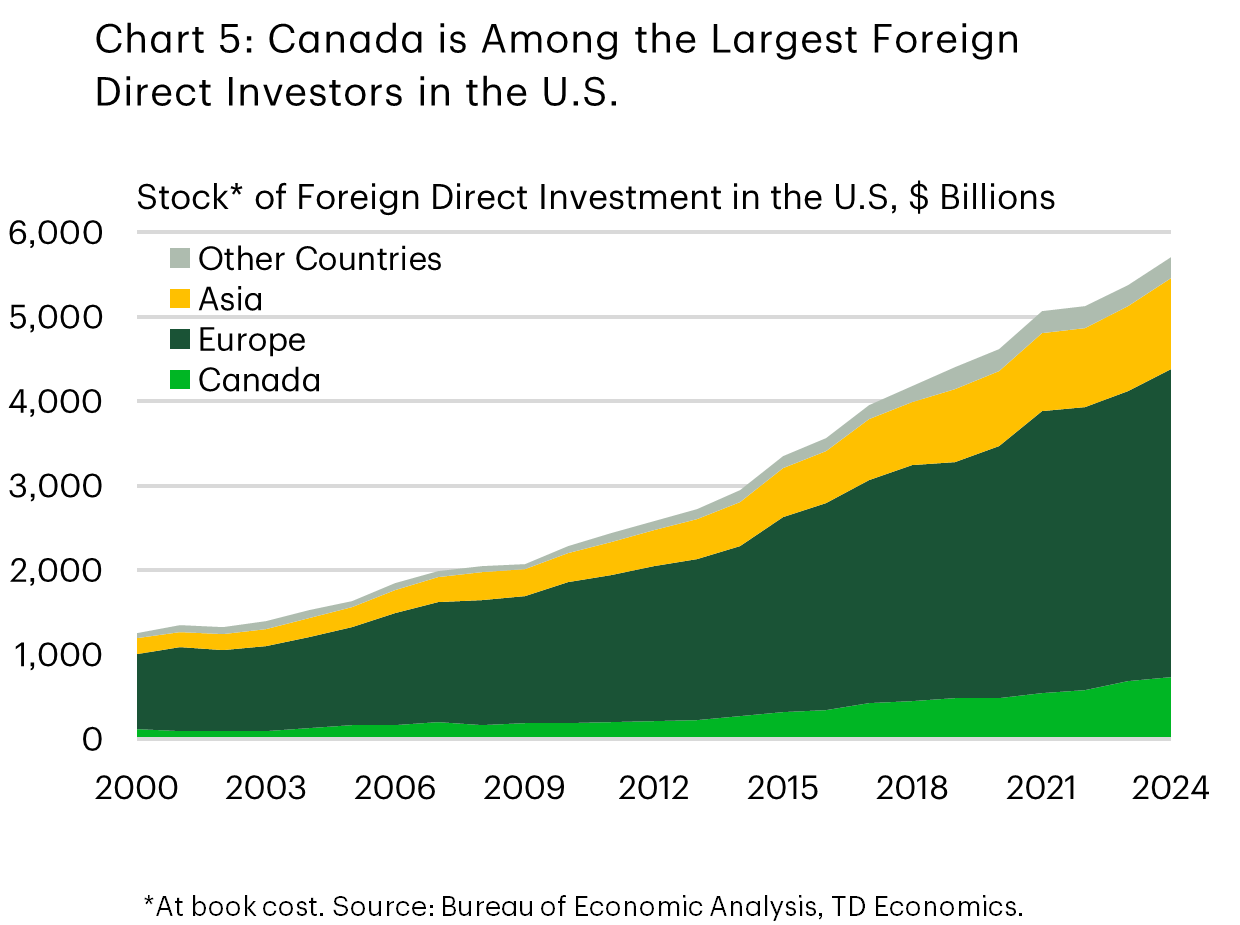
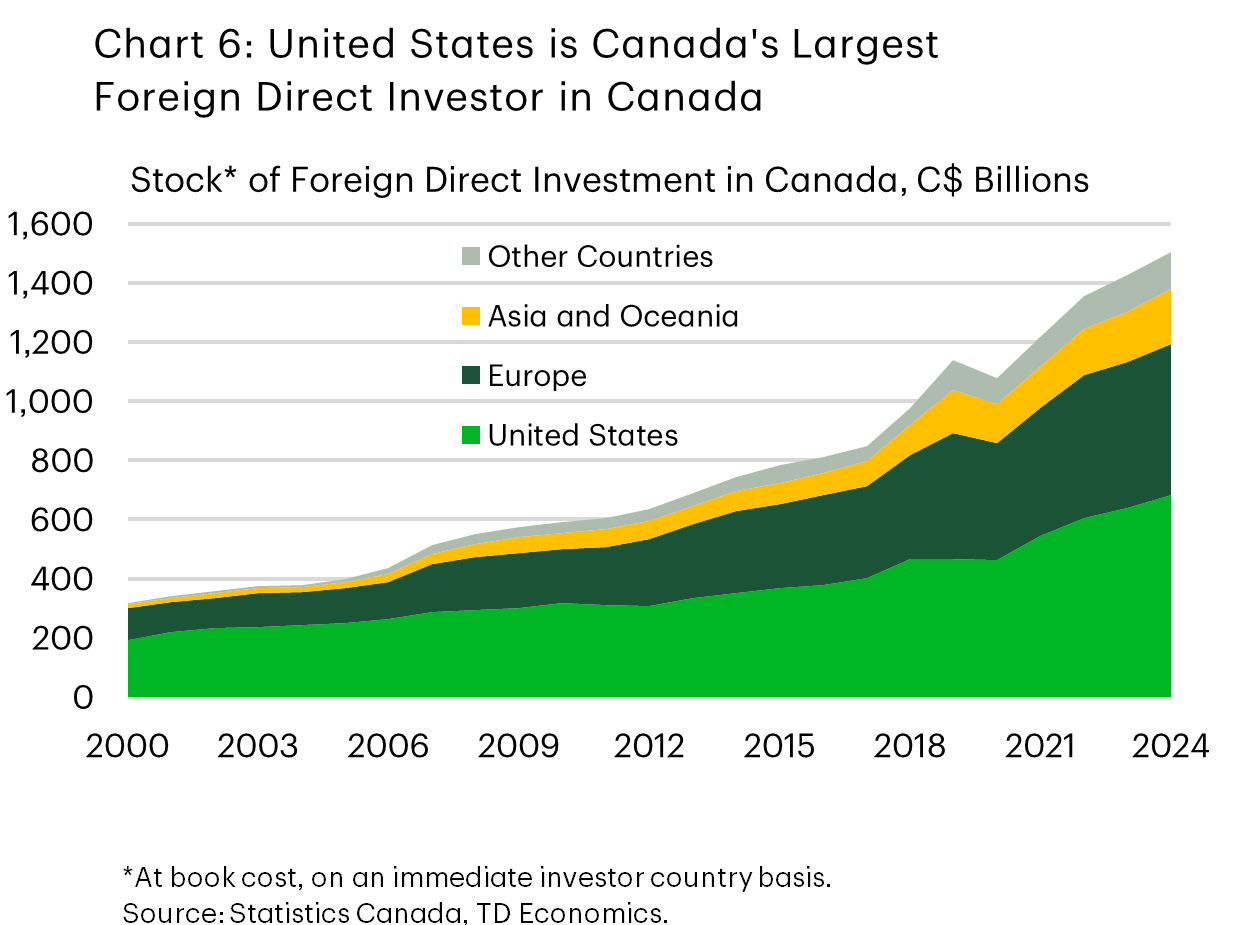
Foreign direct investment (FDI) – the “long money” component of cross-border finance – has been the area where real cracks have formed in the bilateral investment landscape. FDI matters because it is closely linked to control, production, and long-run productivity. Large projects require patient capital and confidence in long-term market access. Historically, U.S. and Canadian firms have played that role for one another, reflecting geographic proximity and strong geopolitical alignment. In 2024, Canada remained one of the top foreign direct investors in the United States, accounting for 12.8% of total U.S. FDI stock, or US$732.9 billion in book value (Chart 5). The relationship is reciprocal: the U.S. is Canada’s largest single foreign direct investor, with a stock of C$683.7 billion in book value, though its share has declined from roughly 60% in the early 2000s to 45.5% today (Chart 6).
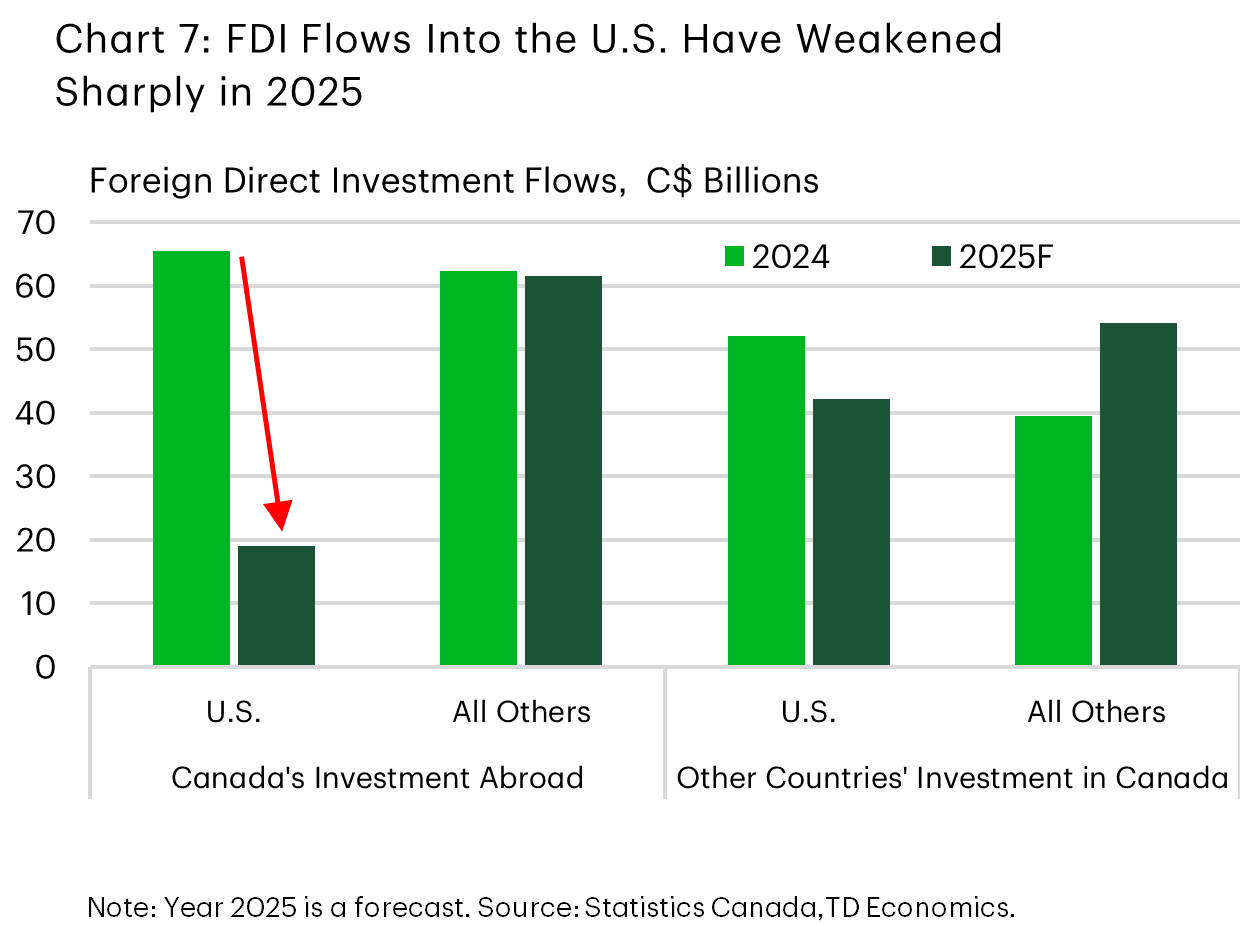
Last year, however, Canadian investors hit the pause button on new direct flows into the U.S. In the first three quarters of 2025, Canadian direct investment in the U.S. totaled just C$14.3 billion, roughly C$31.5 billion less than over the same period in 2024. Assuming a similar turnout in Q4, full-year flows are on track to reach only around C$19 billion (Chart 7). This would mark the lowest annual tally since 2009.
The main driver was a sharp pullback in mergers and acquisitions, which shifted from C$15.3 billion in net investment in 2024 to roughly C$18 billion in net divestment in 2025. Put another way, whatever modest inflows were recorded last year reflected reinvested earnings. A mix of heightened trade uncertainty, policy risk, and a reassessment of market access considerations appear to have restrained new Canadian direct investment into the United States.
U.S. direct investment into Canada has also slowed relative to last year, though flows remain positive at C$31.6 billion as of Q3 in 2025. As in Canada’s case, weaker M&A has been the main drag, partially offset by higher reinvested earnings and intra-company debt, pointing to balance-sheet restructuring rather than outright withdrawal.
Increased FDI from other countries has provided a partial offset: total inward investments into Canada reached C$40.6 billion, roughly C$10 billion more than over the same period in 2024, while Canada’s direct investment into non-U.S. destinations also rose by C$18.9 year-on-year and is expected to end 2025 at the very least as strong as last year. This dynamic does not necessarily signal de-coupling from the U.S., but rather a diversification of risks and opportunities.
It is consistent with recent government efforts to broaden Canada’s investment base. For example, Canada signed a Foreign Investment Promotion and Protection Agreement (FIPA) with the United Arab Emirates, a treaty that could help unlock a potential investment of C$70 billion into Canada – a sizeable increase from the current stock of C$8.8 billion1. Canada is also advancing FIPA negotiations with Qatar. Beyond these new formal treaties, Canada has pursued more incremental engagements with other partners, including energy cooperation discussions with China, which already has a sizeable FDI stock of roughly C$50 billion in Canada, and efforts to re-engage with India, where FDI stock remains smaller at C$7.8 billion, to facilitate greater reciprocal investment.
Bottom Line
Quarterly financial accounts data shows that Canadian investment patterns continue to be closely aligned with those of the United States. Canadian investment flows into the U.S. remain strong overall, driven by record-setting portfolio inflows, while the U.S. has continued to be the dominant foreign investor in Canada’s financial markets as other regions divested. However, early cracks are emerging in foreign direct investment, with both Canadian FDI into the U.S. and U.S. FDI into Canada slowing in 2026 – reflecting rising uncertainty around the benefits of further long-term economic integration.
Last year provided a clear lesson: trade disputes are detrimental to FDI on both sides of the border. Progress toward a more stable trade framework through a successful review of CUSMA this year would benefit both partners—not only through goods trade, but by restoring confidence in long-term investment decisions. At the same time, Canada’s longer-term resilience depends on its ability to broaden trade and investment relationships with other countries. These efforts will take time, but early signs of this gradual diversification may emerge in 2026.
End Notes
- All FDI figures in this paragraph are reported at book value and classified by ultimate investor country basis.
Disclaimer
This report is provided by TD Economics. It is for informational and educational purposes only as of the date of writing, and may not be appropriate for other purposes. The views and opinions expressed may change at any time based on market or other conditions and may not come to pass. This material is not intended to be relied upon as investment advice or recommendations, does not constitute a solicitation to buy or sell securities and should not be considered specific legal, investment or tax advice. The report does not provide material information about the business and affairs of TD Bank Group and the members of TD Economics are not spokespersons for TD Bank Group with respect to its business and affairs. The information contained in this report has been drawn from sources believed to be reliable, but is not guaranteed to be accurate or complete. This report contains economic analysis and views, including about future economic and financial markets performance. These are based on certain assumptions and other factors, and are subject to inherent risks and uncertainties. The actual outcome may be materially different. The Toronto-Dominion Bank and its affiliates and related entities that comprise the TD Bank Group are not liable for any errors or omissions in the information, analysis or views contained in this report, or for any loss or damage suffered.
Download
Share: