Dollars and Sense
Dire Straits: The Central Bank Calculus of the Iran Oil Shock
Date Published: April 16, 2026
- Category:
- Canada
- Forecasts
- Financial Markets
Highlights
- The Iran conflict has triggered a major energy supply shock, pushing oil prices meaningfully higher and extending the inflation impulse beyond what was initially expected.
- Central banks on both sides of the border are likely to look through the supply shock. Provided a longer-term peace deal is reached in the coming weeks, we still see a narrow window for the Fed to deliver on two more rate cuts in Q4.
- Longer-term Treasury yields are expected to drift 20 basis points lower by year-end, dragging Canadian government bond yields down by a similar amount. The greenback is likely to remain under pressure, while the Loonie is expected to reach 74 cents by December.
- A further escalation in the conflict would quickly result in oil prices retesting recent highs, Treasury yields turning higher and a strengthening of the dollar. Under this scenario, the Federal Reserve would likely remain on hold well into next year.
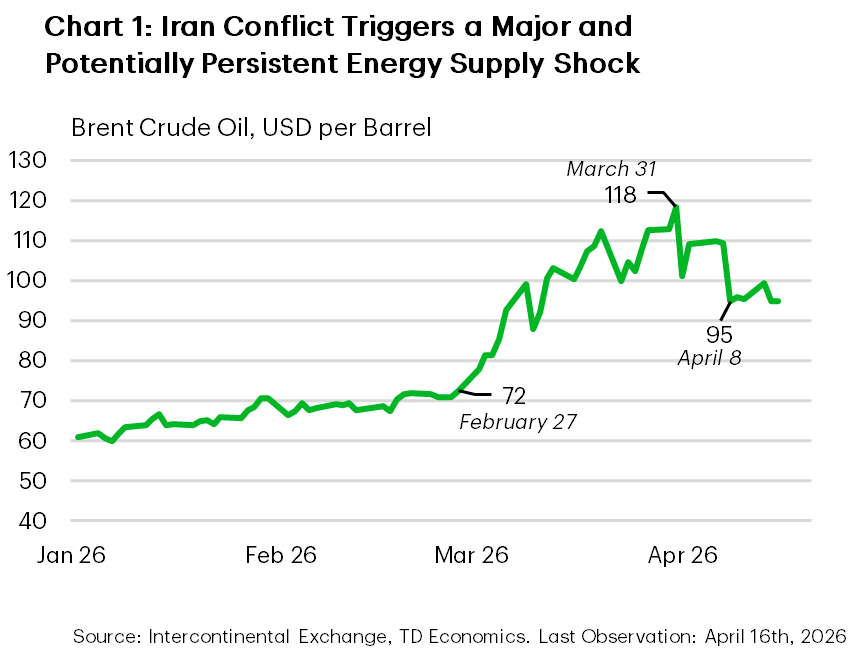
The war in Iran has produced the largest supply disruption to global energy markets in modern history. At its peak, the price of Brent crude – the global benchmark for oil prices – had reached over $118 per barrel. Prices have fallen sharply following the U.S., Israel, and Iran agreeing to a two-week ceasefire on April 7th, but at $98 per-barrel, remain considerably above pre-conflict levels (Chart 1). Through all the recent volatility, broader financial conditions have only tightened on the margin. But the situation remains incredibly fluid and could quickly re-escalate should negotiations on a longer-term peace deal fall apart.
Our revised oil forecast has WTI averaging $95 per-barrel through the Q2, with some of the risk premium coming out in H2-2026 under the assumption that a peace agreement is reached over the coming weeks. But this alone will not result in an immediate normalization of oil flows through the Strait of Hormuz. Physical bottlenecks, mine clearing operations, repositioning tankers globally and clearing port backlogs all suggest it’ll take months, not weeks, for oil flows to completely normalize.
Central Bank Expectations Have Whipsawed
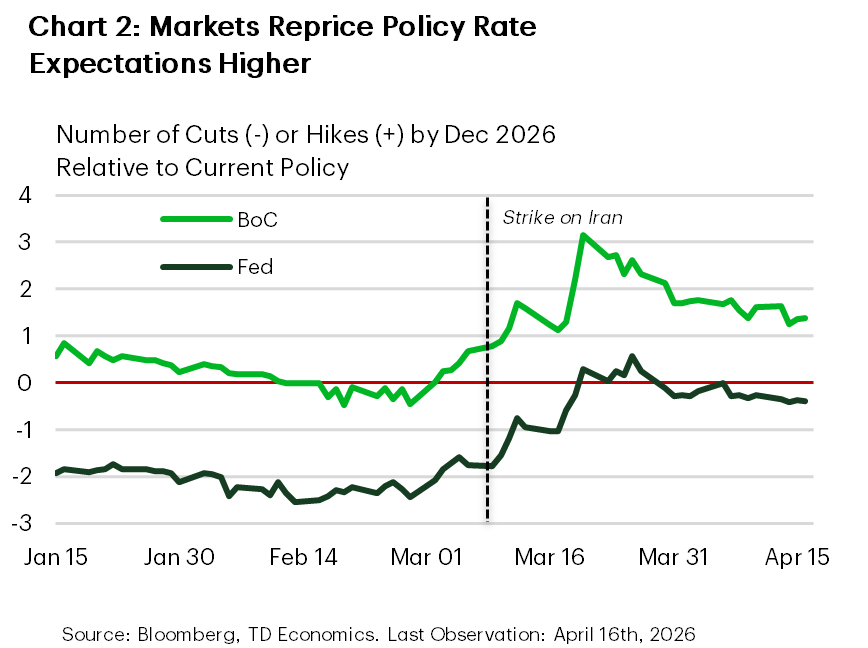
The sharp increase in energy prices is already being felt by households and businesses on both sides of the border, with gasoline and diesel prices up 38% and 43%, respectively, since late-February. With the length of the conflict unclear and the inflationary impulse already rearing its head, expectations for central bank policy actions have whipsawed. At its peak in late-March, futures had priced in nearly three quarter-point hikes from the Bank of Canada, while Fed futures went from pricing in two-cuts to just over a 50% probability of a rate hike! Cooler heads have prevailed following the ceasefire. Pricing now shows a little more than one rate hike from the Bank of Canada and for the Fed to remain on hold (Chart 2).
No Move is the Best Move … For Now
But even one rate hike from the Bank of Canada in the current environment seems unlikely. For starters, the energy shock is hitting the economy from a weak starting point. Growth has been restrained over the past year by several headwinds, including trade uncertainty, a soft housing market and tighter immigration. This has kept the economy below potential, leading to some accumulation of slack even before the onset of the war. Layering on higher energy prices would leave growth lower than our “pre-conflict” forecast, though the extent of which will be dependent on the duration of the supply disruption.
Market participants, however, appear to be more focused on the price impact of the shock. But this is misguided. Because the spike in energy prices is supply driven, there’s little monetary policy can do to offset its impact. Moreover, given its “long and variable lags”, any pre-emptive policy move to get ahead of the energy shock runs the risk of not being felt until after the shock has passed. This could lead to the worst possible outcome of failing to quell inflation, while also hitting domestic demand at a time when the economy has become more vulnerable. For the time being, the best response would be to look through the price impacts and only adjust policy on the other side should conditions warrant such a move.
The story is more nuanced in the U.S. The energy shock is hitting the economy from a point of strength. Final sales to private domestic purchasers – the best gauge of underlying demand – expanded by 2.6% in H2-2025, suggesting solid momentum heading into 2026. At the same time, growth is expected to benefit from last year’s interest rate cuts, new household and business tax cuts that came into effect this year and the ongoing push to ease regulation. An energy shock alone will not materially shift the outlook – even if crude prices were to remain elevated for another several months. This is because the U.S. has become both more energy independent and less energy intensive in recent decades. What could challenge this narrative is if financial conditions were to suddenly and dramatically tighten, which runs the risk of sending a more meaningful confidence shock through the economy. That’s not our base case, but it remains a plausible downside risk, particularly if the temporary ceasefire does not yield a more permanent resolution to end the conflict.
From the Fed’s perspective, there’s no rush to make a policy move. At today’s target range of 3.50%-3.75%, the Fed funds rate is already at the upper end of the FOMC’s median estimate of neutral. And yet, growth is still expected to run slightly above potential, even after accounting for some hit from higher energy prices.
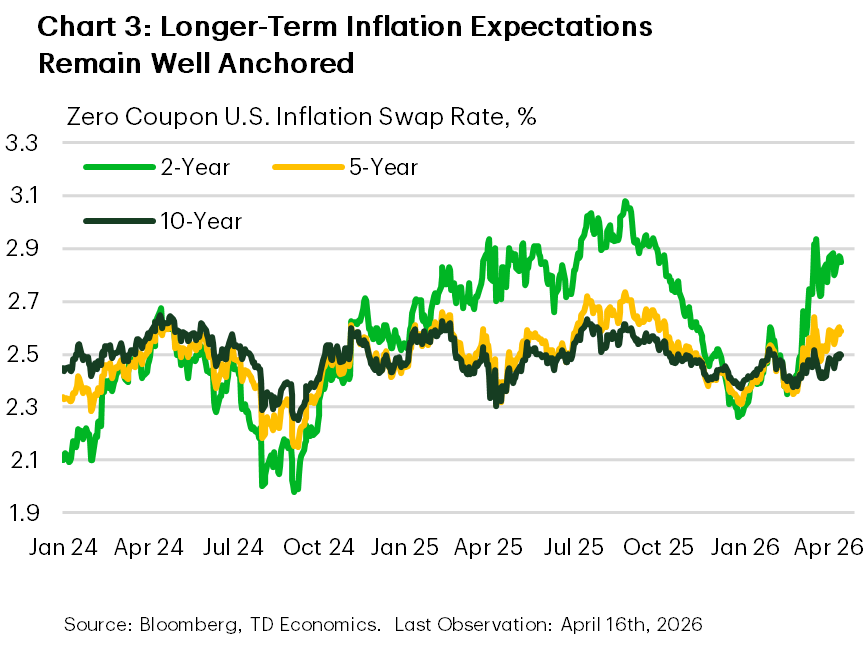
A key metric for policymakers to watch in the months ahead will be inflation expectations. This has been less of a concern in Canada, where core inflation measures have cooled to something that’s broadly consistent with the Bank of Canada’s mandate. But the same can’t be said in the U.S. And the fear for Fed officials is that the longer inflation remains structurally above its target, the greater the risk that inflation expectations become unanchored. Encouragingly, this has not yet occurred. While short-term measures have turned higher, medium-and-longer-term inflation expectations remain consistent with the Fed’s 2% inflation objective (Chart 3). But any signs of upward drift could reshape the FOMC’s thinking and start to stir chatter on whether the next move should be a rate hike.
Our baseline forecast still sees the potential for as many as two more rate cuts this year, with the risks skewed to later and potentially fewer cuts. For now, we see the Fed on hold through September. Even assuming Kevin Warsh is confirmed by the Senate Banking Committee and is in seat as the new Fed Chair by June, he’s likely to face an uphill battle convincing a majority of the voting FOMC members to support an immediate policy pivot towards lower rates. Based on the most recent “dot plot”, 14 of the 19 FOMC participants expect one or fewer cuts by year-end. Not all participants who submit forecasts are voting FOMC members, but even if all five individuals who support multiple rates cuts were voters, they would still be two votes shy of a majority.
Treasury Yields and Greenback to Head Lower
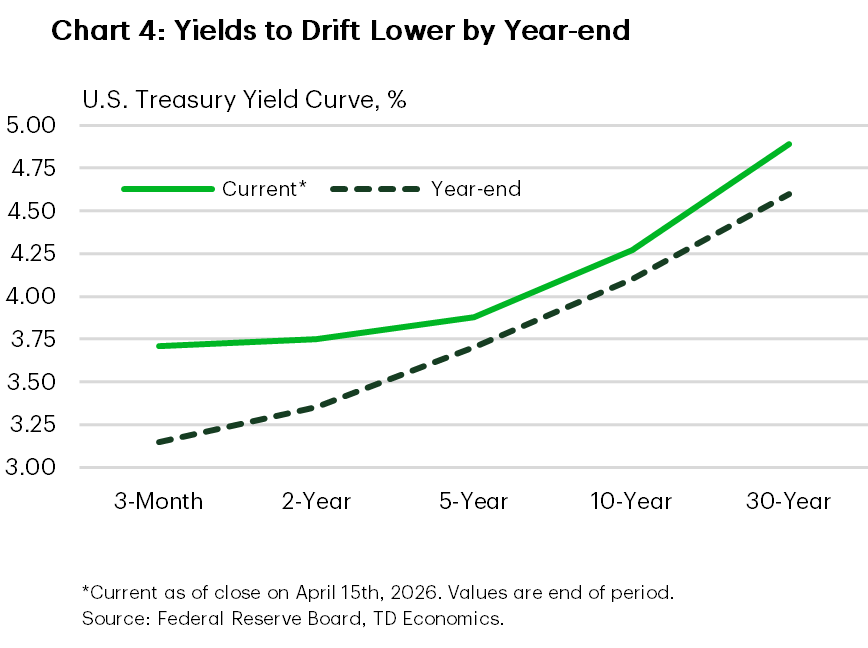
It’s this lingering risk of resurgent inflation and the knock-on effects it could have on the Fed’s ability to deliver on rate cuts that have kept Treasury yields some 30-40 basis points above pre-crisis levels. But if we’re right, and rate cuts do materialize later this year, the inflation premium that’s still priced in Treasuries should have come out. That suggests the 10-year Treasury yield will drift back closer to its pre-crisis level of 4.10% by year-end (Chart 4). On balance, a further narrowing of interest rate differentials vis-à-vis other advanced economies should work to put a bit more downward pressure on the dollar, potentially falling by another 2% by year-end. Conversely, the Loonie will be a beneficiary of the dollar’s loss. We see it gaining around 1.3 cents by the end of this year, which would bring it to 74 cents – a level not seen since late-2024.
Prolonged Disruption Would Keep Fed on Hold for Longer
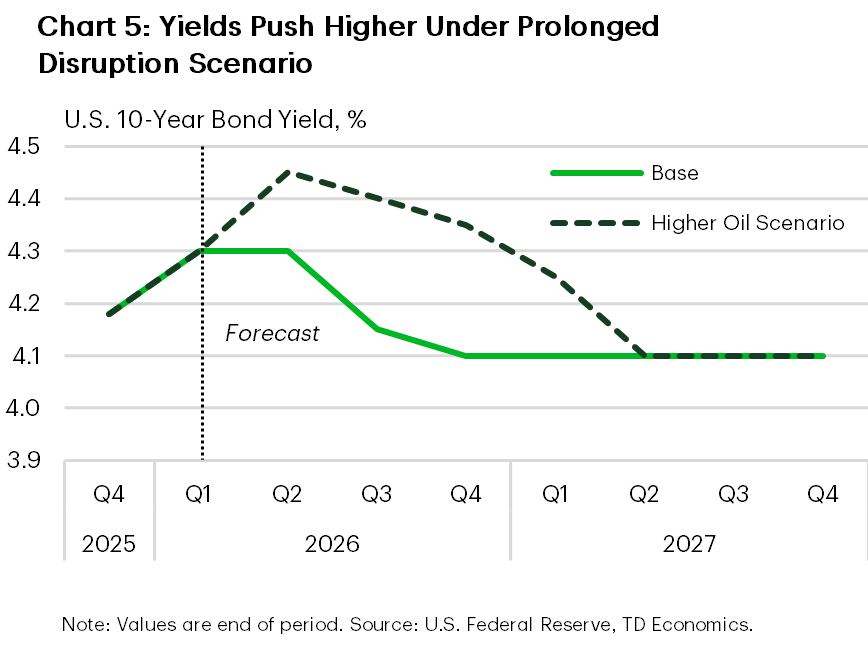
Of course, this all assumes everything goes as planned. But what if negotiations for a longer-term peace agreement were to fall apart leading to Iran maintaining strict control of tanker traffic for another few months? Under this scenario, WTI is assumed to average $128 per barrel in Q2 and drift only modestly lower through H2-2026 as physical shortages maintain a higher risk premium on oil prices through this year and into 2027. Relative to our current baseline, economic growth in the U.S. is lower by about a tenth this year (2.3% vs. 2.4%) and three-tenths next year (1.9% vs. 2.2%). Headline inflation rises by low double digits on a q/q annualized basis in Q2-2026, with secondary effects keeping core measures north of 2.5% (q/q, ann.) through H2-2027. This keeps the Fed on hold through mid-2027. The 10-year Treasury yield moves higher over the near-term – reflecting the higher inflation premium – and reaches a peak of 4.45% in Q2, before edging back to 4.3% by year-end (Chart 5). The near-term escalation reignites the flight to safety trade, pushing the dollar back up 2% again in Q2, retracing its recent depreciation, though most of this unwound by the end of the year.
In Canada, the hit to economic growth is expected to be more modest, given its higher exposure to the energy sector. Like the U.S., headline measures of inflation shoot higher over the near-term, leading to some passthrough to core prices. But given the weak economic backdrop, we wouldn’t expect the Bank of Canada to come off the sidelines. However, longer-term government bond yields drift higher over the near-term, with the 10-year reaching a peak of 3.6% before drifting back closer to today’s level of 3.45% by year-end. The Canadian dollar would again come under pressure, falling to a low of 71 cents in Q2 before firming to 73 cents by the end of the year as the flight to safety fades and higher oil prices support the currency.
Forecast Tables |
|---|
| Interest Rate Outlook |
| Foreign Exchange Outlook |
| Commodity Price Outlook |
Disclaimer
This report is provided by TD Economics. It is for informational and educational purposes only as of the date of writing, and may not be appropriate for other purposes. The views and opinions expressed may change at any time based on market or other conditions and may not come to pass. This material is not intended to be relied upon as investment advice or recommendations, does not constitute a solicitation to buy or sell securities and should not be considered specific legal, investment or tax advice. The report does not provide material information about the business and affairs of TD Bank Group and the members of TD Economics are not spokespersons for TD Bank Group with respect to its business and affairs. The information contained in this report has been drawn from sources believed to be reliable, but is not guaranteed to be accurate or complete. This report contains economic analysis and views, including about future economic and financial markets performance. These are based on certain assumptions and other factors, and are subject to inherent risks and uncertainties. The actual outcome may be materially different. The Toronto-Dominion Bank and its affiliates and related entities that comprise the TD Bank Group are not liable for any errors or omissions in the information, analysis or views contained in this report, or for any loss or damage suffered.