Highlights
- Household spending in Canada remains more evenly distributed across income groups, unlike the U.S. where spending has become increasingly reliant on the highest earners.
- The pickup in discretionary spending has also been broad-based, suggesting that monetary policy played a larger role in Canada.
- A more even spending distribution reduces the downside risk should stock markets falter, making Canada’s growth less dependent on high-income households than in the United States.
Historically high stock prices have raised questions about whether the recent strength in consumer spending is driven by wealth gains among higher income households. This is what economists call “wealth effects”. Some U.S. economists have recently argued that spending growth south of the border now rests heavily on the highest earners. In Canada, however, the recent strength in consumer spending has been more broad-based across income cohorts.
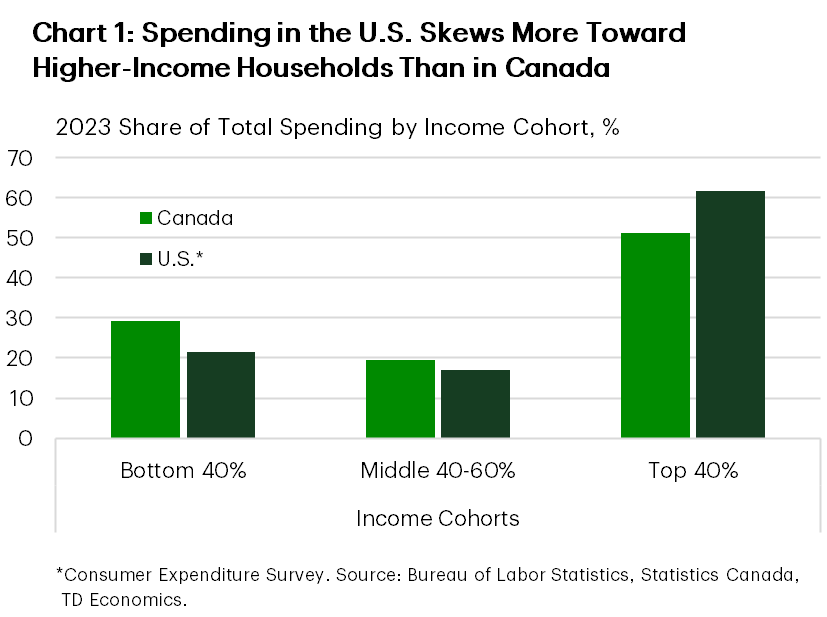
To set the stage, it’s worth recalling that personal spending in the U.S. has long been more “top-heavy”. According to the Bureau of Labor Statistics’ Consumer Expenditure Survey, the top 40% of income earners accounted for 61% of all spending in America in 2023, compared with 51% in Canada (Chart 1). More recent estimates by Moody’s economists suggest the gap is even wider1. Using Financial Accounts data, Moody’s economists derive personal outlays – a broader measure that implicitly captures homeowners’ equivalent rent, social transfers in kind, donations and non-mortgage interest payments. On this basis, the top 40% of earners accounted for 80% of U.S. spending in Q2 2025. In other words, the U.S. consumer engine is increasingly fueled by the highest income households, with growth supported by gains in asset prices.
Canada’s story stands in contrast. Statistics Canada’s Q2 2025 Distributions of Household Economic Accounts show that household final consumption expenditure remains more evenly spread across income groups. The top 40% accounted for 53% of household expenditures in Q2 2025. A broader measure of consumption, more aligned with Moody’s methodology, which includes services received in kind, but excludes non-mortgage interest payments and donations, places this share at 49.2%. This suggests greater weighting of spending towards middle- and lower- income groups.
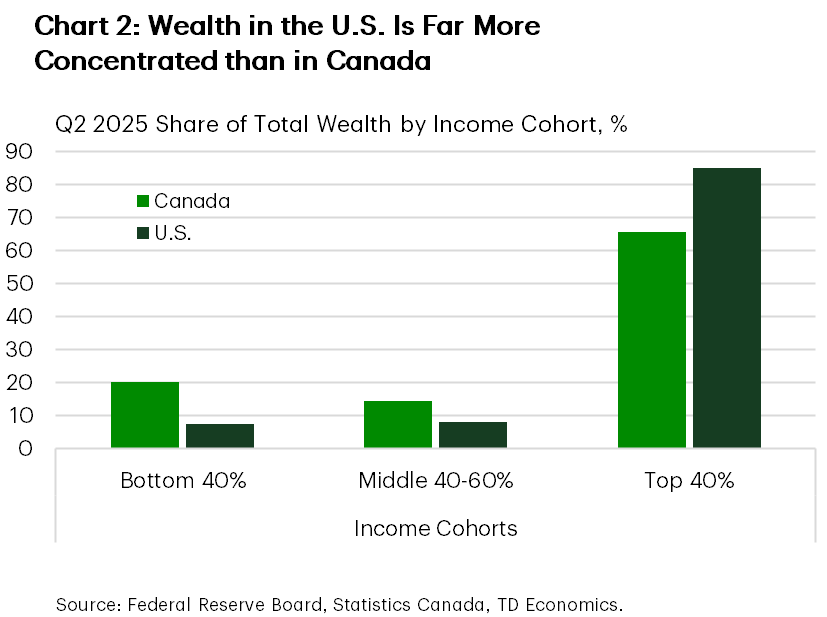
There are also notable differences in the distribution of wealth, suggesting that wealth effects are more evenly spread in Canada. In the United States, wealth remains far more concentrated: the top 40% of income earners held about 85% of total wealth in Q2 2025, compared with 66% in Canada (Chart 2). In both countries, year-on-year gains in wealth were strongest among higher-income households – the top 40% saw their wealth rise almost twice as fast as those of lower- and middle-income groups. In the U.S., this concentration carried through to consumption, with spending growth among top earners outpacing other cohorts, according to Moody’s estimates. In Canada, however, similar wealth dynamics didn’t produce the same divergence in behaviour: despite faster wealth growth at the top, spending increased at roughly the same pace across the income distribution.
When we dig deeper into Canada’s spending by category, isolating discretionary spending that would typically reveal wealth effects, the data still show a relatively even distribution across income groups. Chart 3 examines second-quarter growth over the past five years and suggests that monetary policy, rather than asset gains, played a larger role in shaping spending.
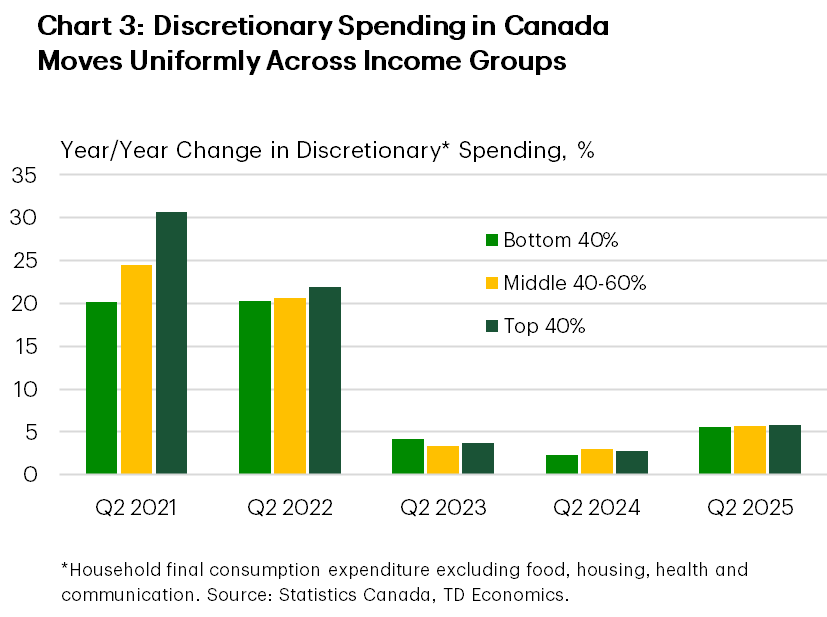
Let’s take a closer look. Discretionary spending, which in our breakdown also includes transportation and financial services (categories that straddle essential and cyclical spending), surged in 2021 as the economy re-opened and interest rates fell to record lows. Growth among the top 40% of households outpaced that of the bottom 40% by about 10 percentage points. By 2022, discretionary spending growth had become much more uniform – around 20% year-on-year, before downshifting to below 5% in 2023-24 as borrowing costs rose. That cooling was not confined to lower income families, the top-40% cohort moved in step.
The rebound in 2025 may partly reflect renewed wealth effects, but the fact that spending strengthened across all income groups suggests that the lagged impact of monetary policy – and perhaps easing trade tensions – played at least as important a role as asset gains. Another common driver of household spending – income growth – likely played a limited role, as it has slowed across all cohorts relative to last year and wasn’t stronger for the higher income cohorts.
Bottom Line
Canada’s consumer spending outperformance in Q2 helped cushion the economy against the drag from trade tensions. Statistics Canada’s Distributions of Household Economic Accounts show that households across all income distributions were active contributors to that resilience, whether supported by monetary policy or modest wealth effects.
The recent acceleration in discretionary spending was also broad-based, arguing against the highest income households driving spending as has been advanced south of the border. A more even spending distribution points to less downside risk if stock markets falter. That doesn’t make Canadians immune – high debt-service ratios remain a constraint – but it does mean growth is less dependent on high-income spenders than in the United States.
End Notes
- “Estimates of Personal Savings, Personal Outlays and Excess Savings by Demographic Group”, Moody’s Analytics. March 2025. https://www.economy.com/getfile?q=8D6D0EAF-E677-4FDA-988D-60C0E9D34A8B&app=download.
Disclaimer
This report is provided by TD Economics. It is for informational and educational purposes only as of the date of writing, and may not be appropriate for other purposes. The views and opinions expressed may change at any time based on market or other conditions and may not come to pass. This material is not intended to be relied upon as investment advice or recommendations, does not constitute a solicitation to buy or sell securities and should not be considered specific legal, investment or tax advice. The report does not provide material information about the business and affairs of TD Bank Group and the members of TD Economics are not spokespersons for TD Bank Group with respect to its business and affairs. The information contained in this report has been drawn from sources believed to be reliable, but is not guaranteed to be accurate or complete. This report contains economic analysis and views, including about future economic and financial markets performance. These are based on certain assumptions and other factors, and are subject to inherent risks and uncertainties. The actual outcome may be materially different. The Toronto-Dominion Bank and its affiliates and related entities that comprise the TD Bank Group are not liable for any errors or omissions in the information, analysis or views contained in this report, or for any loss or damage suffered.
Download
Share: