Highlights
- After declining during the pandemic, the number of Canadians experiencing financial troubles and filing for insolvency is on the rise.
- The negative dynamics may seem at odds with the red-hot labour market, but this trend in personal insolvencies reflects a normalization from the ultra-low levels of the pandemic. In both absolute and per capita terms personal insolvencies remain well-below their 2019 levels.
- Personal insolvencies increased coast-to-coast last year, in part driven by changes in household debt. Provinces with more favourable recent trends in household debt-to-income ratios experienced smaller increases in insolvencies.
- Business insolvencies rose at an even faster clip last year. Bankruptcies increased across nearly all industries, but rose especially briskly in some of the sectors that were hit hardest by pandemic restrictions.
- Looking ahead, financial headwinds, such as inflation and rising debt servicing costs, will likely persist or intensify this year. The labour market is also expected to be less supportive. Together they are likely to push consumer insolvencies above their pre-pandemic average.
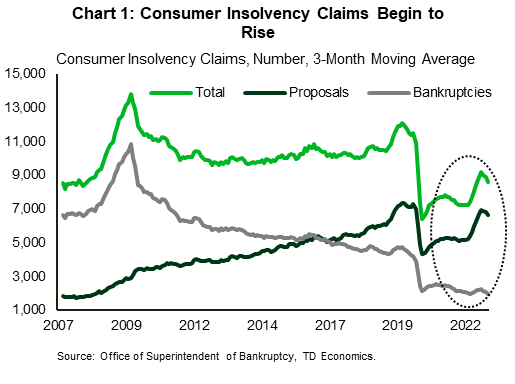
After declining during the pandemic, the number of Canadians experiencing financial troubles and filing for insolvency is on the rise once again (see Chart 1). Last year, there were 100k filings – up 11% from 2021 level. Despite the onset of the negative dynamics, it’s important to note that consumer insolvencies are rising from an unusually low level that prevailed during the pandemic and are still considerably below where they were prior to the health crisis. Out of every thousand adult Canadians, 2.9 filed for insolvency in 2021, the lowest rate since 1994. Last year, the insolvency rate edged up to 3.2 filings per thousand adults, but remained considerably below 4.6% seen in 2019. In absolute terms last year’s filings were 27% lower than the 137k claims filed in 2019.
Consumer Proposals Rise, While Bankruptcies Keep Falling
There are some diverging trends underneath the deteriorating headline number. Insolvency filings can be divided into two main categories: consumer proposals and bankruptcies. It is the former which is driving the rise in insolvencies: proposals for debt restructuring are 21% higher relative to the year-ago level (Charts 1). Meanwhile, the number of people declaring personal bankruptcy continued to fall last year. Total bankruptcy filings submitted in 2022 were down 10% compared to the same period in 2021 and were less than half of their pre-pandemic level in 2019. This is consistent with the longer-term trend of rising preference among debtors to opt in for consumer proposals rather than bankruptcy. Last year, bankruptcies accounted for just under a quarter of all insolvencies, down from 40% in 2019.
Reasons behind the rising popularity of consumer proposals over the bankruptcy filings likely stem from some key differences between these two types of insolvencies. One major difference is that when filing for a consumer proposal the debtor gets to keep all assets, whereas in the case of a bankruptcy most assets are surrendered. Additionally, the debt repayment period is longer in a case of insolvency – up to 5 years versus 9-21 months for bankruptcies – potentially leading to smaller and more manageable monthly payments. The duration of the negative impact on the debtor’s credit history may also be lower following a consumer proposal filing relative to bankruptcy.1 Last but not least, a regulatory change in 2009 which increased the maximum consumer debt limit in a consumer proposal from $75,000 to $250,000 also made it easier for borrowers with larger debts to file for a proposal thus avoiding bankruptcy.
Why Are Consumer Insolvencies Rising?
The rise in consumer insolvencies may seem at odds with the resilience seen in the labour market. The economy continued to add jobs last year, pushing the unemployment rate below pre-pandemic level, and wage growth accelerated amid labour shortages. However, as mentioned above, insolvencies are rising from unusually low levels reached during the pandemic period of generous government supports and near zero borrowing rates. As these supports were removed and consumer spending rebounded last year, bankruptcy trends have been in the process of normalizing.
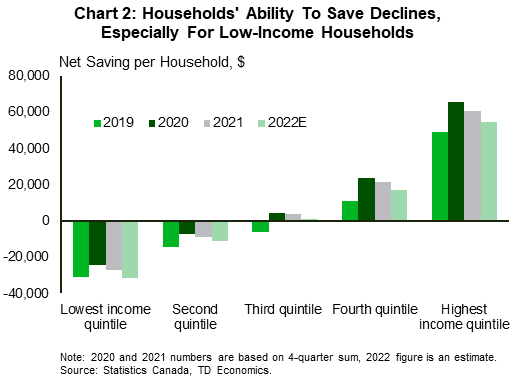
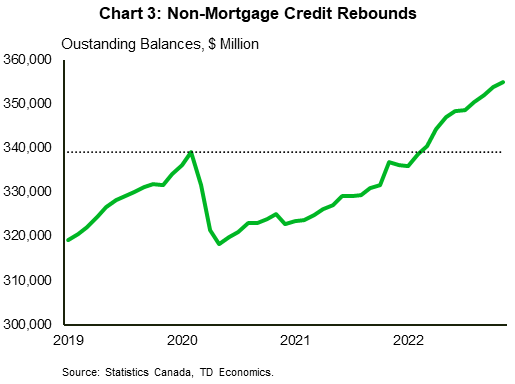
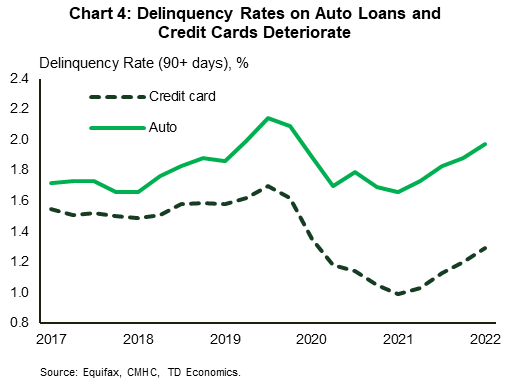
In addition, other financial headwinds have intensified. Inflation took flight squeezing household budgets and depleting savings (Chart 2). Adding to the pain, rents have also increased significantly. The vast majority of people filing for insolvency are renters, with only 16% owning a home.2 Furthermore, after plunging during the pandemic, unsecured debt levels rose rapidly last year, as consumers rushed to resume travelling, dining out and other sought-after activities (Chart 3). Credit card balances were 13% higher in November than a year ago, catching up to their pre-pandemic peak. Higher debt balances alongside rising interest rates have to led to an increase in debt servicing costs, accompanied by a deterioration in delinquency rates on credit card and auto loans (Chart 4).
Regional Trends
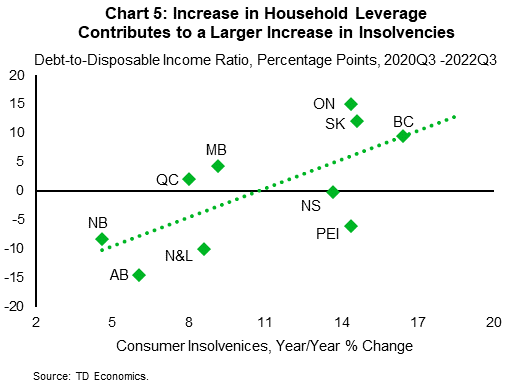
Insolvencies began trending higher coast-to-coast. In percentage terms, the largest increases were in British Columbia, Saskatchewan, Prince Edward Island, Ontario and Nova Scotia, while the remaining Atlantic and Prairie Provinces as well as Quebec saw below-national increases. Variation in year-over-year changes appears to be at least partially due to the changes in the level of household leverage across provinces (Chart 5). Provinces which saw large declines or comparatively small increases in household debt-to-income ratios over the last two years, such as Alberta, New Brunswick, Newfoundland & Labrador, Quebec and Manitoba, experienced smaller increases in insolvencies (note: debt-to-income ratio declines when income outpaces debt growth, or when debt declines).
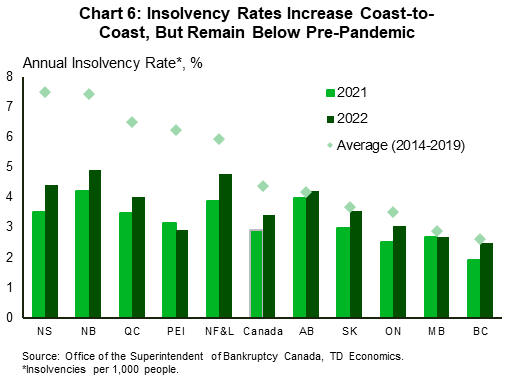
On the other hand, provinces such as Ontario, British Columbia and Saskatchewan experienced relatively large increases in debt relative to income over this period of time. They also saw some of the largest gains in insolvency claims in 2022. This is also true for PEI and Nova Scotia. However, the insolvency rate in those provinces is still considerably below the 5-year average ahead of the pandemic (Chart 6). On the other hand, Ontario, British Columbia, and Saskatchewan currently maintain only a narrow advantage relative to their respective pre-pandemic averages.
What’s Ahead For Consumer Insolvencies
Consumer insolvencies are rising from low levels, but the trend is not our friend as it still captures deteriorating financial health of Canadian households. Last year was a tough one for consumer finances, marked by surging inflation and interest rates, falling equity values and home prices, and higher consumer debt balances. Looking ahead, these financial headwinds will likely persist or even intensify in 2023 and into 2024, likely pushing consumer insolvencies above their pre-pandemic average.
Take inflation, for example: while we expect that inflationary pressures to subside this year, the cost-of-living pressures will remain acute with inflation still outpacing disposable income. Additionally, the labour market, which was a bright spot last year, will be less supportive this year. With jobs being less plentiful amid slowing economic growth, the unemployment rate is expected to increase by about 1.3 percentage point over the next year and a half, rising above of where it was just prior to the pandemic (forecast).
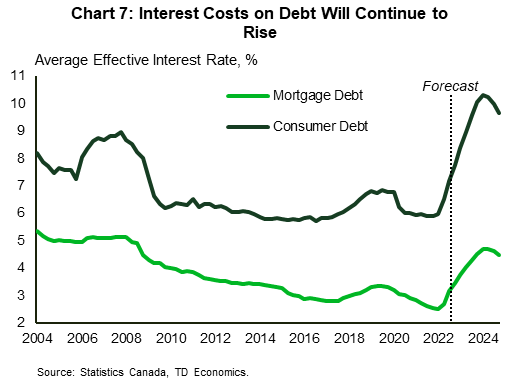
Lastly, the drag from higher interest rates on household finances via rising debt servicing costs will continue to intensify this year. While the Bank of Canada’s rate hikes have likely come to an end, interest rates (both the overnight rate and 5-year mortgage rates) are expected to remain elevated relative to the recent history (forecast). This means that the effective interest rates – average rates which households pay to service existing debt – will be higher than they have been historically (see Chart 7). As are result, the amount of income that households will need to allocate to service debt will surpass its pre-pandemic peak, reaching a new high (see report). Higher debt balances, and reduced savings and wealth cushions will further add to this pressure.
A Closer Look at Business Insolvencies
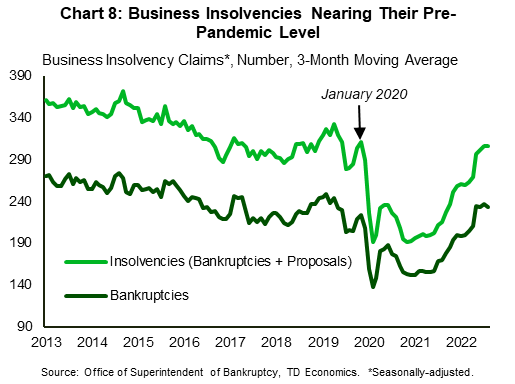
It’s not just consumer insolvencies that are on the rise, insolvency filings by businesses rose at an even faster clip last year. After increasing by nearly 40%, they are now only 10% shy of their pre-pandemic level. Unlike personal insolvencies, the rise in business insolvencies is being fueled by bankruptcies, rather than debt restructuring proposals, which represent a relatively small share of total filings (See Chart 8).
The rise in business bankruptcies isn’t surprising. Similar to personal insolvencies, it partly reflects post-pandemic normalization. In addition, businesses continued to face a myriad of challenges last year: a surge in energy costs, labour shortages, higher input prices amid rising wages and inflation, and rapidly rising borrowing costs (Chart 9).
Zooming in on industrial composition reveals that bankruptcies increased across nearly all industries (Chart 10). Mining, and oil and gas extraction and finance & insurance services were the only ones to buck the trend, faring better not only relative to the year earlier, but also relative to the pre-pandemic. In the case of mining, oil and gas industry, elevated commodity prices have likely helped to keep bankruptcies at bay, where as finance and insurance services likely benefited from the relatively low level of consumer delinquencies and the still-robust demand for credit last year.

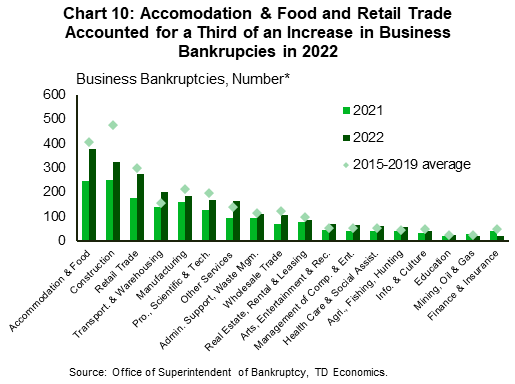
On the other hand, bankruptcies rose briskly in some of the areas that were hit hardest by the pandemic lockdowns, such as accommodation & food, retail trade, transportation, entertainment & recreation and other services (i.e., hair and esthetic services, dry-cleaning and laundry, religious services etc). Accommodation & food and retail trade alone accounted for a third of the overall increase. These industries stand out not only because bankruptcy filings there were 40-70% higher than in 2021, but also because they have either surpassed or nearing their pre-pandemic levels.
Looking ahead, some pressures, such as the elevated input prices and supply chain disruptions, will lessen this year. Filling in vacant positions may also become easier as the labour market becomes less tight. However, slowing consumer demand could weigh on profitability. Government loans, such as CEBA, issued during the pandemic are also due at the end of this year to qualify for partial loan forgiveness. About 62% of businesses participated in these programs, of these about 30% indicated that repaying pandemic loans may be a challenge, with this share rising to 54% for businesses in accommodation & food services.3 All in all, given some lingering headwinds, it appears that business insolvencies will continue trending higher this year, but likely at a slower pace relative to 2022.
Endnotes
- https://www.hoyes.com/consumer-proposals/consumer-proposal-vs-bankruptcy/
- “Office of the Superintendent of Bankruptcy. Canadian Consumer Debtor Profile – 2021.” https://ised-isde.canada.ca/site/office-superintendent-bankruptcy/en/statistics-and-research/canadian-consumer-debtor-profile-2021
- Statistics Canada. “The state of business financing and debt in Canada, fourth quarter of 2022.” https://www150.statcan.gc.ca/n1/pub/11-621-m/11-621-m2022020-eng.htm
Disclaimer
This report is provided by TD Economics. It is for informational and educational purposes only as of the date of writing, and may not be appropriate for other purposes. The views and opinions expressed may change at any time based on market or other conditions and may not come to pass. This material is not intended to be relied upon as investment advice or recommendations, does not constitute a solicitation to buy or sell securities and should not be considered specific legal, investment or tax advice. The report does not provide material information about the business and affairs of TD Bank Group and the members of TD Economics are not spokespersons for TD Bank Group with respect to its business and affairs. The information contained in this report has been drawn from sources believed to be reliable, but is not guaranteed to be accurate or complete. This report contains economic analysis and views, including about future economic and financial markets performance. These are based on certain assumptions and other factors, and are subject to inherent risks and uncertainties. The actual outcome may be materially different. The Toronto-Dominion Bank and its affiliates and related entities that comprise the TD Bank Group are not liable for any errors or omissions in the information, analysis or views contained in this report, or for any loss or damage suffered.
Download
Share: