Bottlenecked: Supply Constraints Are Likely to Slow the U.S. AI Buildout
Mauri Hall, Economist
Date Published: July 16, 2026
- Category:
- Canada
Highlights
- The planned AI buildout represents one of the largest investment cycles in recent U.S. history, but constraints in power access, equipment availability, labor supply and permitting are slowing the pace at which new data center capacity can be brought online.
- Commodity disruptions linked to the Strait of Hormuz are adding to the cost pressure through semiconductor and copper supply chains. Helium is a critical input for semiconductor fabrication, while sulfuric acid is used in copper extraction, raising input costs for AI infrastructure.
- Our forecast already takes a cautious view of AI-related investment, but even that outlook could prove optimistic if these constraints intensify.
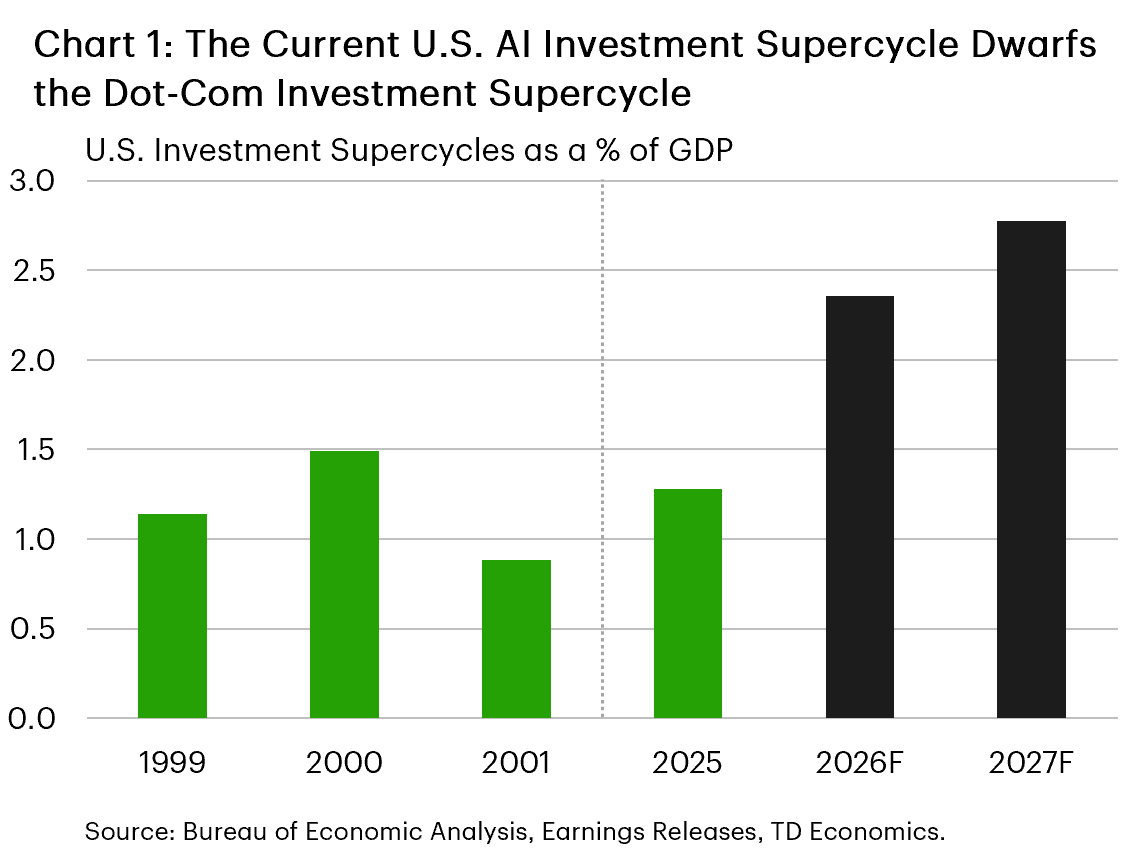
Investment in artificial intelligence (AI) has become one of the most important drivers of the near-term U.S. economic outlook. Hyperscalers—the firms leading the AI buildout—have committed to spending over $750 billion in 2026 and $900 billion in 2027 to expand computing capacity, eclipsing even the dot-com cycle in GDP-percentage terms (Chart 1).
The economic impact of this spending will depend not only on how much is invested, but on how quickly the inputs needed to build and operate data centers can be secured. Data centers require large amounts of electricity, specialized equipment, advanced semiconductors, skilled labor, and regulatory approval. Constraints in any one of these inputs can delay deployment even when financing is readily available.
Several of these constraints are already binding. Limited grid access, long equipment lead times, labor shortages and permitting challenges are slowing the pace at which planned capacity is brought online. Disruptions in the Middle East affecting semiconductor and copper supply chains are adding further cost pressure.
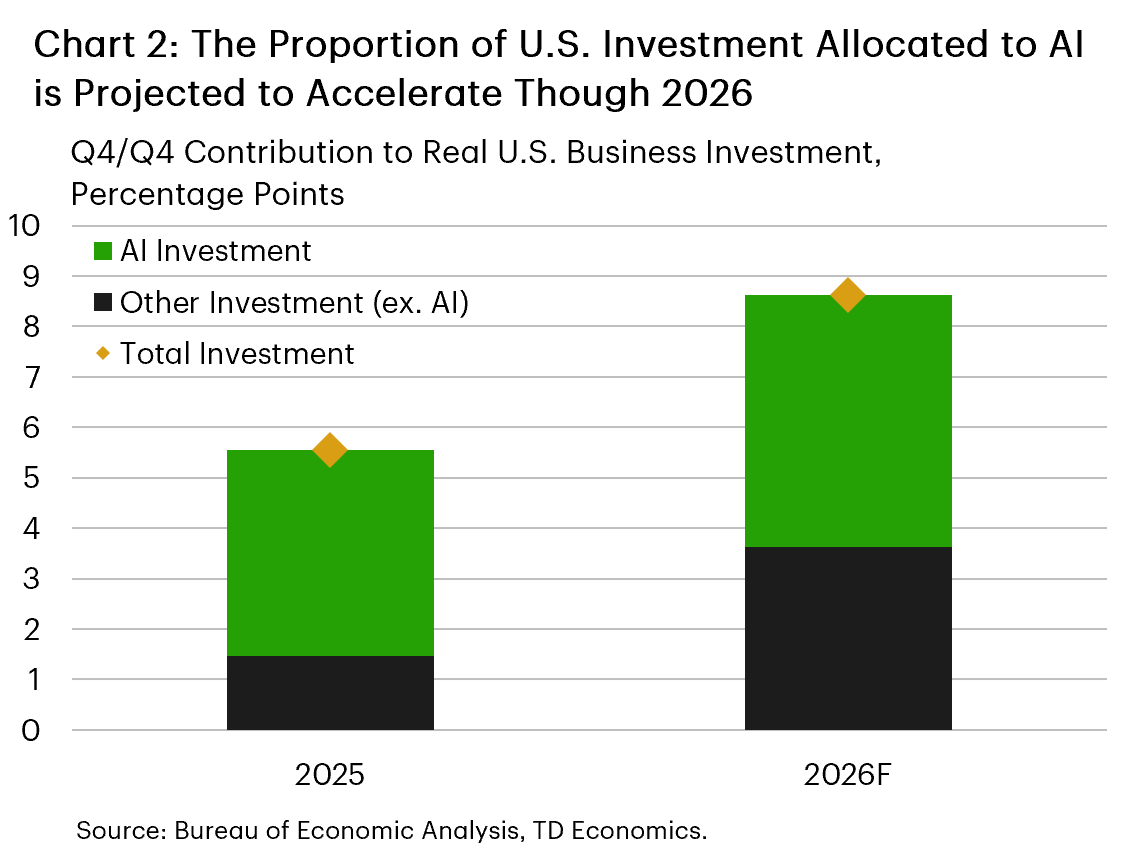
Together, these factors suggest that the physical buildout of AI infrastructure is likely to proceed more slowly and at higher cost than implied by a naïve extrapolation of announced investment plans. While still too large to ignore (Chart 2), our forecast takes a cautious view of AI-related investment, incorporating only 60%-70% of announced spending into our outlook for business investment, once accounting for shortages, delays and higher input costs. Even that outlook could prove optimistic if constraints intensify.
Electricity Access Can Take Up to Seven Years
The most important bottleneck for the AI buildout is difficulty connecting data centers to energy infrastructure. Despite the surge in planned investment, only five of the sixteen gigawatts (GW) of data center electricity capacity announced for 2026 delivery is currently under construction.1 A quarter of the 140 projects scheduled for completion by the end of 2026 have not disclosed a power access strategy.2
Grid connection wait times in major U.S. markets range from three to four years and can run even longer in saturated geographic areas. The connection wait time in Northern Virginia, for example, is currently seven years.3 This suggests that construction completion and operational readiness may increasingly diverge. Facilities may be physically completed before sufficient electricity is available for full operation, delaying the conversion of investment spending into usable capacity.
Some firms have sought to sidestep the lengthy wait times for grid connection by investing in on-site power generation powered by natural gas turbines. However, global turbine orders reached 110 GW by the end of 2025, while manufacturing capacity tops out at 60-70 GW, constraining this strategy.4 As our recent report noted, one of the three dominant manufacturers of gas turbines—GE Vernova—is sold out through 2028. As a result, on-site generation is unlikely to fully offset broader grid-access constraints.
Another bottleneck lies in the equipment required to expand grid infrastructure. According to Wood Mackenzie, price levels for power transformers have increased by 77% relative to their pre-pandemic baseline.5 Imports of high-voltage transformers have increased sharply in recent years as domestic U.S. production has been unable to keep pace with demand.6 This is a crucial chokepoint as lead time ranges between two and five years. Even where generation capacity exists, long transformer lead times can delay the delivery of electricity to new facilities. This reinforces broader power-related bottlenecks and extends the timeline for capacity expansion.
Skilled Workers Are in Short Supply
Even where components are available, they must be installed by specialized workers, which are increasingly in short supply. Electricians serve as a canonical example since electrical systems account for between 45% and 70% of total data center construction costs.7 Expanding the supply of electricians requires four to five years of apprenticeship and training, limiting how quickly the workforce can respond to rising demand. The constraint is compounded by retirements, with roughly 30% of current union electricians at or near retirement age.8
Demand and supply for other skilled trades has similar characteristics. Demand for HVAC engineers, for example, has risen sharply since 2022, outpacing supply.9 For skilled trades workers as a whole, the time-to-hire is now longer than for office-based professionals.10 Many data centers are also being built in lower-cost power markets where local pools of skilled labor are limited. Firms have responded by offering wage premiums of 20%-30%. The result is a labor constraint that raises costs and extends construction timelines.
Local Opposition and Permitting Challenges Are Becoming More Significant
Local approval is becoming another constraint on the AI buildout, even for projects with access to power and labor. This is particularly true in high-density markets. In the first quarter of 2026, at least 75 projects representing $130 billion USD in potential investment were delayed or blocked due to local political resistance, matching the scale of all of 2025 in just three months.11
Resistance is driven, in part, by concerns about electricity prices and infrastructure burdens.12 The opposition has become increasingly organized and is shaping regulatory and legislative environments in some markets, including through the rollback of tax incentives that had supported project economics.
Project tracking data shows that permitting plays a significant role in delaying construction. According to January 2026 data from PJM Interconnection, permitting accounted for 29% of milestone change requests for projects under construction, making permitting one of the leading causes of project delays. Moreover, projects in PJM’s queue took, on average, more than three years to reach interconnection service agreements.13, 14
Taken together, the evidence points to a slower, more expensive AI buildout than announced investment plans imply, making the most optimistic growth forecasts harder to justify and supporting our more cautious outlook.
Canada’s Helium Opportunity
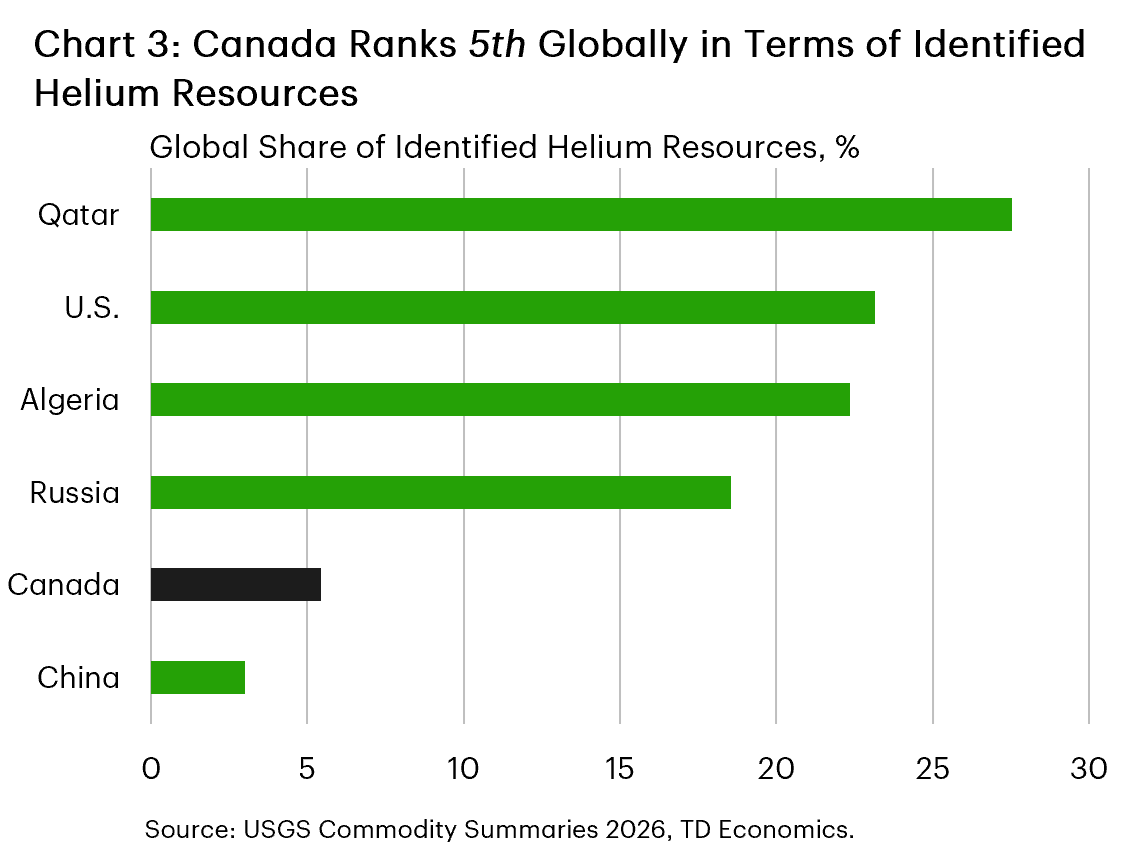
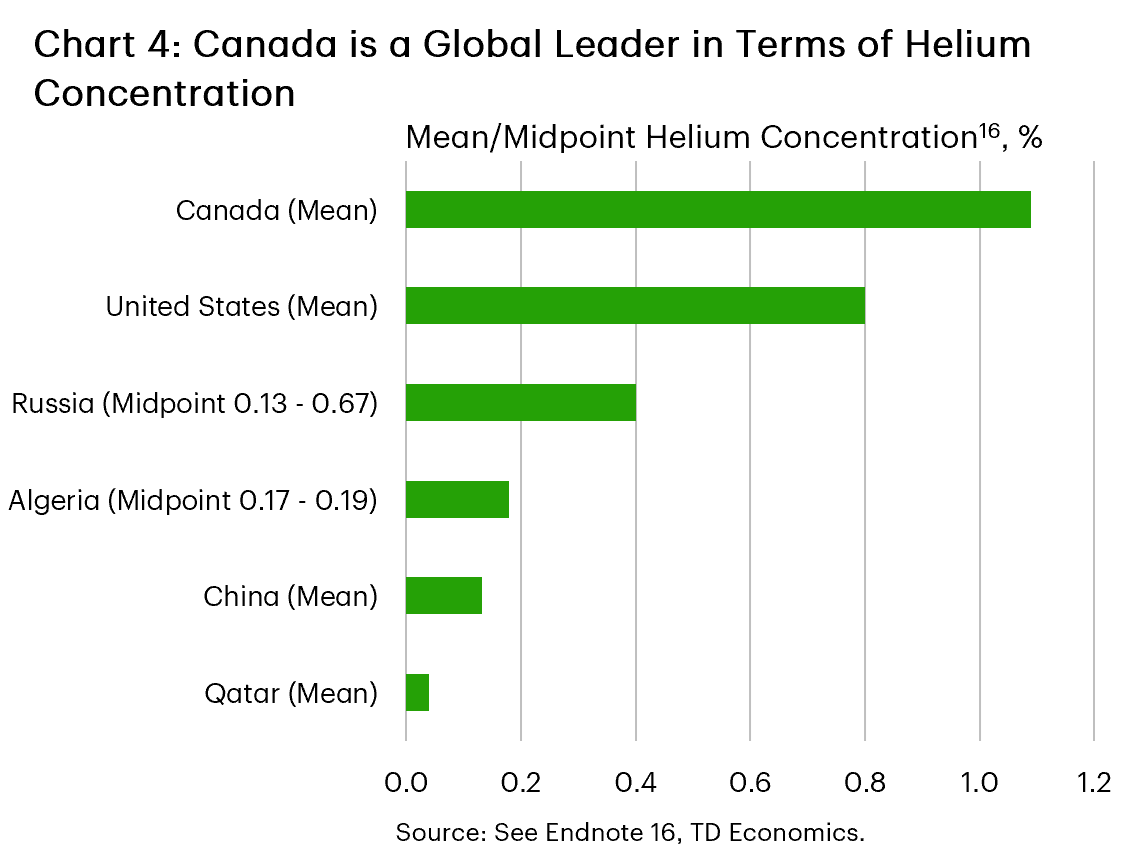
Higher helium prices may also create opportunities for regions with large undeveloped reserves. Canada holds the world’s fifth-largest primary helium reserve potential, primarily located in Alberta and Saskatchewan (Chart 3).15 Helium from these provinces’ is highly concentrated with an average of 1% concentration versus the global average of just 0.1% (Chart 4).16
High concentration implies cost savings. What is more, the deposits are co-located with nitrogen rather than methane, resulting in lower associated emissions during production than competing sources. This insulates the Canadian Helium industry from fossil fuel price volatility. Given Saskatchewan’s objective of expanding Helium exports to supply 10% of the world’s usable Helium by 2030, the next three to five years represent an opportunity for helium producers to increase their footprint in the global market.17
In addition to these domestic constraints, global supply shocks such as the recent Strait of Hormuz commodity flow disruption are driving up costs for essential inputs.
Strait of Hormuz Disruptions Further Raise Costs
Strait of Hormuz-related disruptions have increased cost pressures through two distinct channels. The first operates through semiconductor supply chains, where helium shortages have raised fabrication costs. The second operates through copper supply chains, where sulfuric acid shortages have increased pressure on copper production and pricing. Both channels add cost pressure to the AI buildout.
Helium is a critical input in semiconductor fabrication and has few practical substitutes. As a result, disruptions to supply can raise production costs and constrain chip availability. The damage to Qatar’s Ras Laffan Industrial City reduced global helium supply by approximately one third, and helium spot prices rose materially in the weeks that followed. Available supply has also been rerouted through longer shipping routes, increasing transit times, increasing shipping cost and reducing delivered volumes as liquid helium evaporates in transit. Together, these factors have increased the cost of semiconductor production, raising the cost of servers and other equipment used in AI infrastructure.
Sulfuric acid is another key commodity affected by the Strait’s disruption (Chart 5). Sulfuric acid is required to extract copper, so tighter acid supply is likely to keep copper prices elevated. Copper prices had already risen sharply before the Iran-U.S. conflict (Chart 6).
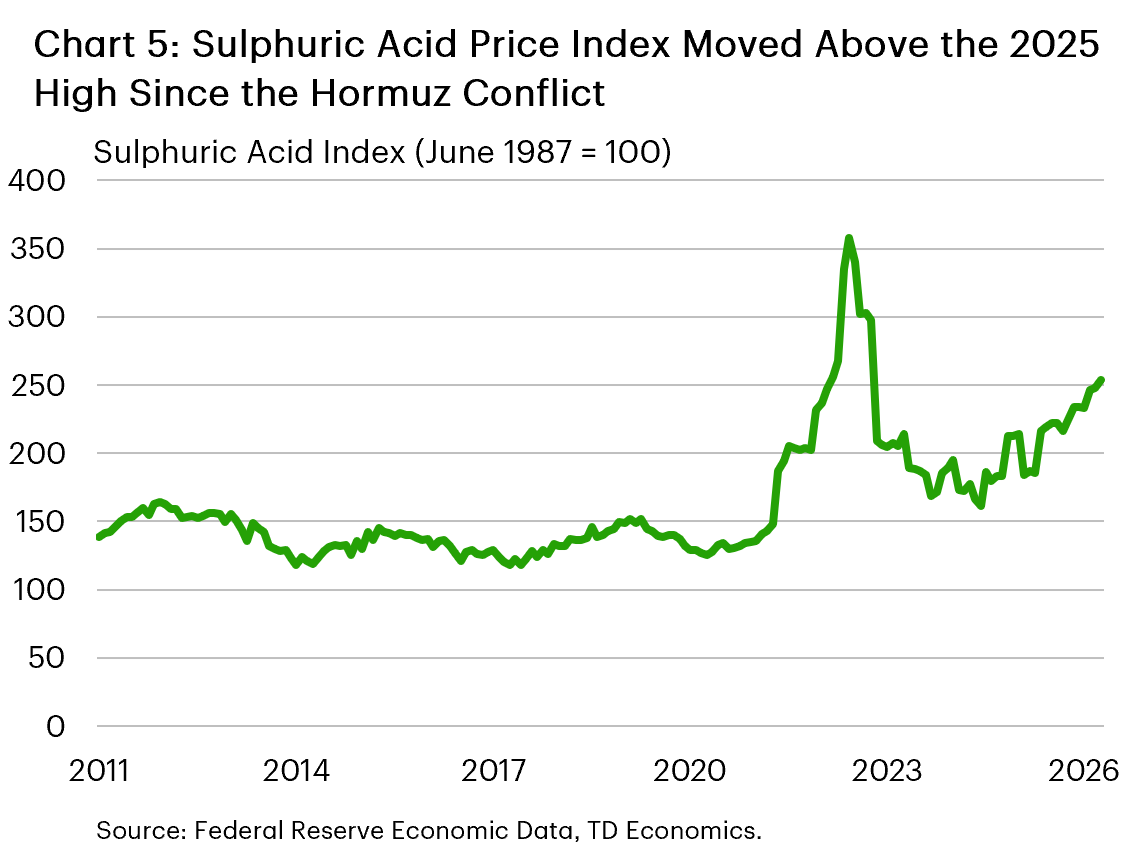
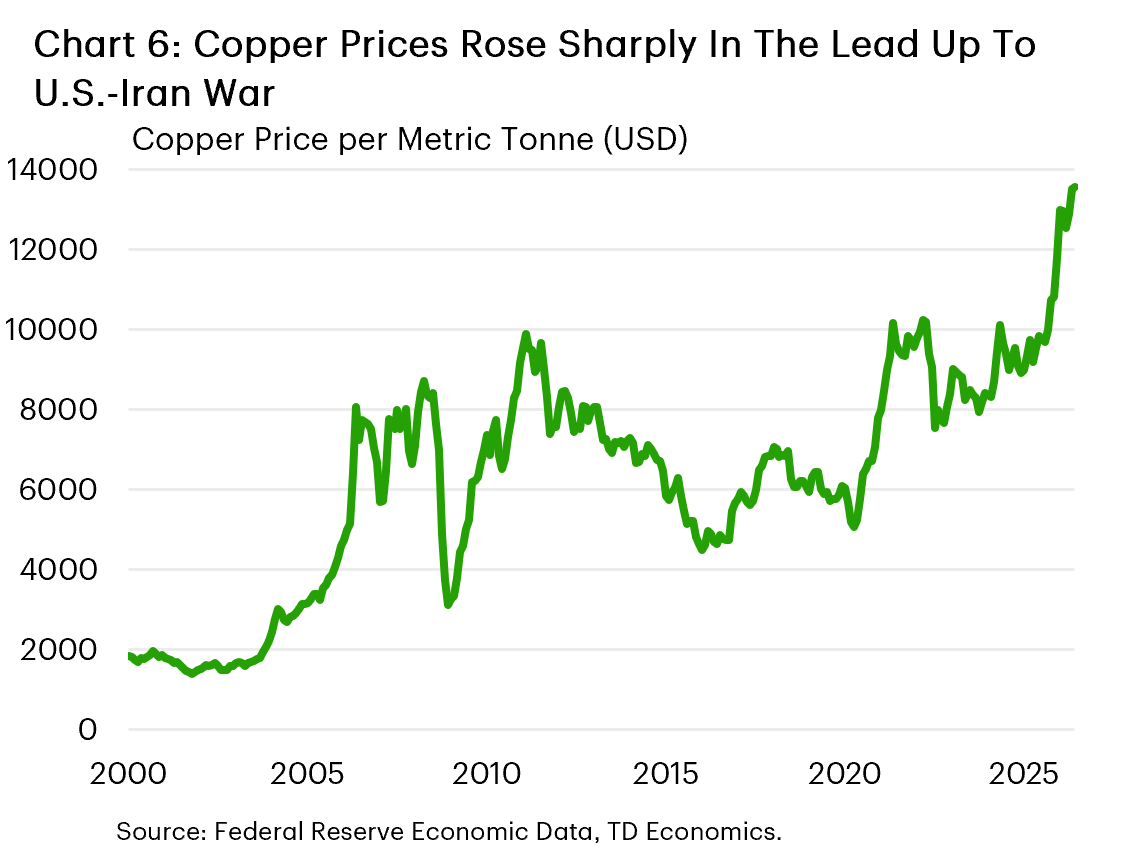
China’s decision to restrict domestic sulfuric acid exports has further tightened supply, with estimates suggesting that roughly 200,000 tons of Chilean copper production are at risk. Because large-scale data centers require substantial quantities of copper for wiring, distribution systems and supporting electrical infrastructure, sustained copper-price increases will directly raise construction costs.18
Bottom Line
AI investment is shaping up to be one of the largest private capital spending cycles in modern U.S. economic history. That scale should provide meaningful support to U.S. business investment, even under conservative assumptions. Still, turning planned spending into completed projects requires access to electricity, specialized equipment, skilled labor and regulatory approvals that are becoming harder to secure.
Evidence from power markets, equipment supply chains, labor markets and permitting data points to a slower, more expensive AI buildout than announced plans imply. Commodity disruptions affecting semiconductor and copper supply chains only add another layer of cost pressure.
Our baseline forecast reflects both sides of this story. We incorporate 60% to 70% of announced AI-related spending into our outlook for real U.S. business investment over the next two years to account for shortages, delays and higher input costs. That still leaves AI as an important source of growth, but with benefits that are likely to arrive more gradually than the scale of planned spending alone would suggest. If bottlenecks intensify, even this more cautious outlook could prove optimistic.
End Notes
- Wang, O. (2026, February 24). Data center outlook. Sightline Climate. https://www.sightlineclimate.com/research/data-center-outlook
- Boudreau, C. (2026, February 24). Up to half of the world’s data centers may be delayed this year. Latitude Media. https://www.latitudemedia.com/news/up-to-half-of-the-worlds-data-centers-may-be-delayed-this-year/
- Saul, J. (2024, August 29). Data centers face seven-year wait for Dominion power hookups. Bloomberg. https://www.bloomberg.com/news/articles/2024-08-29/data-centers-face-seven-year-wait-for-power-hookups-in-virginia
- Wood Mackenzie, (April 1, 2026). Gas turbine prices soar 195% as market faces supply-demand crisis”. Press release, April 1, 2026 https://www.woodmac.com/press-releases/gas-turbine-prices-soar-195-as-market-faces-supply-demand-crisis/
- Wood Mackenzie (2025, August 13) Transformer troubles: manufacturing and policy constrains hit US transformer supply. https://www.woodmac.com/news/opinion/transformer-troubles-manufacturing-and-policy-constraints-hit-us-transformer-supply/
- Bazilian, M., & Baker, K. (2025, December 5). Supply-chain delays, rising equipment prices threaten power grid. The Invading Sea.https://www.theinvadingsea.com/2025/12/05/power-grid-electricity-supply-chain-data-centers-transformers-circuit-breakers-utilities/
- Greenberg, Ezra, Erik Schaefer, and Brooke Weddle. 2024. “Tradespeople Wanted: The Need for Critical Trade Skills in the US.” McKinsey & Company, April 9, 2024 https://www.mckinsey.com/capabilities/people-and-organizational-performance/our-insights/tradespeople-wanted-the-need-for-critical-trade-skills-in-the-us
- International Brotherhood of Electrical Workers. (2025, May 1). The data center surge: A new generation of IBEW jobs. https://ibew.org/electrical_worker/the-data-center-surge-a-new-generation-of-ibew-jobs/
- Bhaimiya, S., & Roach, A. (2026, March 18). How the red-hot AI data center boom is igniting demand for a new, lucrative career path: Trade workers. CNBC. https://www.cnbc.com/2026/03/18/ai-data-center-buildout-jobs-salary-skilled-traders-worker-shortage.html
- Randstad USA. (2026, March 26). U.S. demand for skilled trades grows 3x faster than professional roles. https://www.randstadusa.com/about/press-room/press-releases/us-demand-skilled-trades-grows-3x-faster-professional-roles/
- Lane, Charles, and Joseph W. Kane. 2026. “Confronting and Addressing Rising Energy Bills Linked to Data Centers.” Brookings Institution, March 13, 2026. https://www.brookings.edu/articles/confronting-and-addressing-rising-energy-bills-linked-to-data-centers/
- Lane, Charles, and Joseph W. Kane. 2026. “Confronting and Addressing Rising Energy Bills Linked to Data Centers.” Brookings Institution, March 13, 2026. https://www.brookings.edu/articles/confronting-and-addressing-rising-energy-bills-linked-to-data-centers/
- PJM Interconnection. (2026, January 26). Construction metrics. Presented by Nora Embert, Interconnection Construction Management, at the Interconnection Process Subcommittee. https://www.pjm.com/-/media/DotCom/committees-groups/subcommittees/ips/2026/20260126/20260126-item-04---construction-metrics.pdf
- Snider, S. (2026, May 12). Why AI data center projects face years of delays after approval. Data Center Knowledge. https://www.datacenterknowledge.com/energy-power-supply/why-ai-data-center-projects-face-years-of-delays-after-approval
- U.S. Geological Survey. (2026). Mineral commodity summaries 2026 (Helium chapter). https://doi.org/10.3133/mcs2026
- Canada — mean of 2,292 producing wells. TD Economics calculations based on Alberta Energy Regulator well data (AER, 2023); range confirmed by Canada Energy Regulator (2022). United States — Hugoton-Panhandle average ~0.586%; estimated national field average ~0.80%. Source: Frontiers in Environmental Science (2022). Russia — Eastern Siberian fields (Kovykta, Chayanda) 0.13–0.67%; midpoint 0.40%. Source: Preprints.org, global helium industry chain analysis (2024). Algeria — Hassi R’Mel field, 0.17–0.19%; midpoint 0.18%. Source: ScienceDirect, review of global helium resources (2025). China — Dongsheng Gas Field, Ordos Basin, mean 0.133%; best current domestic prospect, not a national average. Source: Springer Nature Earth Sciences (2022). Qatar — North Field ~0.04%; sub-economic in isolation, extracted as LNG byproduct. Source: Kim & Gundersen (2015), Chemical Engineering Transactions, vol. 45 (reflects the LNG feed gas concentration at Ras Laffan)
- Government of Saskatchewan. (2021, November). Helium action plan: From exploration to exports. https://www.saskatchewan.ca/business/agriculture-natural-resources-and-industry/helium/helium-action-plan
- Reuters. (2026, April 21). Goldman Sachs maintains 2026 copper price surplus forecasts. Kitco News. https://www.kitco.com/news/off-the-wire/2026-04-21/goldman-sachs-maintains-2026-copper-price-surplus-forecasts
Disclaimer
This report is provided by TD Economics. It is for informational and educational purposes only as of the date of writing, and may not be appropriate for other purposes. The views and opinions expressed may change at any time based on market or other conditions and may not come to pass. This material is not intended to be relied upon as investment advice or recommendations, does not constitute a solicitation to buy or sell securities and should not be considered specific legal, investment or tax advice. The report does not provide material information about the business and affairs of TD Bank Group and the members of TD Economics are not spokespersons for TD Bank Group with respect to its business and affairs. The information contained in this report has been drawn from sources believed to be reliable, but is not guaranteed to be accurate or complete. This report contains economic analysis and views, including about future economic and financial markets performance. These are based on certain assumptions and other factors, and are subject to inherent risks and uncertainties. The actual outcome may be materially different. The Toronto-Dominion Bank and its affiliates and related entities that comprise the TD Bank Group are not liable for any errors or omissions in the information, analysis or views contained in this report, or for any loss or damage suffered.
Download
Share: