Women and STEM
Bridging the Divide
Beata Caranci, SVP & Chief Economist | 416-982-8067
Katherine Judge, Economic Analyst | 416-307-9484
Oriana Kobelak, Coordinator | 416-982-8061
Date Published: September 12, 2017
- Category:
- Canada
- Labour
- Diversity & Social Studies
Highlights
- The labour market is increasingly demanding higher skill levels in science, technology, engineering and math (STEM). And, the market is paying women above-average wages in these fields. It will be difficult to narrow the overall gender wage gap if women fail to make stronger inroads into STEM fields.
- Aptitude differentials in math among girls and boys as the source of women underrepresentation in STEM has been debunked many times over. The causes are numerous and complex, but include marginalization within educational and corporate institutions.
- Within the workplace, employers need to revisit whether ongoing marginalization is present. Women who acquire a degree in STEM are disproportionately slotted into lower paying technical roles.

Last year, the Bank of Canada shortlisted Elizabeth (Elsie) MacGill as a candidate to be featured on the $10 Canadian bank note. This name likely lacks familiarity among many girls in school today, despite her unparalleled academic and professional career. In many respects, Elsie’s story inspired us to take a deeper dive into the progress of women in the science, technology, engineering and math (STEM) fields.
As an accomplished engineer in the 1930s, Elsie stood out from her peers, not just by gender, but also by leading the innovation and construction of one of the most successful fighter planes in WWII. Elizabeth rejected the label of “woman engineer”, insisting that gender had no implication on her ability to succeed or perform her job. However, this comment can be turned on its head. Her abilities as an engineer and dedication to the field must have been exceptional relative to male peers. Elsie would have faced a mountain of labour market barriers within the engineering field during the early 1900s. Even equal access to education could not be taken for granted. After just one term in an applied postsecondary science program, she was asked to leave for no other reason than her gender. Undeterred, Elsie relocated to pursue her field of choice.
Elizabeth MacGill’s story is as inspirational today, as it is applicable. This report seeks to measure and understand how far women have progressed within the STEM field following her pioneering efforts to promote female participation and eliminate gender biases within hiring practices.
There’s no question that progress has occurred, but at a painfully slow pace. Women have accounted for 30% of employment growth in STEM since 2010, but still make up less than one-quarter of employment in these occupations. The persistence of low female representation will bear a larger and larger economic cost with time. The global economy is increasingly demanding STEM-related knowledge and is paying higher incomes relative to other occupations. It will be difficult to close, or possibly even further narrow, the overall gender wage gap if women fail to make stronger inroads. This outcome could also become reinforced if women are overlooked for the leadership roles of the future, since STEM-knowledge is demanded by a broadening swath of industries.
Some unfavourable trends are evident within the engineering and computer science fields, which account for over three-quarters of STEM employment. Women who acquire a bachelor’s degree in STEM are disproportionately slotted into lower paying technical roles within companies, as opposed to professional roles. This further exacerbates gender wage disparity within STEM and comes at the economic cost of under-utilizing the skills of the workforce and not maintaining the engagement of women within the field. Aging demographics and weak productivity already present a challenge for Canada. The government has responded positively with immigration policies to attract and facilitate the entry of much needed skills. However, more needs to be done to unearth and address systemic biases within educational and corporate structures in order to fully leverage the skills sitting in our own backyard. Lastly, we hope that young girls and women become as inspired as we were by Elsie MacGill’s life experience to persist with career aspirations and agitate for change when institutional biases are encountered.
The Economic Case for STEM
STEM has become a key focus for development by governments and educators in recent years. There’s always a risk that policies are dovetailed to economic trends that make a hot list, but become less relevant with the passage of time. STEM is not one of those fields. It occupies more than buzzword-status.

Out of thirty-seven occupational groups, STEM jobs have experienced the eighth most pronounced expansion in their share of total employment since 1997, currently accounting for 9% of full- and part-time jobs combined. And, among the seven other occupational groups, only two of them offer higher wages for women. The proliferation of high value-added STEM jobs is not a passing fad. Employment in these occupations grew by an outsized 22% during the post-financial crisis period (2009-2016), compared to 8% among non-STEM occupations. Computer science and engineering occupations experienced the most pronounced job gains and represent the bulk of the STEM field (Chart 2). These two fields are the main focus of this report.
To further drive the point home, these figures actually underrepresent the true size of STEM employment opportunities. Due to rapidly evolving technology, an increasing number of industries rely on workers with STEM knowledge, beyond the Microsofts and Amazons of the world. A Brookings Institute study looked at the “hidden economy” of jobs that require some application of a high proficiency of STEM knowledge.1 Within the United States, it was estimated that the true size of STEM was roughly 20% of the entire labour market. This compares to 13% when only direct STEM-related industries are considered. These involve the invention and development of new ideas, in contrast to the implementation and maintenance of the related technologies that more closely characterize indirect STEM jobs. The broader reach of these roles reflects particularly high concentrations within utilities, healthcare, construction, mining and manufacturing. Adapting Milton Friedman’s apt description of inflation, STEM jobs are always and everywhere an economic phenomenon. And, perhaps contrary to common perceptions, large contingents of those occupations do not require a four-year university degree2.

As a generalization, STEM roles can be broken into two categories: technical and professional. Progression from the former to the latter occupation usually requires additional education, often embodied by a university degree3 (See Table 1, page 11). In Canada, roughly 557,000 STEM jobs fall into the technical category, comprising 45% of the STEM job market. Not only are the opportunities vast, but the level of wages in both technical and professional STEM jobs are higher than the majority of other occupations, creating a win-win combination (Chart 3).
Diving more deeply into the STEM field’s economic importance, a separate Brooking’s report looked at 50 advanced industries within the United States4. An “advanced industry” was generally defined as being among the 80th percentile of industries for R&D spending per worker, and also having an above-average share of workers whose occupations required a high degree of STEM knowledge. Advanced industries have experienced 2.7% annual productivity growth since 1980 in comparison to 1.4% for non-advanced industries.5 The study found that these industries employed 80% of the nation’s engineers, performed 90% of private-sector R&D and produced 17% of U.S. GDP, which was more than any other industry. Naturally, these advanced industries are not exclusive to the United States. Within Canada, they are embedded within every corner of the economy, from manufacturing to wholesale trade, making up roughly 13% of the job market.
The importance of STEM has captured the attention of Canadian policymakers. The federal government recently made adjustments to the Labour Market Impact Assessment (LMIA) to facilitate and accelerate the entry of highly-skilled international talent to fill temporary labour and skill shortages. This is consistent with recommendations from the Advisory Council on Economic Growth. Through discussions with business leaders, the Council identified labour shortages within categories of senior talent and mid-level roles. Specifically, technology companies identified immediate talent shortages in areas of machine learning, data science, product management, user experience design, sales and digital marketing. Within infrastructure development and manufacturing, demand for expert talent was cited in software engineering and instrumentation technology workers.
Potential labour shortages were further identified by Statistics Canada projections out to 2024. Among 292 occupations, a mere 30 are projected to experience labour shortages. Two-thirds of these occupations fall into the two broad categories of healthcare and STEM fields. The latter is estimated to experience the second-most pronounced excess demand for workers. Ranging from aerospace and software engineers to mathematicians, Canada’s economy is poised to become increasingly STEM-oriented, presenting ample opportunities for women to gain ground in these fields.
The wage premium phenomenon
Little wonder that high employer demand and skill level has created a wage-premium within STEM occupations. The magnitude of that premium varies depending on the industry and occupation, but there is consistent outperformance across the field relative to the non-STEM aggregate.
This is where it gets interesting for women and the outlook for the gender wage gap. We have done extensive research on gender differences in the labour market over the past decade, and there is no silver bullet on either the source or solution to the gender wage gap. But, one piece of the puzzle does relate to the concept of “occupational sorting”. This term refers to differences in earnings due to a woman’s chosen field of study and, by extension, occupation.

Women working full-time in the STEM field generally earn 30% more than women working in occupations where they make up the majority of the employees (Chart 4). University education narrows the gap to 12%, but obviously does not eliminate it (Chart 5). Unfortunately, women represent just 23% of all full-time STEM positions, and this figure remains depressed when considering only those with university level education (25%). Among part-time STEM roles, university-educated women account for a larger 41% of employment, but part-time roles pay a lower hourly wage than full-time positions.
Now, throw into the mix the differential in male full-time wages and their much higher representation in the field, and we have a potent combination for a persistent overall gender wage gap. Holding all else equal, if women had the same representation in full-time STEM jobs as they do in say, middle management occupations (roughly 40%), the gap in average hourly earnings between men and women would narrow by 16% on this influence alone.
Given that STEM jobs tend to pay more than other sectors, the low representation of women automatically places their lifetime earnings at a disadvantage to that of men through the phenomenon of occupational sorting. And, given that STEM roles are uniquely identified to be in short supply in the future, the wage-wedge may either never close, or potentially widen. As a simple illustration, let’s assume the current rising share of full-time STEM jobs in the economy continues in a linear fashion, rising to a share of 12% by 2030 (from 9% currently).  Let’s also assume the male-female ratio maintains itself at current levels, including the full-time and part-time split. This would lead the gender wage gap to widen by 11% over this period. However, this influence is also driven by the fact that men consistently earn a higher average hourly wage rate than women at every educational level within the field.
Higher representation of women in STEM would mitigate the risk of deepening the gender wage divide, but not eliminate the outcome. The above example touches on the wage trajectory based solely on occupational choice, but the analysis does not reflect an apples-to-apples comparison that controls for differing levels of experience, age, and other factors. Data limitations prevented us from undertaking this analysis for STEM in Canada, but in an earlier study, we demonstrated that the gender wage gap across the entire labour market was estimated to be between 5-15% on an apples-to-apples basis. A U.S. study that narrowed the focus and performed the like-for-like analysis specifically for STEM occupations found that 75% of the technology occupations they examined had gender pay gaps above the U.S. national average, estimated to be 5.4%6. In other words, even though women earn higher wages within STEM occupations relative to most other jobs, they still earn less than men after controlling for education, experience, geographic location and other factors. However, a critical step towards improvement is to have greater labour force participation within STEM as a pillar to develop critical mass. In turn, this helps improve wage transparency to mitigate gender discrepancies, increase the support network to push against embedded biases and increase the presence of women within leadership roles.
Education pipeline: a missing link


Unfortunately, the job landscape is driven by a weak pipeline at the education level within STEM. It is fairly common knowledge that women make up the majority of university graduates, except for the wide gender chasm that exists among STEM graduates (Chart 6). Despite the pioneering efforts of Elsie MacGill, the representation of women in engineering classrooms carries the distinction of being the most stagnant. There are nearly four men for every woman graduating with a bachelor’s degree in engineering7. That figure has barely budged in more than a decade.
Stronger growth in female engineer graduates has become apparent in recent years, but this has happened before in history, and momentum needs to be sustained to make permanent headway. Engineering is the worst of the lot for STEM gender disparity, but computer science and math degrees carry their own unfortunate distinction (Chart 7). At three men for every woman graduate, the ratio has worsened from two decades ago. Growth in female graduation finally made a strong push in the past five years, but it is insufficient to move the dial on representation due to strength coming from male graduation rates.
“Hidden” Occupational Sorting

There is a silver lining, however. Universally, the male-female graduation gap narrows at the next level of education. Women who graduate with a computer science or engineering bachelor’s (BSc) degree are more likely than men to push forward to attain a graduate degree (MSc or Ph.D) (Chart 8). However, this silver lining is tainted if women perceive this to be a necessary step in order to mitigate the occurrence of occupational sorting within a job field. In this case, occupational sorting does not refer to jobs obtained due to the field of study, but rather due to the job opportunities that are on offer to them by employers within a specific field.

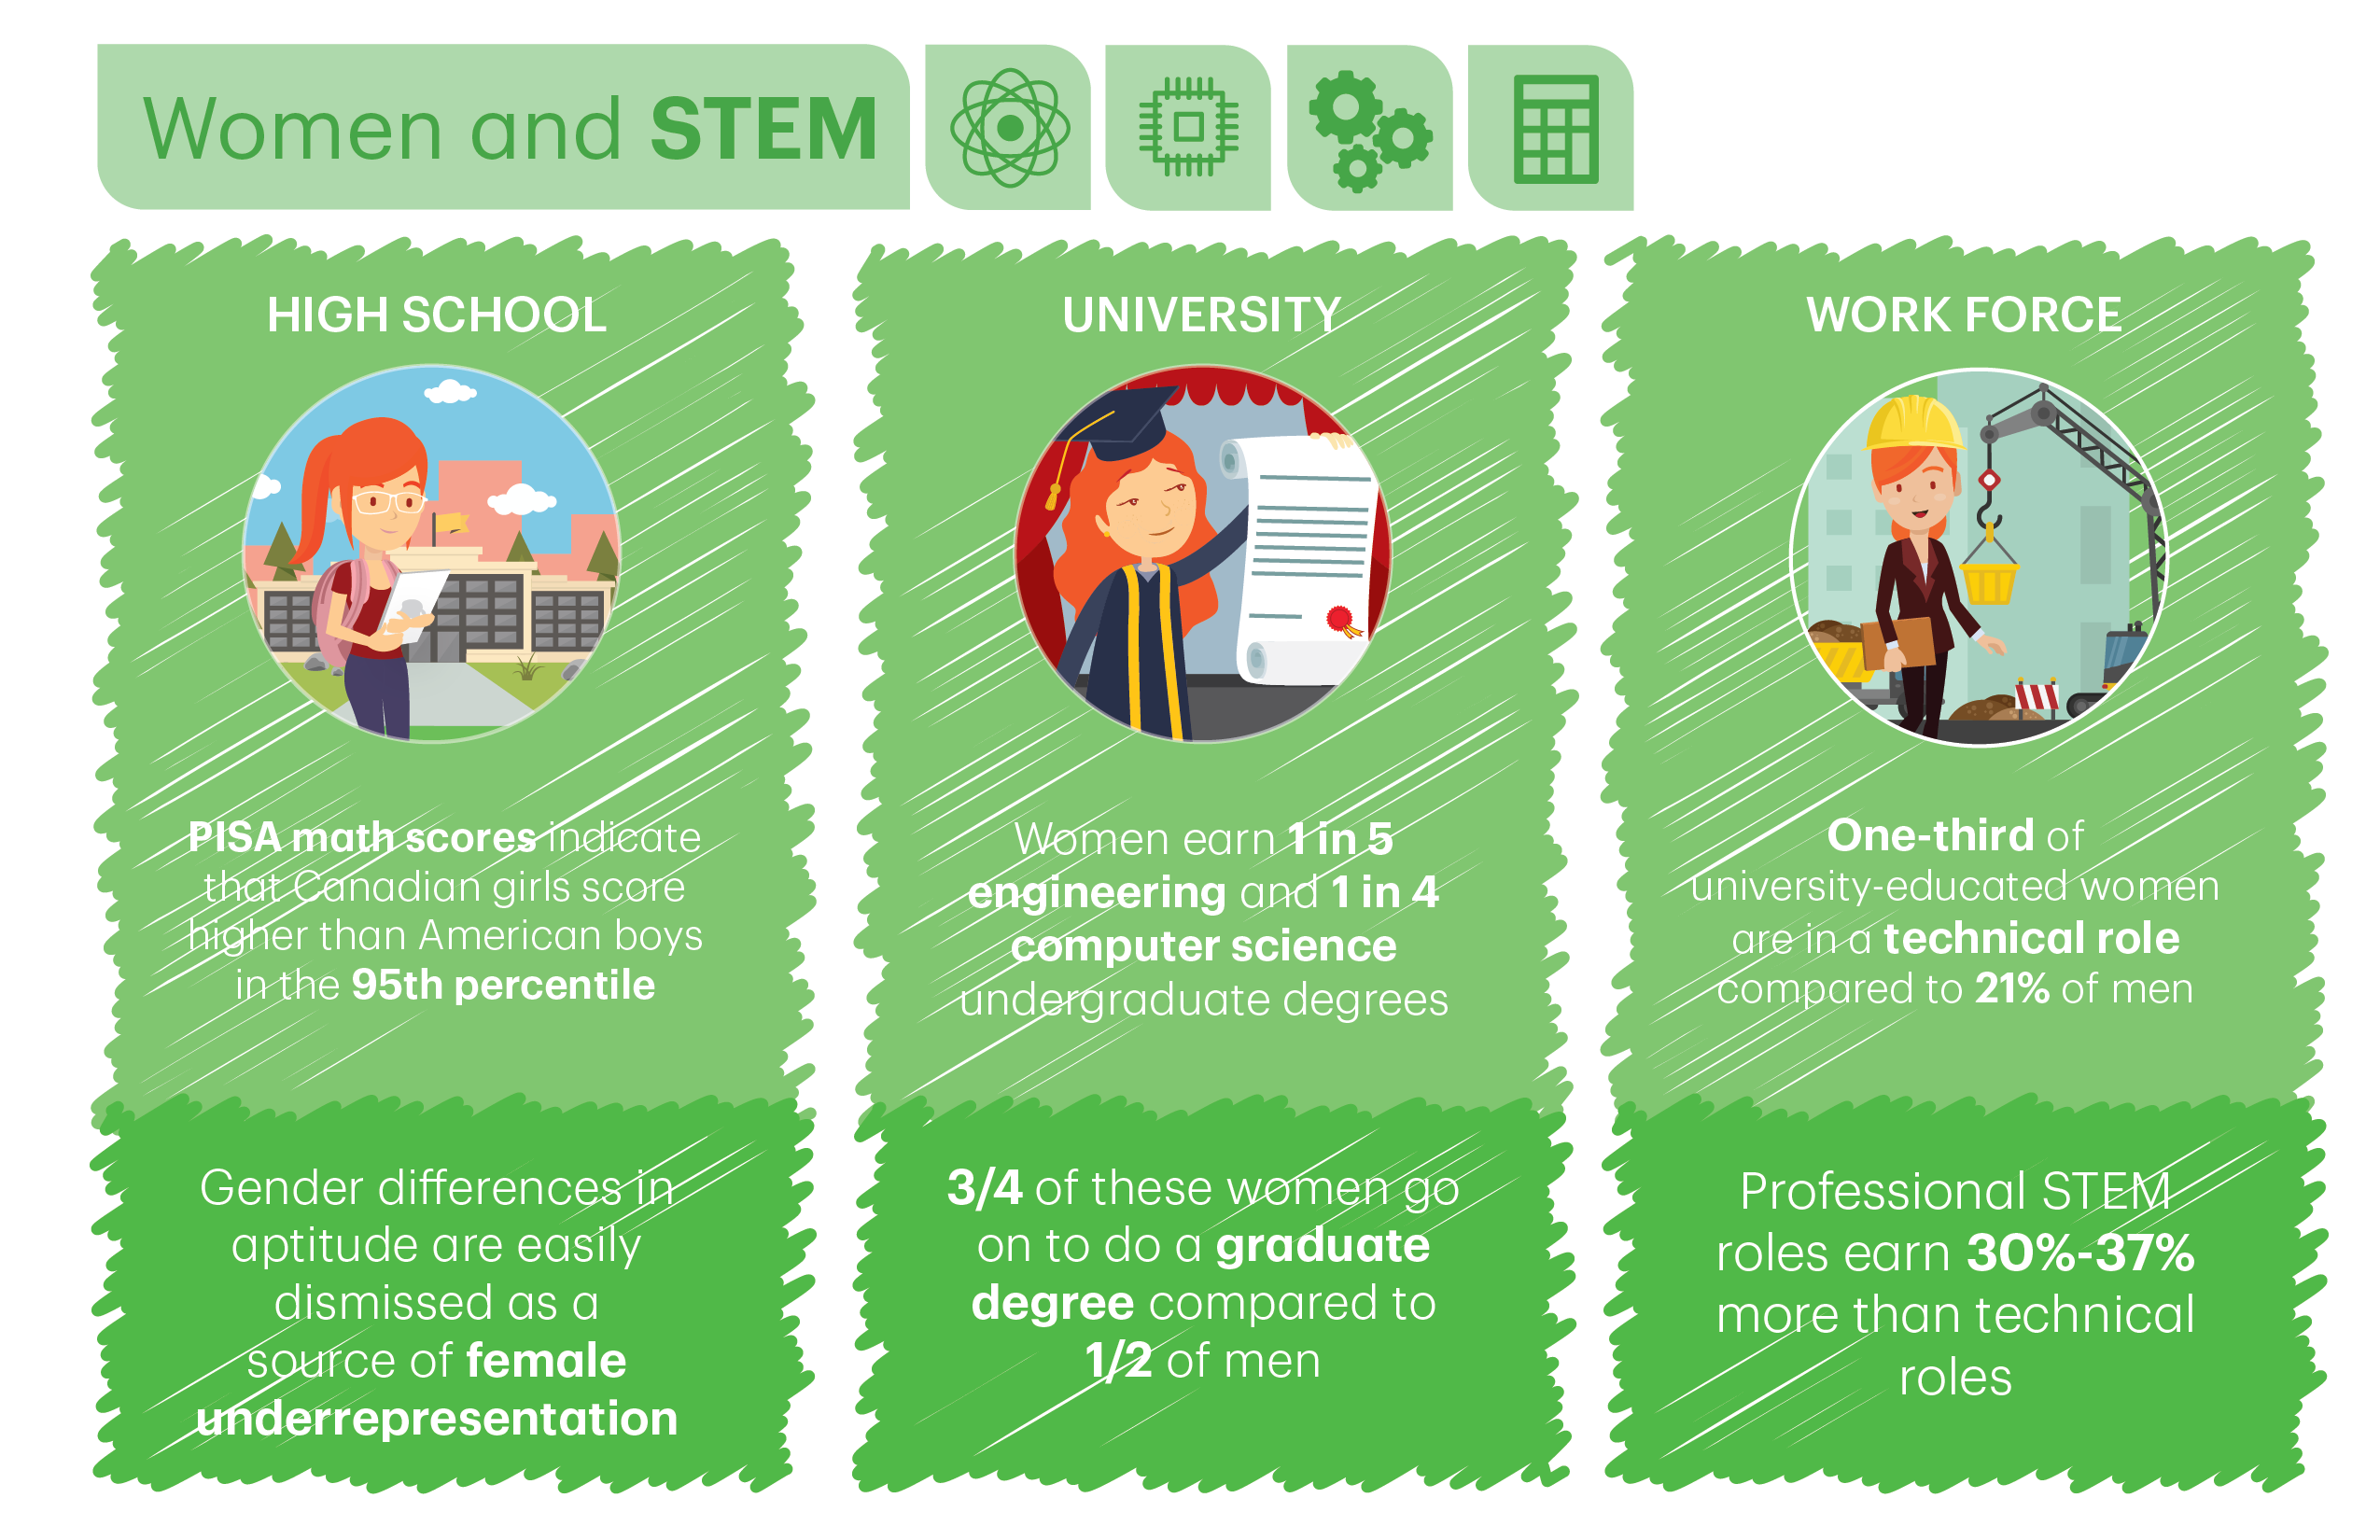
As noted earlier, STEM roles can be disaggregated into professional and technical, with the average wage for women in professional roles being 30% to 37% more than in technical roles. At all educational levels, the share of women employed in both segments is even at roughly one-quarter. However, women with a university degree are over-represented in technical roles, at a share of one-third (Chart 9). That ratio for men in technical roles is just 21%.
This phenomenon holds across the board. The widest divergence occurs within science (38% of women versus 24% of men). However, women with engineering and computer science BSc degrees also show a higher representation in technical roles.
Once a woman attains a master’s degree or higher, her odds improve in sidestepping the lower paying technical jobs. First, within the entire STEM field, the vast majority (78%) of MSc-holding women are employed within the professional field. Second, the concentration is more skewed to full-time roles. The one blemish is that the share of women with a MSc in professional roles has remained consistently lower than that of men, who have held steady at approximately 84% for the past five years. Computer science occupations exhibit an additional anomaly, with an unusually high representation of MSc-level women in part-time technical roles (Chart 10). It is unclear the degree to which these dynamics reflect involuntary or voluntary part-time self-selection. It may speak to hiring biases and/or culture shortcomings that push women into part-time positions for work-life balance or other factors. By extension, it’s possible that a full-time pool of computer science workers is waiting in the wings for firms to attract away from part-time roles.

So, even at higher education levels, women may continue to suffer from occupational sorting, but to a far lesser extent than those with a bachelor-level degree. This leads to the view that it’s not sufficient for a company to take an active role in implementing initiatives to provide greater job opportunities to women within STEM fields. Employers need to look inward to review whether hiring biases are occurring by asking and measuring the most basic of questions: Are employees right-skilled to their education and skill levels? Are development and professional opportunities provided equally to individuals? How might corporate culture cause friction for women preferring full-time roles?
Now we can really see the complexity that belies a systemic gender wage gap within STEM, before even taking into consideration other aspects that are known to leave their long-term mark on earnings, such as interrupted careers from motherhood. A simple add-up reveals:
Persistent gender wage gap = low university representation + even lower workplace representation + higher representation in lower paying technical roles + higher part-time employment representation
STEM education gap: Bridging the divide
For employers and policymakers, improving gender differences within STEM fields can be boiled down into two buckets:
- How to increase the pipeline in education
- How to ensure equal opportunities in the workplace, in the broader scope of attracting and retaining talent

High proficiency in math ultimately underpins the pursuit of STEM fields, and gender differences in mathematical aptitude are easily dismissed as a source of female underrepresentation. The Program of International Student Assessment (PISA) regularly studies a sample of 15-year old youth across OECD countries. The 2015 results show that the mean math score among Canadian girls in the 95th percentile is higher than U.S. boys. There is also a higher share of Canadian girls achieving that level. Girls in China, Singapore, Korea and Switzerland show a strong relative outperformance when compared to boys from most other OECD countries (Chart 11). If educational selection was purely about math ability, then Canadian girls would show a higher representation in STEM than American boys. Research and evidence point to institutional, social and cultural factors at play. More importantly, there are plenty of examples on how changing those influences produce higher female engagement in STEM.
Studies by Statistics Canada and the OECD show that self-assessments or perceptions of competency are one key underpinning to a person’s field of educational choice. A 2012 Statistics Canada8 report reviewed PISA outcomes along with longitudinal data from the Youth in Transition Survey (YITS). The YITS-PISA results effectively followed the same 15-year olds through to the age of 25, helping to assess the relationship between mathematical ability and university program choice. The findings showed that 40% of men who went to university opted for a STEM program, compared to only 20% of women. In both cases, those who chose STEM had higher PISA mathematical test scores in their mid-teens than those who went into other university programs. But, more telling was that women with higher PISA mathematical scores were still less likely to choose a STEM program relative to  men with lower scores. Only 23% of women who scored high in mathematical ability chose a STEM field, compared to nearly 39% of men who scored at the lower end of the scale (Chart 12). Regardless of mathematical proficiency, women were less likely to choose STEM.
Now the question is why? This is often a source of debate, but a critical answer is provided within the YITS study, which contained self-perceived measures of mathematical ability. Respondents rated themselves on a scale from poor to excellent. Relative to young women, high school male youths consistently had a higher self-perception of their abilities, regardless of their mathematical scores. Those who had higher perceptions of their skill level were more likely to choose a STEM program upon university entry (Chart 13). In other words, men with higher and lower PISA scores were more likely to choose STEM than women, and the selection margin over women was quite wide in both cases of aptitude. These study results were from 2012, but the outcomes are not a new phenomenon and are consistent to reports conducted a decade prior.
For instance, researcher Shelly Correll came to similar conclusions in a 2001 report9, and went so far as to comment that boys don’t always pursue a mathematical career path because they are the best qualified for careers that require its proficiency. In part, they do so because they believe they are better at the subject.  Herein lays a bigger phenomenon with potentially far-reaching impacts for economies that are not able to tap into the full potential of its labour force, particularly within a field that is expanding rapidly within a broad swath of industries.
Self-perception is certainly not the only factor influencing educational choice, but it does appear to be an important building block. It is difficult to disentangle the degree in which differing factors, or combinations, play a role, such as cultural norms, role models (or lack thereof), workplace environment perceptions, and importantly, how subjects are taught in the classroom to retain student interest and create desirability for STEM careers. The OECD cites several different studies among varying countries supporting the finding that students in primary school tend to show a relatively high and stable interest in science, but this declines as they progress through higher grades of education10. From this, the report emphasizes the importance of maintaining a connection among students and career paths within the classroom, in order to influence greater engagement in the absence of gender stereotypes.
Small changes = large outcomes
This might all seem a bit fluffy in terms of advice in the absence of specifics. It clearly makes intuitive sense, but success ultimately lies in consistent engagement and execution. A 2016 STEM professional learning program by the Toronto District School Board for kindergarten to Grade 12 (K-12) teachers cited STEM career awareness as a particular area of concern, with nearly 40% of respondents not knowing where to go to learn more about STEM careers11. In addition, there were extremely limited teaching activities involving cooperative opportunities with businesses, site visits and robotics. Targeted resources and training for teachers, alongside consistent implementation within teaching methods across geography can go a long way to help raise female student engagement within STEM fields.
Universities have found success by implementing relatively minor adjustments in teaching approaches. For instance, the American school, Harvey Mudd College, proved that changing curriculums to be more inclusive pays large dividends. Harvey Mudd redesigned its mandatory computer science (CS) introductory course for first-year students to include practical uses for programming and create a separate introductory course for those who lacked the exposure from prior educational experiences12. In 2006, only 12% of CS graduates were women. By devising a multi-step plan, female CS majors rose to 40%, as quickly as upon completion of the first four-year experiment. That ratio has since risen further. Some of the tactics were as simple as renaming courses to create greater appeal, with words such as “creative” and “problem solving”. To help encourage women to remain with CS beyond the introductory course, female professors took students to conferences that highlight women working within the technology field. And, to create the connection between education and workplace, the college provided meaningful summer research programs. Second year students worked on items like educational games that helped connect CS programs to other areas of interest for women. The latter point is an important one. “How” a subject is taught is as important as “what” is taught. And, the messaging and reality needs to be applicable to the workplace.
Increasingly, other educational institutions are making changes and finding success in attracting women to STEM fields. For the 2015 class, Stanford University reported that CS became the most popular major for female declarations by upper-class students, with human biology slipping to second13. Back on Canadian soil, the University of Toronto and the University of Waterloo are showing a steady uptrend in first-year female engineer enrollments, at roughly 30% in the 2016-17 academic year (versus 21% or less prior to 2008). At Stanford, that figure stands higher at 37%. This uptrend is a positive development, but reflects only one-third of the equation. The other parts lie with facilitating completion of these programs by eliminating any hidden gender biases within classrooms, and then retaining graduates in the workforce.
A collage of studies shows at nearly every step of career development, women may be encountering experiences that marginalize their contributions within the classroom and workplace14. We’ve already demonstrated how this may be occurring in the workplace by the over-representation of female BSc graduates within technical fields. However, this outcome may be rooted in selection biases that occur systemically through development.
One Yale University study of interest, and controversy, analyzed whether gender biases existed within the academic field itself, as a partial explanation of poor representation of women15. A double-blind study randomly assigned a male or female name to applicants for a science laboratory manager position. Faculty participants from various universities and science disciplines consistently rated male applicants significantly more competent than the female candidate despite identical applicant materials. Particularly surprising, female academics were just as likely to do so as their male counterparts. The study showed that the participants were also more likely to offer the male applicants higher starting salaries and more career mentoring opportunities. This notion is supported in various separate longitudinal studies that document internship and classroom experiences among women, creating a perception of being provided more menial responsibilities relative to their male counterparts. Naturally, this could impact resumes and subsequent job suitability. Intuitively, unconscious or subtle biases would influence over time a woman’s choice to remain within her field of study, even once success is achieved on STEM university enrollment.
Concluding thoughts:
If nothing else, this report should drive home that the potential causes for women under-representation in STEM fields are many and complex, and this is ultimately mirrored in the solutions. Girls and women appear to face many layers of systemic bias throughout their career progression within the STEM field. Everyone has a role to play in reducing educational and labour market friction.
Educational choice is influenced by environmental and cultural factors as early as primary school in shaping attitudes toward STEM-related subjects. Aptitude in math as the primary factor in educational choice has been debunked many times over. Educational programs must look inward to enhance engagement, coupled with more consideration given to mandatory requirements on programs like computer science, alongside foundational engineering concepts. Make the subjects more inclusive and relevant to girls. Real-world applications within teaching practices in a consistent manner across educational institutions could also serve to enhance knowledge of STEM careers. Efforts at various institutions have shown to pay dividends in doing so. This should be done to the benefit of both girls and boys.
Within the workplace, employers need to revisit whether ongoing marginalization is present via occupational sorting within technical fields, lower wages than male peers, and/or a scarcity of meaningful internships and challenging opportunities. It is incumbent upon employers to track and measure outcomes within their hiring and career development practices.
Ultimately the goal for any firm is to ensure the skills of their existing workforce are optimally leveraged. Right-skilling and development opportunities are crucial to that outcome. But, this is only part of the equation, because at the root, a company needs to be able to attract and retain the highest talent. Firms that argue there’s insufficient supply of women need to first ensure the elimination of attitudes that can create workforce friction that cause women to either self-select out of the STEM workforce, or shift involuntarily into part-time ranks. To have run the gauntlet through a twenty year educational journey, only to experience a fatal career blow due to corporate culture is a loss to society and the economy.
Meanwhile, for women already within STEM fields, or those aspiring to be so, we hope you find inspiration from Elsie MacGill to persist and agitate for change in the pursuit of your career aspirations. Women already in leadership positions, or those who have navigated the inroads to STEM careers, are uniquely positioned to help in this endeavor by engaging and mentoring younger generations and influencing corporate policies.
For parents and younger generations, don’t observe from the sidelines; get your hands dirty to build experience, relationships and career alignment. We hope this report offers some insight to parents on the importance of encouraging and providing young girls exposure to STEM fields and their potential career opportunities. Unlike the days of Elsie MacGill, there are many options for programs that can help in these and other initiatives. (Appendix 1A and 1B offer a short list to help get you started).
Tables
| Table 1: Occupational Classifications for Selected STEM Fields | ||
| Technical | Professional | |
| Engineering | Bridge Design Technician | Mechanical Engineer |
| Building Materials Technician | Nuclear Engineer | |
| Communications Technologist | Robotics Engineer | |
| Construction Technologist | Petrochemical Engineer | |
| Heating, Ventilation & AC Technologist | Civil Engineer | |
| Machine Designer | Materials Engineer | |
| Manufacturing Technologist | Computer Hardware Engineer | |
| Tool Designer | Aerospace Engineer | |
| Computer Science | Data Centre Operator | Computer Software Engineer |
| Network Support Technician | Computer Programmer | |
| System Administrator | E-Business Software Developer | |
| Software Tester | IT Consultant | |
| Software Installation Technician | Internet Site Developer | |
| Software Technical Support Analyst | Webmaster | |
| Application Tester | Data Administrator | |
| Web Technician | Application Programmer | |
| Source: Statistics Canada, TD Economics. | ||
| Appendix 1A: Examples of Initiatives to Promote/Retain Women in STEM | |
| Organization | Initiative |
| CATA Alliance – CanWIT (Women in Tech), global networking group | Forum for women professionals in tech to network and connect with peers, promote research and seek advice |
| Women in Communications and Technology (WCT) – Dr. Roberta Bondar Career Development Program for young women in science and technology occupations | Aims to inspire women engineers, researchers, scientists, computer scientists and electrical engineers to move forward in STEM fields |
| Communitech & The DMZ at Ryerson - Technical Chats for Women P2P | Opportunity for peer-to-peer networking and topical discussions for women in technology roles |
| The Canadian Centre for Women in Science, Engineering, Trades and Technology (WinSett Centre) – advances women's leadership skills | Advances women's leadership skills in SETT careers |
| Make Possible – members of Society for Women in Science and Technology (SCWIST) | Mentoring network to advance women in science and technology fields |
| #MoveThe Dial | New movement focused on creating solutions for leadership diversity in tech |
| Communitech Women in Technology Mentorship Program | 1:1 Mentoring between experienced tech professionals and early-career mentees for networking, skill development |
| Girl Geeks Dinner | Regional meet-ups that offer networking and opportunity to meet and hear from women in technology sectors |
| TechGirls Canada | Proudly supports women of colour, LGBTTQ, and aboriginal trailblazers. Is committed to fostering collaboration in designing solutions to address the barriers for diversity in the technology sector |
| *The initiatives indicated are neither all-inclusive, nor serve as a recommendation by the authors of this report. They are illustrative of programs encountered while undertaking research for this report. | |
| Appendix 1B: Examples of Options Available for Women to Participate in STEM-Related Activities | |
| Camps and Programs | |
| Elementary School/Junior Girls | • MakerGirls Camp – University of Ottawa (grades 5-7) |
| • Girls' Jr. DEEP – University of Toronto (grades 5-8) | |
| • DW Girls Club – University of Western Ontario (grades 3 -8) | |
| • Girls Quest/Girls Quest Tech – Queen's University (grades 4-8) | |
| • STEAM Camps, Now That's Cool! – University of Ontario Institute of Technology (grades 4-8) | |
| • CodeGirl Camp – Victoria, BC (grades 3-6) | |
| • GEM Club/Girls Coding Club – University of Alberta (grades 3-9) | |
| • AL!VE – InnovateHer – Simon Fraser University | |
| • Coding Girls (Level UP Learning Centres) – Alberta, British Columbia, New Brunswick, Nova Scotia, Toronto, Ottawa, PEI, Saskatchewan (grades 4-9) | |
| • Girls UNBound – University of New Brunswick (grades 4-9) | |
| • Girls Learning Code – select cities across Canada (grades 1 – 10) | |
| • WISE Kid-Netic Energy, All-Girls Codemakers Camp – University of Manitoba (grades 7-9) | |
| High School/Senior Girls | • Code Squad – University of Waterloo (grade 10) |
| • Think about Math – University of Waterloo (grades 9 – 10) | |
| • WISEatlantic Canada - Girls Get WISE Summer Camps (grades 8-10) | |
| • EXPLORE Engineering Program – Dalhousie University (grades 11-12) | |
| • Canadian Mathematical Society, Math Quest – Queen's University (grades 9-12) | |
| • Virtual Ventures, Game Design Sr. – Carleton University (grades 7- 9) | |
| • Go Code Girl – Across Ontario: Toronto, Ottawa, Waterloo, London, Hamilton and British Columbia: Vancouver, Burnaby (grades 7-11) | |
| Conferences/Workshops/Websites | |
| • Engineer Girl – interactive website to interest girls in engineering | |
| • Girls in STEM Conference – annual conference for girls in grades 6-9 and their parents (University of Toronto) | |
| • Girls FIRST Weekend, FIRST Robotics Canada – for girls in grades 9-12 to become inspired and interested in STEM | |
| • Technical Chats for Women (P2P) – series of monthly events for peer to peer networking for women in technology roles (hosted at Ryerson University, Communitech, VentureLAB) | |
| • Girls Rock I.T. – event geared towards grade 7 and 8 girls (Fanshawe College) | |
| • Go Eng Girl – provides an opportunity for girls in grades 7-10 across Ontario and a parent/guardian to visit their local university campus | |
| • Catalyst Conference (Engineering) – grade 11 girls (University of Waterloo) | |
| *The initiatives indicated are neither all-inclusive, nor serve as a recommendation by the authors of this report. They are illustrative of programs encountered while undertaking research for this report. | |
End Notes
- https://www.brookings.edu/wp-content/uploads/2016/06/TheHiddenSTEMEconomy610.pdf
- Ibid.
- As an example, within computer science occupations, technicians work in computer networking, user support, and information systems testing. Employers can span from manufacturers to call centers. In contrast, professionals would typically be categorized within computer and information systems, employed by computer software development and information technology consulting, research and development companies; advertising agencies; and information technology units.
- https://www.brookings.edu/wp-content/uploads/2015/02/AdvancedIndustry_FinalFeb2lores-1.pdf
- https://www.brookings.edu/research/americas-advanced-industries-new-trends/
- https://www.glassdoor.com/blog/the-gender-pay-gap-in-tech/
- The field referred to as engineering in an educational context also includes architecture. This is in contrast to the labour market data where engineering refers solely to engineers. The engineering field represents almost six times the amount of full-time employment compared to architecture and the engineering field therefore likely dwarfs architecture in the context of the educational aggregate.
- Hango, Darcy, Statistics Canada, Gender differences in science, technology, engineering, mathematics and computer science (STEM) programs at university, December 2014.
- Correll, Shelley J. “Gender and the Career Choice Process: The Role of Biased Self-Assessments.” American Journal of Sociology, vol. 106, no. 6, 2001, pp. 1691–1730. JSTOR, JSTOR, www.jstor.org/stable/10.1086/321299
- See page 106: http://www.keepeek.com/Digital-Asset-Management/oecd/social-issues-migration-health/close-the-gender-gap-now_9789264179370-en#page1
- http://www.tdsb.on.ca/Portals/research/docs/reports/TDSBSTEMStrategyResearchRpt1.pdf
- https://www.hmc.edu/about-hmc/2015/03/26/new-report-on-women-in-stem-features-harvey-mudds-cs-program/
- http://www.stanforddaily.com/2015/10/12/computer-science-now-most-popular-major-for-women/
- See, for example: https://www.aauw.org/files/2013/02/Why-So-Few-Women-in-Science-Technology-Engineering-and-Mathematics.pdf
- http://www.pnas.org/content/109/41/16474.full.pdf
Disclaimer
This report is provided by TD Economics. It is for informational and educational purposes only as of the date of writing, and may not be appropriate for other purposes. The views and opinions expressed may change at any time based on market or other conditions and may not come to pass. This material is not intended to be relied upon as investment advice or recommendations, does not constitute a solicitation to buy or sell securities and should not be considered specific legal, investment or tax advice. The report does not provide material information about the business and affairs of TD Bank Group and the members of TD Economics are not spokespersons for TD Bank Group with respect to its business and affairs. The information contained in this report has been drawn from sources believed to be reliable, but is not guaranteed to be accurate or complete. This report contains economic analysis and views, including about future economic and financial markets performance. These are based on certain assumptions and other factors, and are subject to inherent risks and uncertainties. The actual outcome may be materially different. The Toronto-Dominion Bank and its affiliates and related entities that comprise the TD Bank Group are not liable for any errors or omissions in the information, analysis or views contained in this report, or for any loss or damage suffered.