Highlights
- After a difficult third wave, consumer spending is lifting off as restrictions ease across Canada. The rate of spending growth has rebounded since May and could move higher as the benefits of re-openings and pent-up demand are reaped.
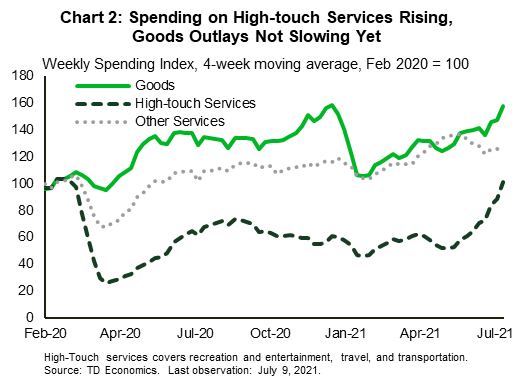
- Spending on high-touch services – notably for entertainment, travel, and transportation – is driving the consumption rebound. At the same time, goods spending has also strengthened, suggesting that consumers are beginning to return to pre-pandemic saving-spending patterns.
- The Delta variant looms large in the background. So far, Canada has evaded the uptick in cases that has been seen across the world, but a renewed up-wave could throw a wrench in reopening plans and the recovery in high-contact service spending. Continued success in vaccinations would help to mitigate this risk.
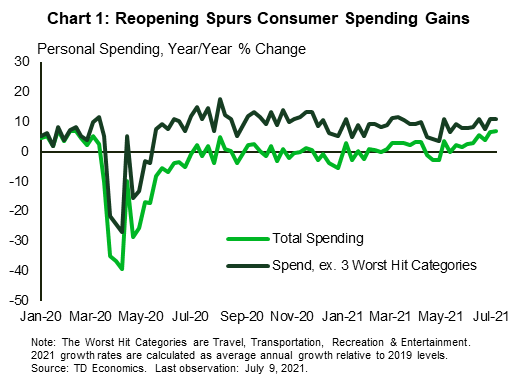
Anonymous, aggregated TD Spending Data provide valuable, timely insights on Canadian spending patterns. After a difficult third wave earlier this year, provinces moved to gradually reopen their economies as the vaccination rollout ramped up across Canada. By the late spring, nearly all provinces had eased restrictions, and more than 60% of Canadians had received one dose of the vaccine. This resulted in a strong rebound in consumer spending. Average annual spending growth (calculated against 2019 levels to control for base year effects) more than doubled, rising from a weekly pace of 1.8% in May to 4.7%, on average, over June and early July (Chart 1).1 The last time spending growth was this strong was prior to the pandemic. At the same time, excluding the categories worst hit by the virus (travel, transportation, and recreation and entertainment), spending growth has remained broadly stable since March, averaging 10% on a weekly basis.
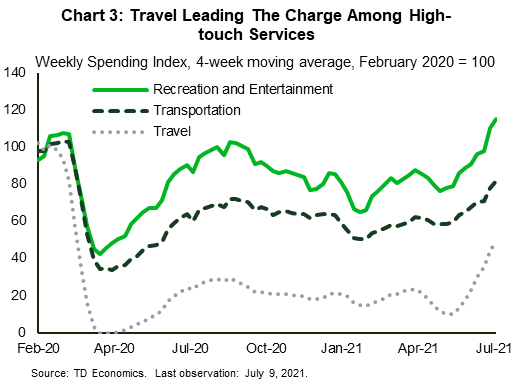
The narrowing of the gap between growth in total spending and that excluding hard hit categories implies that Canadians were beginning to indulge in high-touch services again. Indeed, outlays in travel, transportation, and recreation and entertainment have improved markedly since restrictions were eased in June (Chart 2). In fact, the level of spending on recreation and entertainment activities was 15% above its pre-pandemic (February 2020) level in the first week of July (Chart 3). Transportation and travel services also saw impressive rebounds. Relative to the last week of May, travel and transportation expenditure increased by 150% and 20%, respectively, by the end of June. At the same time, goods spending has also strengthened, suggesting that consumers are beginning to return to pre-pandemic saving-spending patterns.
The strongest rebounds in consumption, specifically in high-touch categories, have come in provinces that went further along in reopening their economies (Chart 4). According to the Bank of Canada COVID-19 stringency index, Ontario lifted the most restrictions — reflected in a 25-point drop in the index —which resulted in a 40% increase in travel, transportation, and recreation and entertainment purchases. Manitoba stands as an outlier as the only region to tighten restrictions in June relative to May, but even here spending rose by nearly 20% over a one-month period. This anomaly is likely due the stringency index not capturing a subsequent easing of restrictions in the province in late June.

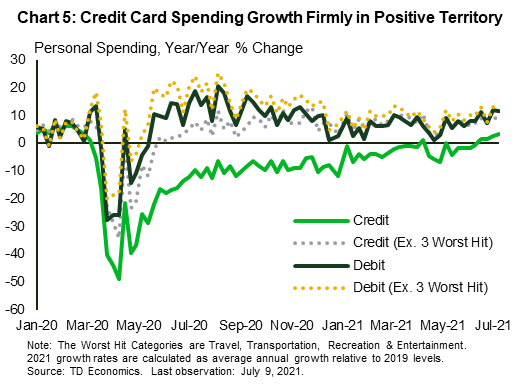
As high touch services expenditure improved, credit card spending also picked up (Chart 4). Consumers, as they had in pre-pandemic times, seemingly once again relied on credit cards to make travel, and recreation and entertainment purchases, instead of dipping directly into their deposit accounts. This has helped fuel a recovery in total credit card spending growth, which is now firmly in positively territory, and is poised to pick up further as more restrictions are lifted.
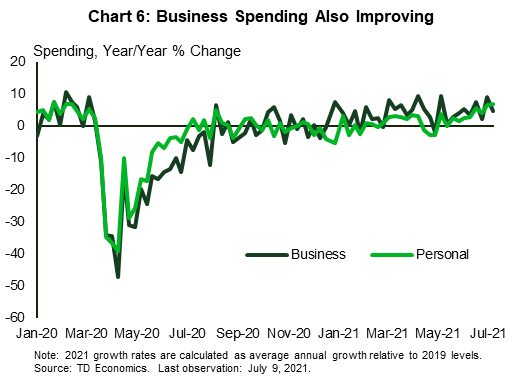
Turning to business spending, firms— like consumers – have gradually boosted outlays since June (Chart 5). This is consistent with results of the recent Bank of Canada Business Outlook Survey and the Canadian Federation of Independent Businesses’ Business Barometer. The surveys reported that many firms were expecting a healthy improvement in future sales and were planning on undertaking investments that were sidelined due to COVID-19.
Reopening across the country is spurring a rebound in consumer and business spending. Pent up demand for services that have been restricted for over a year, and greater optimism of a post-pandemic future, are driving strong economic activity to start the summer. But not everything is sunshine and rainbows. The Delta variant looms large in the background. So far, Canada has evaded the uptick in cases that has been seen across the world, and there’s no guarantee that it will continue to do so even with the impressive take up of vaccines. There is emerging evidence, however, of vaccines breaking the link between cases and hospitalizations. Continued strong vaccination rates would help to mitigate the risk of the Delta variant as well as government backtracking on reopening. Pandemic uncertainty is back on the rise, and Canada is not immune.
End Notes
- Year-over-year growth in 2021 is calculated relative to the 2019 level, by first calculating the percentage change and then taking the annual average. This is to account for base-year effects caused by the pandemic in 2020.
Disclaimer
This report is provided by TD Economics. It is for informational and educational purposes only as of the date of writing, and may not be appropriate for other purposes. The views and opinions expressed may change at any time based on market or other conditions and may not come to pass. This material is not intended to be relied upon as investment advice or recommendations, does not constitute a solicitation to buy or sell securities and should not be considered specific legal, investment or tax advice. The report does not provide material information about the business and affairs of TD Bank Group and the members of TD Economics are not spokespersons for TD Bank Group with respect to its business and affairs. The information contained in this report has been drawn from sources believed to be reliable, but is not guaranteed to be accurate or complete. This report contains economic analysis and views, including about future economic and financial markets performance. These are based on certain assumptions and other factors, and are subject to inherent risks and uncertainties. The actual outcome may be materially different. The Toronto-Dominion Bank and its affiliates and related entities that comprise the TD Bank Group are not liable for any errors or omissions in the information, analysis or views contained in this report, or for any loss or damage suffered.
Download
Share: