2026 Prince Edward Island Budget
Deficits Deepen, Debt Climbs
Rishi Sondhi, Economist | 416-983-8806
Date Published: April 15, 2026
- Category:
- Canada
- Government Finance & Policy
Highlights
- PEI’s FY 2026/27 deficit is forecast at $409.9 million (3.5% of GDP) — the largest in Canada and reminiscent of mid-1990s shortfalls.
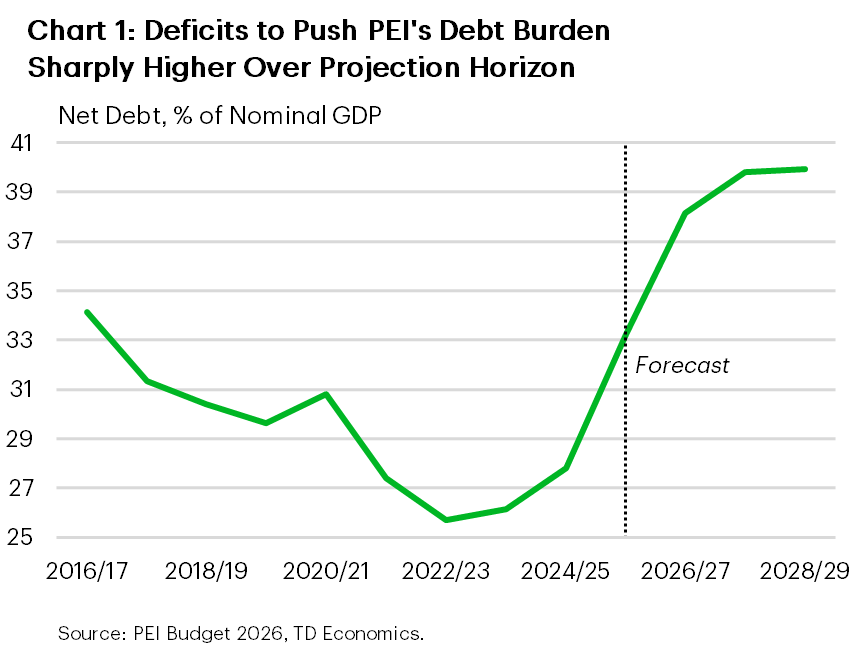
- Net debt is projected to jump to 38.1% of GDP in FY 2026/27 and approach 40% thereafter, lifting the interest bite from 5.9% to 7.2% by FY 2028/29.
- PEI is facing an eroded fiscal position despite solid growth projections (which face downside risk).
In Budget 2026, PEI is forecasting deep deficits that persist over the forecast horizon. In FY 2026/27, the deficit is pegged at $409.9 million. This clocks in at a heavy 3.5% of GDP – harkening back to the threatening shortfalls of the mid-1990s. It’s also on track to be the largest shortfall in Canada this year relative to the size of the economy. These deficits, alongside capital spending, also drive a significant projected increase in the Island’s debt burden over the forecast horizon.
The government is introducing a few notable tax measures in the budget, highlighted by a new P.E.I. Essentials Benefit. Revenues will get a boost from a new personal income tax bracket on incomes above $200k, higher property taxes and insurance premiums on non-resident owners (projected to bring in $2 million) and ending the energy rebate program in June.
Solid Economic Growth Projected for PEI
After advancing 4.3% in 2025, PEI’s sees it’s nominal GDP growing by a healthy 4%, on average, in 2026 and 2027. We’re in line with 2026 projections; however our estimate for 2027 is lower, suggesting some downside risk to PEI’s revenue intake next year if we’re more on the mark. Healthy nominal GDP growth drives an anticipated 3.5% gain in revenues in FY 2026/27, with similar gains expected from own-source revenues and federal transfers. Notably, the new P.E.I. Essentials Benefit will provide individuals $310 annually and $365 for couples depending on their income level, beginning on July 1st. The benefit is available on household incomes up to $95k and is phased out by $114k.
Muted Spending This Year
Total spending is seen as advancing 2% in FY 2026/27, decelerating from spending growth last year. Core services spending is healthy, with education spending projected to jump 13% while healthcare spending rises a hefty 5%. Meanwhile, contractions are slated for “other departments” including Transportation, Infrastructure and Energy, and Land and the Environment.
Debt Burden to Climb Rapidly
PEI’s debt burden is forecast to jump about 5 percentage points to 38.1% of GDP in FY 2026/27. It is then expected to rise to nearly 40% — the highest level since at least FY 1986/87. The heavier debt load is set to push interest costs materially higher (albeit from a low base). Indeed, interest costs are projected to climb from 5.9% of revenues in FY 2026/27 to 7.2% by FY 2028/29. Long-term borrowing needs are pegged at $900 million in FY 2026/27, modestly lower than last year.
Bottom Line
After a multi-year run of roughly balanced budgets, PEI is now facing a sharply deteriorated fiscal position. This comes even with solid economic growth projections (that face downside risk). Tempering this tone somewhat is the fact that PEI’s debt burden is starting from a more favourable position than many other provinces.
Prince Edward Island Government Fiscal Position
[ Millions of C$ Unless Otherwise Noted ]
| Prince Edward Island Government Fiscal Position | ||||||
| [ Millions of C$ Unless Otherwise Noted ] | ||||||
| Fiscal Year | 2025-26 Forecast |
2026-27 Estimate |
2027-28 Plan |
2028-29 Plan |
||
| Revenues | 3,271 | 3,386 | 3,535 | 3,701 | ||
| % Change | - | 3.5 | 4.4 | 4.7 | ||
| Provincial* | 1,963 | 2,030 | 2,115 | 2,210 | ||
| % Change | - | 3.4 | 4.2 | 4.5 | ||
| Federal Transfers | 1,308 | 1,356 | 1,420 | 1,491 | ||
| % Change | - | 3.7 | 4.7 | 5.0 | ||
| Expenditures | 3,720 | 3,796 | 3,921 | 4,039 | ||
| % Change | - | 2.0 | 3.3 | 3.0 | ||
| Program Spending | 3,696 | 3,762 | 3,853 | 3,959 | ||
| Interest | 171 | 201 | 248 | 268 | ||
| Amortization | 146 | 167 | 179 | 188 | ||
| Budget Balance | -449.6 | -409.9 | -386.2 | -338.0 | ||
| % of GDP | -4.0 | -3.5 | -3.1 | -2.6 | ||
| Net Debt | 3,775 | 4,505 | 4,892 | 5,127 | ||
| % of GDP | 33.2 | 38.1 | 39.8 | 39.9 | ||
Disclaimer
This report is provided by TD Economics. It is for informational and educational purposes only as of the date of writing, and may not be appropriate for other purposes. The views and opinions expressed may change at any time based on market or other conditions and may not come to pass. This material is not intended to be relied upon as investment advice or recommendations, does not constitute a solicitation to buy or sell securities and should not be considered specific legal, investment or tax advice. The report does not provide material information about the business and affairs of TD Bank Group and the members of TD Economics are not spokespersons for TD Bank Group with respect to its business and affairs. The information contained in this report has been drawn from sources believed to be reliable, but is not guaranteed to be accurate or complete. This report contains economic analysis and views, including about future economic and financial markets performance. These are based on certain assumptions and other factors, and are subject to inherent risks and uncertainties. The actual outcome may be materially different. The Toronto-Dominion Bank and its affiliates and related entities that comprise the TD Bank Group are not liable for any errors or omissions in the information, analysis or views contained in this report, or for any loss or damage suffered.
Download
Share this: