2026 Ontario Budget
Cautious Growth, Targeted Relief, Rising Debt Pressures
Rishi Sondhi, Economist | 416-983-8806
Date Published: March 26, 2026
- Category:
- Canada
- Government Finance & Policy
Highlights
- Budget 2026 delivers tax relief, but modest revenue growth and weak near term economic momentum keep deficits elevated.
- Program spending growth is restrained – with healthcare leading and education lagging. The path back to balance hinges on sustaining very slow spending gains over the planning horizon.
- Heavy capital investment and housing stimulus may support growth and productivity, but at the cost of higher borrowing needs and a rising debt to GDP ratio.
Budget 2026 delivers targeted tax relief, including a cut to the small business tax rate, alongside measures to lift Ontario’s flagging new home market and align with federal accelerated capital cost write offs. Spending growth remains modest through the planning horizon, led by healthcare while education lags. A marquee initiative is a new, privately-run $4 billion fund to support investment in industries like AI, advanced manufacturing, and defense.
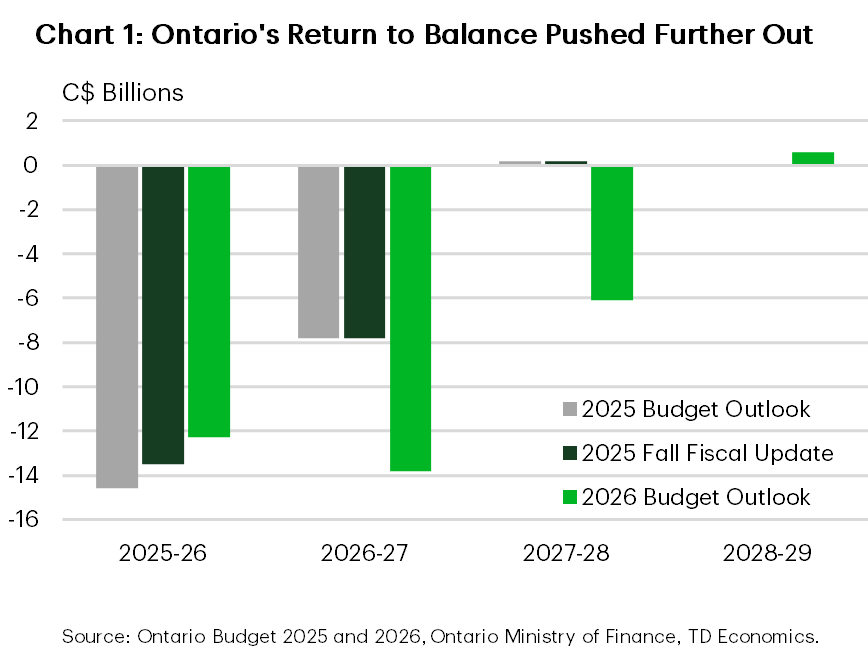
The government still has plans to balance the books, though the target has been pushed out one year to FY 2028/29. The FY 2026/27 deficit is pegged at $13.8 billion, up from $12.3 billion last year, but roughly steady at about 1.1% of GDP and broadly middle of the pack among provinces reporting so far this budget season. Ontario’s debt to GDP ratio, however, is projected to rise over the forecast horizon.
Ontario’s Economy to Struggle This Year
With the province dealing with an array of headwinds, Ontario’s GDP is forecast to grow just 1% this year—the weakest non pandemic outcome since the GFC. Real GDP growth averages 1.4% in 2026–27, in line with our call. Nominal GDP is seen rising 3.2% and 3.9% in 2026–27, with the 2026 forecast well below our outlook. Using the government’s sensitivities, this implies roughly $900 million in revenue upside this year if we’re more on the mark, but potential downside next year given our softer 2027 nominal GDP forecast.
Reflecting the uncertain backdrop, the government has run stronger and weaker growth scenarios. In the stronger scenario, GDP growth averages 1.9%, the FY 2026/27 deficit is smaller, and the budget is effectively balanced by FY 2027/28. In the weaker growth scenario, the deficit grows to $16.6 billion this year before shrinking to $8.3 billion in FY 2028/29.
Modest FY 2026/27 Revenue Growth in the Cards
Reflecting the soft economic backdrop and tax relief measures, FY 2026/27 revenues are seen as advancing a modest 2.3%. Personal income tax revenue is forecast to grow solidly, with slower gains across sales and corporate taxes. Thereafter, total revenue growth is seen as firming.
One of the government’s costlier measures sees the 13% HST eliminated on new homes for all buyers. This maximum rebate amounts to $130k and is maintained at this level for homes valued at up to $1.5 million. It then decreases proportionately to a maximum of $24k for homes valued at $1.85 million and above. This program is expected to cost the government some $1.4 billion in forgone revenues this year.
The government is also proposing a 1 ppt cut to 2.2% for Ontario’s small business tax rate. This measure is forecast to cost the government a cumulative $1.2 billion over the next 3 fiscal years, although some offset will come from a lower dividend tax credit rate for small businesses.
Notably, Ontario has used accelerated depreciation/expensing measures for several years. However, the 2026 Budget extends and refreshes this framework by paralleling the latest proposed federal measures. The measures will allow immediate 100% expensing for a broad range of machinery, equipment, and productivity enhancing assets. The government estimates that this will bring $3.5 billion in provincial tax relief over four years.
Spending Growth Set to Gear Down This Year
The Ontario government sees program spending growth easing to 2.1% in the upcoming fiscal year, even with some $1.5 billion earmarked for contingencies. Among big-ticket items, the strongest gains are in healthcare, reflecting demographic demands and capacity building initiatives. Included in this is $325 million in new funding to accelerate attachment to family doctors and primary care teams, building on—but materially expanding—the existing plan.
Meanwhile, both non-post secondary and post-secondary education spending is projected to be roughly flat in FY 2026/27, the latter constrained by the drop in international students from federal government migration policy. This is despite an injection of $6.4 billion over 4 years.
The province will also establish the $4 billion Protect Ontario Account Investment Fund. Capital will be deployed by an independent, private-sector partner with the hope of attracting pension funds and other major investors to spread risk and multiply the total fund size.
What’s especially notable is that program spending growth averages less than 1% over the rest of the planning horizon, weighed down by a drop in post-secondary spending and modest gains elsewhere.
Capital Spending to Pressure the Debt Burden
The province’s debt burden is projected to creep higher over the planning horizon, with net debt-to-GDP rising from 35.7% in FY 2025/26 to 38.2% by 2028/29. This marks a change from the post-pandemic period that was characterized by a sharp drop in the ratio to multi-year lows. However, the projected path would still level the debt burden generally in line with its long-run average.
Capital spending features prominently again in Budget 2026. Investment is seen as totalling $37 billion in FY 2026/27, up from $33 billion in FY 2025/26. Over a 10-year planning horizon, investments are set to total a massive $210 billion. Transit and hospitals capture the largest share of outlays.
The share of revenues dedicated to debt servicing is seen as climbing from 7.1% in FY 2025/26 to 7.8% by FY 2028/29. While miles below the threatening double-digit figures seen in the early 90s – early 2000s, it represents a growing constraint on fiscal flexibility and increases the province’s exposure to interest rate shocks.
Borrowing requirements are seen at $47.2 billion in FY 2026/27, driven by operating deficits, refinancing needs and a hefty capital spending plan. However, they’re down from $58.6 billion the year prior.
Bottom Line
The government’s nominal GDP growth projection is conservative for this year, which is likely appropriate given heightened vulnerability of Ontario to Middle East tensions and volatile commodity prices given its status as a net energy importer. So, while revenues have a chance to surprise on the upside, balancing the budget over time hinges on very slow program spending growth being achieved and maintained. Demographic and capacity pressures in the system could make this tough to achieve, particularly on the health care side, which was notably level-shifted upwards from the 2025 fall statement.
The elimination of the HST on new housing should offer some stimulus to the flagging housing market, with the province estimating an 8k gain in housing starts next year. Our preliminary estimates are leaning a bit more conservative, but there should nonetheless be a lift. The province’s tax action plan should also provide some lift to business investment at the margin by mirroring the federal accelerated capital cost allowance framework. The government has also maintained its heavy focus on capital spending, with the recently released spending intentions survey suggesting a solid year as well. Notably, government did show progress in this regard, including the announcement of the accelerated timelines for all-season roads to the ring of fire. The economic environment will likely challenge the outlook for the remainder of this year, but measures in this budget are hopefully aimed at lifting longer-term productivity – something the province has struggled with in the past. This comes, however, at the cost of sustained upward pressure on Ontario’s borrowing needs which, while currently still contained, can present a longer-term fiscal challenge if spending growth is not as restrained as the province projects.
Ontario Economic Assumptions
Annual Percent Change (Unless Otherwise Indicated)
| Calendar Year | 2025 | 2026 | 2027 | 2028 |
| Real GDP | ||||
| Budget 2026 | 1.2 | 1.0 | 1.7 | 1.8 |
| TD Economics Forecast | 1.4 | 0.9 | 1.8 | - |
| Nominal GDP | ||||
| Budget 2026 | 4.2 | 3.2 | 3.9 | 3.7 |
| TD Economics Forecast | 4.1 | 3.9 | 3.0 | - |
| 3-Month Treasury Bill Yield | ||||
| Budget 2026 | 2.6 | 2.3 | 2.6 | 2.5 |
| TD Economics Forecast | 2.6 | 2.2 | 2.3 | 2.3 |
| 10-Year Gov't Bond Yield | ||||
| Budget 2026 | 3.2 | 3.3 | 3.5 | 3.5 |
| TD Economics Forecast | 3.2 | 3.4 | 3.3 | 3.3 |
Government of Ontario Fiscal Plan
[ C$ billions unless otherwise noted ]
| Fiscal Year | 2026 Budget Plan | ||||
| 24-25 | 25-26 | 26-27 | 27-28 | 28-29 | |
| Revenues | 226.2 | 226.6 | 231.9 | 243.4 | 254.1 |
| % change | 8.2 | 0.2 | 2.3 | 5.0 | 4.4 |
| Expenditures | 227.3 | 238.4 | 244.2 | 247.5 | 251.1 |
| % change | 8.4 | 4.9 | 2.4 | 1.4 | 1.5 |
| Program Spending | 212.1 | 222.4 | 227.0 | 229.0 | 231.3 |
| % change | 8.7 | 4.9 | 2.1 | 0.9 | 1.0 |
| Interest Charges | 15.1 | 16.0 | 17.2 | 18.6 | 19.7 |
| % change | 4.4 | 6.0 | 7.5 | 8.1 | 5.9 |
| Reserve | 0.0 | 0.5 | 1.5 | 2.0 | 2.5 |
| Budget Balance | -1.1 | -12.3 | -13.8 | -6.1 | 0.6 |
| % of GDP | -0.1 | -1.0 | -1.1 | -0.5 | 0.0 |
| Net Debt | 427.1 | 459.4 | 485.1 | 514.4 | 529.3 |
| % of GDP | 35.7 | 36.8 | 37.7 | 38.5 | 38.2 |
Disclaimer
This report is provided by TD Economics. It is for informational and educational purposes only as of the date of writing, and may not be appropriate for other purposes. The views and opinions expressed may change at any time based on market or other conditions and may not come to pass. This material is not intended to be relied upon as investment advice or recommendations, does not constitute a solicitation to buy or sell securities and should not be considered specific legal, investment or tax advice. The report does not provide material information about the business and affairs of TD Bank Group and the members of TD Economics are not spokespersons for TD Bank Group with respect to its business and affairs. The information contained in this report has been drawn from sources believed to be reliable, but is not guaranteed to be accurate or complete. This report contains economic analysis and views, including about future economic and financial markets performance. These are based on certain assumptions and other factors, and are subject to inherent risks and uncertainties. The actual outcome may be materially different. The Toronto-Dominion Bank and its affiliates and related entities that comprise the TD Bank Group are not liable for any errors or omissions in the information, analysis or views contained in this report, or for any loss or damage suffered.
Download
Share: