Ontario Housing:
The 90s Downturn and Now
Rishi Sondhi, Economist | 416-983-8806
Date Published: December 4, 2023
- Category:
- Canada
- Real Estate
Highlights
- Based on the ratio of sales-to-new listings, Ontario’s housing market conditions have deteriorated to their loosest since the 2008-09 financial crisis. Moreover, there’s some risk the ratio drops to levels last seen during the 80s/90s housing downturn – which corresponded to a period when inflation-adjusted home prices suffered a 30% decline.
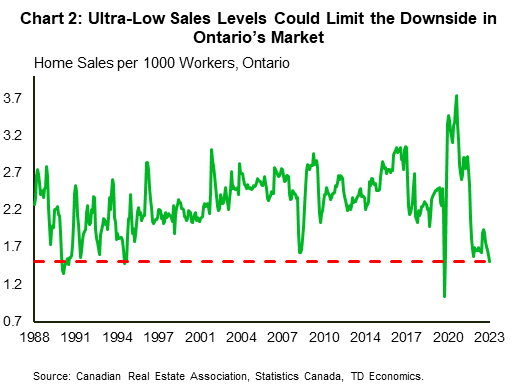
- Fortunately, there are good reasons to think such an outcome will be avoided, including a more resilient economy and a relatively favourable path for interest rates now compared to back then. Also, population growth is stronger, and sales levels are already incredibly low, suggesting less scope for downside. Investor activity remains a wildcard, with data limitations making this a grey area.
- Even if a 90s style downturn is avoided, elevated rates will likely push average home prices in Ontario lower over the next several months.
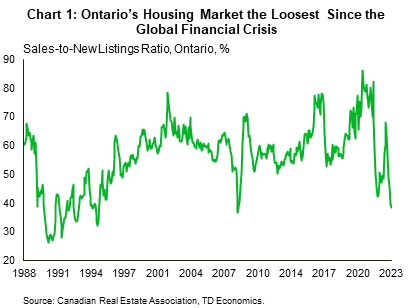
In October, Ontario’s sales-to-new listings ratio dropped to its lowest level since the depths of the 2008-09 financial crisis (Chart 1). This is noteworthy, as this ratio measures the supply/demand balance in housing markets and is a key predictor of future price changes. What’s also remarkable is that this ratio dropped to this level without the need for a deep recession, which was a condition in previous cycles. And, with elevated interest rates likely to keep near-term downward pressure on demand (and potentially upward pressure on supply), the ratio could fall even further in the near-term.
Such an outcome would leave Ontario’s market balance on par with where it was during the deep and prolonged housing market downturn experienced during the late 80’s through mid-90s. Back then, inflation-adjusted home prices plunged by 32% over 7 years across Ontario, with an even steeper 38% decline taking pace in the GTA. Ontario’s ratio approaching where it was during these depths certainly raises our eyebrows and warrants closer attention. What’s more, prices are only down 3% from their near-term peak in June through October, suggesting scope for further substantial downside. In this regard, this note provides a comparison between that period of weakness and the current cycle across several relevant variables.
Starting Point: Usually the spotlight is on absolute sales levels, but in per capita terms, sales are already running at lows reached well into the 90s cycle (Chart 2). This highlights the extent to which sales have already adjusted to the high-rate backdrop since early 2022, leaving less scope for demand and price adjustment going forward.
On the supply side, scaling listings to the population reveals that they were nearly 20% higher heading into the 90s downturn than they are now, even with the run-up Ontario’s experienced over the past several months.
GDP/Employment: The economic backdrop is one of the most important differences between the earlier period and now. Canada’s economy suffered a deep recession from March 1990 through May 1992, as it dealt with the fallout from tight monetary policy (forced through high inflation), a lagging response to technological change from Canadian firms, and fiscal belt tightening amid very large budget deficits2. In Ontario, GDP and employment dropped 6% on a peak-to-trough basis, while real personal disposable income plunged 4%. In contrast, employment and GDP have yet to meaningfully decline in Ontario, while real personal disposable income was up 2% year-on-year in the second quarter. Moving forward, we are expecting a flat economic performance for Ontario, but are not expecting a deep recession to manifest. Accordingly, only a mild dip in employment is expected for the province on a peak-to-trough basis (Chart 3).

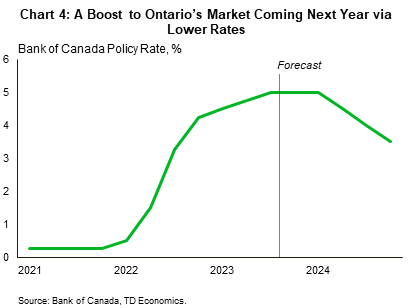
Interest Rates: From February 1989 (just before Ontario’s sales-to-new listings ratio started to deteriorate) through May of 1990, the Bank Rate (which was the Bank of Canada’s key interest rate during that period) increased by about 240 bps from 11.7% to 14.1%. So, rates were moving higher for more than a year in a situation where both housing and the economy were beginning to sour. In the current period, the Bank of Canada has held their policy rate as is for two straight meetings, and we think they’re done their hiking cycle, thereby helping the economy avoid a deeper downturn. In fact, our forecast expects cuts starting in the second quarter of next year (Chart 4).
Demographics/Population Growth: Population growth is much stronger now than it was back then, suggesting more fundamental support to housing demand. And in fact, Ontario has a housing shortage, which could grow even more over the next few years if population growth continues to be robust. In comparison, builders were having an easier time keeping up with population growth in the late 80s/early 90s.
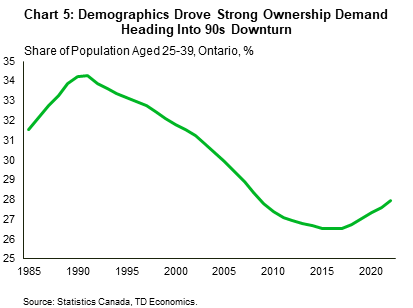
Back then, the demographics of the country would’ve pointed to a robust demand for ownership housing, as about a third of Canada’s population was aged between 25 and 39. This is the age cohort where demand this type of housing has historically risen the most. In contrast, that share was 28% in 2022 (Chart 5). However, one could argue that these demographics played a role in the 90s downturn, with demographically driven demand for housing creating the fuel necessary to drive the speculative activity that took place.
Investor Activity: In terms of comparing the 90s housing downturn to now, data limitations make this a major grey area. According to the Bank of Canada, during the 1970s and 1980s, many Canadians wanted to protect themselves from high inflation in part through investing in real estate, while others sought to benefit from it through speculating in real estate2. Investor activity was therefore crucial in inflating the real estate bubble that existed at the time. The surge in homebuilding accompanying this activity, coupled with a steep economic downturn meant that the level of completed units left sold was historically elevated for several years, downwardly pressuring prices.
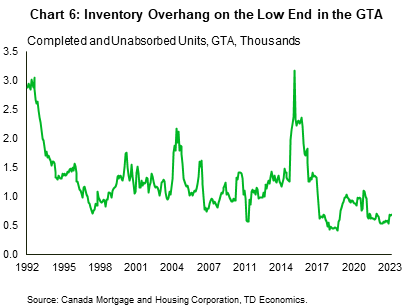
An elevated investor presence is also a hallmark of the current cycle, accounting for 30% of home purchases across Canada in the first quarter of this year (a record spanning back to 2014). Unfortunately, data on investor activity in the earlier period is lacking, so a direct comparison is not possible. Anecdotally, we do know that higher interest rates have brought difficulties to the pre-construction market during this cycle by making it more tough for buyers to close on properties they’ve previously purchased. Data we do have on hand for the new home market suggests that the level of completed and unsold inventories is nowhere near as high as it was during the 90s housing downturn (Chart 6). The relatively low level of this inventory measure does offer some comfort against the notion of sustained weakness in housing. However, this data could be understating the difficulties in the pre-construction space because it counts pre-sold units as “absorbed” and these are precisely the type of units which are facing some difficulties now.
Bottom Line
In coming months, conditions in Ontario’s housing market could loosen to those last seen during the depths of the severe and prolonged 90s housing downturn. Fortunately, there are good reasons to believe that a repeat of this extreme outcome is improbable, including the likelihood that Ontario will avoid a steep recession and the potential for a more favourable path for interest rates. What’s more, Ontario is in the grips of a housing shortage and population growth continues to be robust. Finally, the market likely has considerable pent-up demand, with per capita sales levels hanging around historical lows.
In terms of comparing now to then, how the investor story plays out is the major wildcard. In the 90s downturn, speculative activity played an important role in fueling a real estate bubble that eventually popped. Data limitations prevent a direct comparison between the current and earlier period, although anecdotal information is troubling.
Even though a 90s’ style outcome is unlikely, Ontario’s home prices likely have further downside in coming months. Indeed, prices could fall around 10% from their third quarter level through the first half of next year. Elevated borrowing costs are pressuring demand and straining homeowners who are renewing their mortgages, likely pushing up supply to some degree. Homeowners will continue to face this pressure through at least 2025/26, when those that took out mortgages at ultra-cheap rates face a notable payment shock.
End Notes
- Thiessen, Gordon “Canada’s Economic Future: What Have We Learned from the 1990s?” January 22, 2001. Bank of Canada, https://www.bankofcanada.ca/2001/01/canada-economic-future-what-have-we-learned/. Transcript.
- ibid
Disclaimer
This report is provided by TD Economics. It is for informational and educational purposes only as of the date of writing, and may not be appropriate for other purposes. The views and opinions expressed may change at any time based on market or other conditions and may not come to pass. This material is not intended to be relied upon as investment advice or recommendations, does not constitute a solicitation to buy or sell securities and should not be considered specific legal, investment or tax advice. The report does not provide material information about the business and affairs of TD Bank Group and the members of TD Economics are not spokespersons for TD Bank Group with respect to its business and affairs. The information contained in this report has been drawn from sources believed to be reliable, but is not guaranteed to be accurate or complete. This report contains economic analysis and views, including about future economic and financial markets performance. These are based on certain assumptions and other factors, and are subject to inherent risks and uncertainties. The actual outcome may be materially different. The Toronto-Dominion Bank and its affiliates and related entities that comprise the TD Bank Group are not liable for any errors or omissions in the information, analysis or views contained in this report, or for any loss or damage suffered.
Download
Share: