2026 Nova Scotia Budget
Large Deficits, Higher Debt, and a Push for Fiscal Stability
Rishi Sondhi, Economist | 416-983-8806
Date Published: February 24, 2026
- Category:
- Canada
- Government Finance & Policy
Highlights
- Budget 2026 revealed that the deficit and debt pressures faced by Nova Scotia are intensifying. The Province is projecting its highest deficit since FY 2013/14 at 1.7% of GDP (about $1.2B) in FY 2026/27. Net debt, meanwhile, is expected to rise from 35% in FY 2025/26 to 39.4% of GDP this year and is forecast to breach 40% in the outer years.
- The plan largely builds on previously announced measures, focusing on healthcare, capital infrastructure, existing tax changes, and a new Fiscal Stability Plan aimed at slowing expense growth and improving public sector efficiency.
- Real GDP growth is expected to remain decent in Nova Scotia, while revenues rise a firm 5% this year; however, higher capital spending, climbing interest costs, and demographic pressures leave the province more exposed to fiscal and interest rate risks over the medium term.
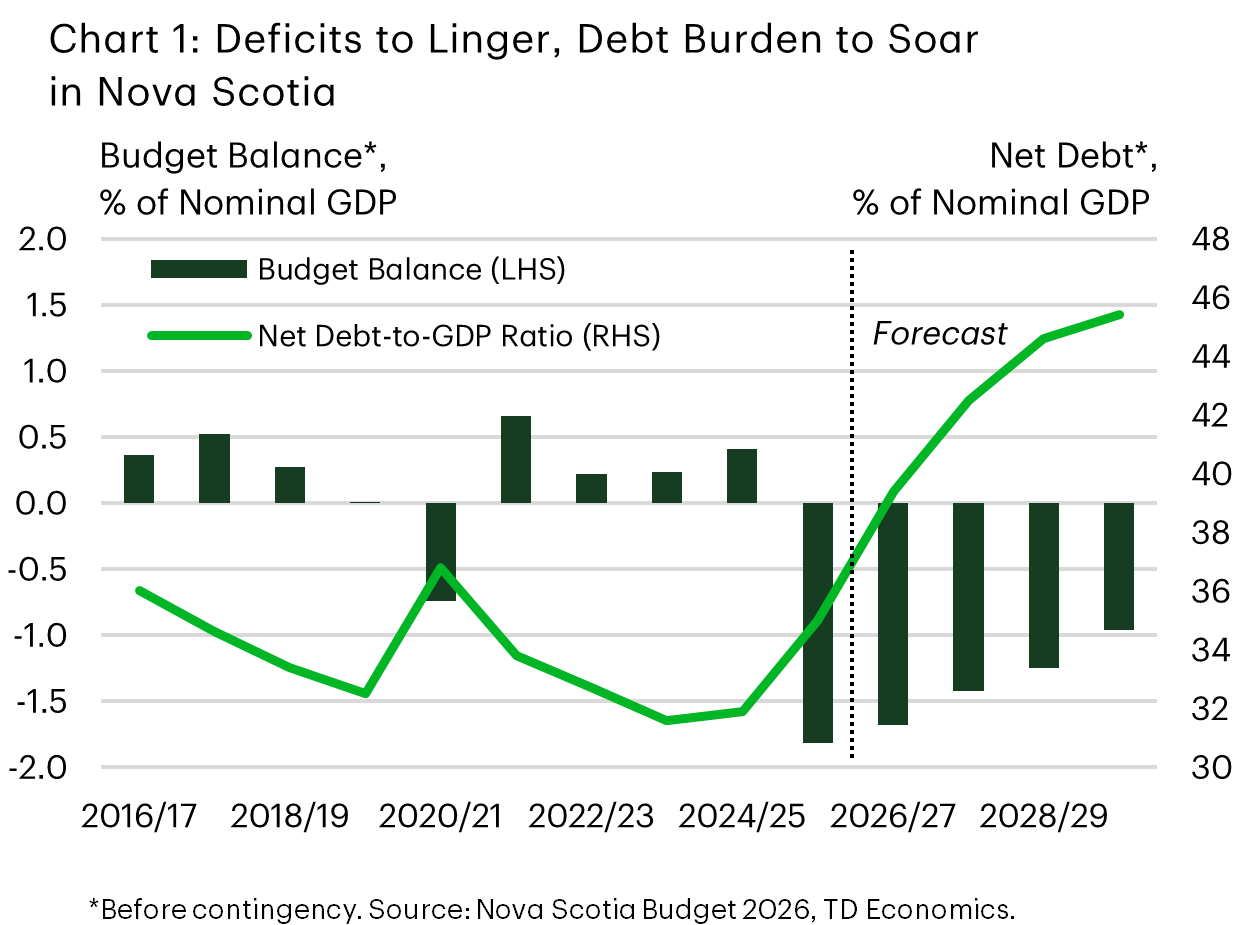
As a share of GDP, Nova Scotia is projecting its highest deficit since FY 2013/14 in the upcoming fiscal year (1.7 %). In dollar terms, the FY 2026/27 shortfall is pegged at $1.2 billion, matching the FY 2025/26 deficit. Amid this backdrop (and a recent credit rating downgrade) The Nova Scotia government is implementing a “Fiscal Stability Plan” aimed at slowing expense growth over the medium term and making headway on the deficit. Revenue growth is expected to be firm at 5% this year, aiding this effort. Net debt, meanwhile, is expected to reach 39.4% in FY 2026/27, up from 35.0% in FY 2025/26. It is forecast to climb thereafter, breaching 40% in the outer years of the forecast.
On the policy front, the budget largely builds on previously announced measures rather than introducing sweeping new initiatives. The focus remains on healthcare, capital infrastructure and tax measures already in place (such as the 1 ppt cut in the HST announced last budget).
Stable Economic Growth On Tap
The province sees real GDP growth remaining somewhat below the 1.8% rate estimated for 2025 over the medium term. For 2026 and 2027, a mild recovery in exports is expected to offset slower population growth, leaving GDP gains averaging 1.5%. This is a touch stronger than our own projections. Meanwhile, nominal GDP gains are expected to average about 3.6% in 2026 and 2027, consistent with our view. Yearly variations in the government’s economic growth projections relate to changes in major projects and investment activity.
The Province is expecting a perky 5% growth rate for revenues in FY 2026/27, driven by a combination of personal income tax growth, a higher HST intake, and rising federal transfers, particularly the Canada Health Transfer. Personal income tax revenues benefit from continued wage increases, though this is partially offset by the ongoing impact of indexation and enhanced basic personal amounts. HST revenues are supported by solid consumer spending and residential construction, even as population growth slows. Nova Scotia will be implementing a 2 ppt increase in the Financial Institutions Capital Tax, effective November 1st, 2026. This change is expected to bring in $40 million when fully implemented in FY 2027/28.
Nova Scotia Economic Assumptions
[ Percent change unless otherwise noted ]
| Budget 2026 | ||||||
| Calendar Year | 2025 | 2026 | 2027 | 2028 | 2029 | |
| Nominal GDP | 5.0 | 3.4 | 3.7 | 3.4 | 3.8 | |
| Real GDP | 1.8 | 1.5 | 1.5 | 1.4 | 2.0 | |
| Employment | 0.4 | 0.3 | 0.3 | - | - | |
| Labour Force | 0.5 | 0.3 | 0.3 | - | - | |
| Unemployment Rate (%) | 6.6 | 6.6 | 6.6 | - | - | |
| CPI | 2.1 | 2.0 | 2.0 | - | - | |
Expense Growth to Slow Markedly After This Fiscal Year
In FY 2026/27, total expenses are seen as increasing by 4%, as core services like healthcare and education see hefty gains. For the 3 years after, spending growth averages 2%, as the Province more fully implements its “Fiscal Stability Plan” spending reductions. The Plan focuses on stabilizing expense growth, reducing the size of the Public Service and improving productivity and efficiency government wide. The Plan is expected to bring in a cumulative $2.6 billion in savings from FY 2026/27 – FY 2029/30.
The Plan will also address the impact of the Long-Term Care Accounting Adjustment. Nova Scotia has revised how it accounts for financing of long-term care facilities, with funds provided by the government to service providers that were previously treated as loans now considered capital assets. The upshot of this change is that deficits and net debt are mechanically raised. The FY 2026/27 impact of the accounting change is to reduce interest revenue by $71 million (0.4% of total revenues), and bump up net debt by $898 million (3.2% of the overall stock).
Debt Burden to Surge
Net debt-to-GDP is forecast to jump from last year’s estimated 35.0% to 39.4% the upcoming fiscal year (excluding the boost to the ratio from the contingency fund). This would place the Province on the higher end of provincial debt loads. Thereafter, the debt burden is projected to climb well over the 40% level that the provincial government uses as a planning guardrail. In fairness, part of the increase in the debt burden can be explained by the new accounting rules governing long-term care facilities. However, even absent this impact, the debt burden is still expected to rise above 40% by FY 2028/29.
Nova Scotia’s FY 2026/27 borrowing program totals roughly $3.4 billion, reflecting not only operating deficits but also a very large capital plan. For the latter, a historic $3.5 billion capital plan is revealed in the budget, up from $2.4 billion the year prior.
Debt servicing costs rise to just over $1.0 billion this fiscal year, consuming about 5.9% of revenues, and this so-called “interest bite” is forecast to climb to 7.6% by FY 2029/30.
Bottom Line
Budget 2026 represents a step towards reining in the province’s operating budget shortfall. While maintaining an investment in core services, the plan leans on slim program spending gains over several years, which could be challenged by Nova Scotia’s relatively old population and the potential for weaker-than-expected revenue growth amid an uncertain economic backdrop. The spending plan could also slow overall economic growth in the near-term.
The Province’s capital spending plan is robust, possibly offering some offset to its operating plan (while also potentially raising longer-term productivity). However, it should also add to fiscal pressures. Note that, over the projection horizon, the government’s net debt-to-GDP ratio is slated to reach its highest level since FY 2000/01.
Accordingly, interest costs as a share of revenues are forecast to climb over the medium term. Although they are expected to remain well shy of the threatening levels observed in early 90s to early 2000s, it leaves Nova Scotia more exposed to interest rate shocks than in the past and raises the risk of a crowding out in other spending.
Nova Scotia Government Fiscal Position
[ Millions of C$ unless otherwise indicated ]
| Fiscal Year | 2025-26 | 2026-27 | 2027-28 | 2028-29 | 2029-30 | |
| Forecast | Estimate | Estimate | Estimate | Estimate | ||
| Revenues | 16,594 | 17,354 | 17,669 | 18,352 | 19,076 | |
| % Change | -3.4 | 4.6 | 1.8 | 3.9 | 3.9 | |
| Expenses | 18,170 | 18,932 | 19,103 | 19,683 | 20,210 | |
| % Change | 5.2 | 4.2 | 0.9 | 3.0 | 2.7 | |
| Consolidation/Accounting Adjustments | 327 | 387 | 387 | 380 | 375 | |
| Surplus (+) / Deficit (-) | ||||||
| Provincial Surplus (Deficit) - Before Contingency | -1,249 | -1,191 | -1,047 | -950 | -760 | |
| Contingency | -50 | -50 | -50 | -50 | ||
| Provincial Surplus (Deficit) - After Contingency | 82 | -1,241 | -1,097 | -1,000 | -810 | |
| Net Debt | ||||||
| Net Debt - Before Contingency | 24,030 | 27,945 | 31,306 | 33,947 | 35,911 | |
| % of GDP | 35% | 39% | 43% | 45% | 45% | |
| Net Debt - After Contingency | 24,030 | 27,995 | 31,406 | 34,097 | 36,111 | |
| % of GDP | 35% | 40% | 43% | 45% | 46% | |
Disclaimer
This report is provided by TD Economics. It is for informational and educational purposes only as of the date of writing, and may not be appropriate for other purposes. The views and opinions expressed may change at any time based on market or other conditions and may not come to pass. This material is not intended to be relied upon as investment advice or recommendations, does not constitute a solicitation to buy or sell securities and should not be considered specific legal, investment or tax advice. The report does not provide material information about the business and affairs of TD Bank Group and the members of TD Economics are not spokespersons for TD Bank Group with respect to its business and affairs. The information contained in this report has been drawn from sources believed to be reliable, but is not guaranteed to be accurate or complete. This report contains economic analysis and views, including about future economic and financial markets performance. These are based on certain assumptions and other factors, and are subject to inherent risks and uncertainties. The actual outcome may be materially different. The Toronto-Dominion Bank and its affiliates and related entities that comprise the TD Bank Group are not liable for any errors or omissions in the information, analysis or views contained in this report, or for any loss or damage suffered.
Download
Share: