2026 Newfoundland and Labrador Budget
Affordability Before Balance
Marc Ercolao, Economist | 416-983-0686
Date Published: April 29, 2026
- Category:
- Canada
- Government Finance & Policy
Highlights
- Newfoundland and Labrador tabled a budget that keeps the province in moderate deficit territory for the next five years.
- Despite a projected decline in net debt-to-GDP to 43.4% in FY 2026/27, the government is still the most indebted across provinces.
- The fiscal plan incorporates conservative oil price assumptions that leave room for revenue upside.
- Budget measures focused on cost of living relief and modest tax reductions, limiting near term fiscal improvement but providing support to households amid elevated prices.
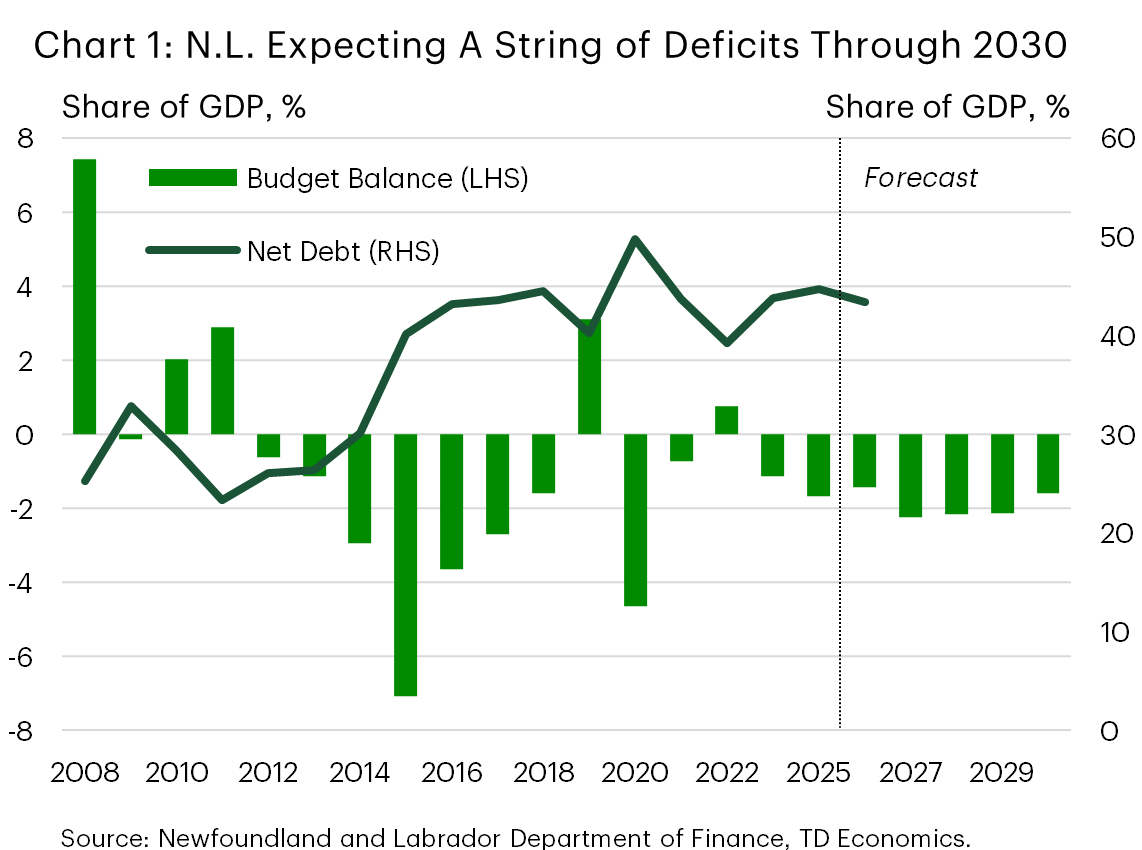
Newfoundland and Labrador’s (N.L.) 2026 budget projects a deficit of $688 million in FY 2026/27 (or 1.4% of GDP), extending the province’s three-year run of red ink. Importantly, the province does not forecast a path to balance. Budget deficits widen to over 2% of GDP over the next couple of years before settling at current levels by 2030.
The budget was also tabled against a deteriorated starting point relative to the prior budget, with a FY 2025/26 deficit of $729 million, the deepest shortfall since FY 2020/21. Rather than leaning on sharp expenditure restraint, the plan focuses on maintaining core public services and supporting household affordability.
Economic and Revenue Assumptions Face Upside Risk
The N.L. government projects real GDP growth of roughly 5.5% in 2026, up from 4.8% last year. While nominal GDP growth of about 10% comes in meaningfully stronger than our forecast, revenue growth is expected to slow to a modest 1.5% in FY 2026/27. This partly reflects cautious underlying assumptions, particularly for oil prices. The budget embeds a Brent crude forecast of US$79/bbl in 2026, which is conservative relative to our outlook, but still somewhat firmer than assumptions used by other commodity producing provinces. Oil prices are then assumed to ease into the low US$70s over the following two years, further limiting revenue upside. Should our oil price outlook materialize, and based on the province’s revenue sensitivities, offshore royalty revenues could face upside of over $400 million over the next two years. A $175 million risk adjustment and contingency reserve also remain in place, helping to cushion downside risks to revenues.
Spending Growth Restrained, Though Pressures Persist
On the expenditure side, the budget holds total spending growth to 1.1% in FY 2026/27, well below nominal GDP growth and implying restraint in real per capita terms. This follows a much more robust 7.0% spending growth last year. Health care remains the dominant driver of spending, accounting for over 40% of outlays.
Consistent with campaign commitments, Budget 2026 places a strong emphasis on affordability measures. Key initiatives include increasing the basic personal amount to $15,000 from $11,100, increasing the seniors’ benefit by 20%, expanding the N.L. child benefit, and reducing the small business tax rate by 0.5% per year for the next three years. These measures provide near term household relief will also weigh on the government’s bottom line.
Meanwhile, the government significantly scaled back its capital investment forecast. Relative to last year’s budget, cumulative capital investment by the year 2029 will be almost $30 billion lower. Notably, capital spending is expected to fall by 2.6% after a 15% drop in 2025.
Newfoundland & Labrador Economic Assumptions
[ Per cent change unless otherwise noted ]
| Fiscal Year | 2026 | 2027 |
| Real GDP | 5.5 | 3.9 |
| Nominal GDP | 10.0 | 1.7 |
| Unemployment Rate (%) | 9.9 | 9.4 |
| Retail Sales | 3.1 | 2.5 |
| Employment | 0.2 | 1.6 |
| Population | 0.0 | 0.4 |
| 2026-27 | ||
| Exchange Rate (CAD/USD) | 0.74 | |
| Brent Price ($US per Barrel) | 79.0 |
Debt Dynamics and the Use of Fiscal Flexibility
N.L. plans to borrow $3.9 billion this fiscal year, of which $2.9 billion represents a net new funding requirement. The remainder is for debt maturity pre-borrowing and increased liquidity needs. All in, this figure is lower than the $4.1 billion in gross requirements this past fiscal year. Increased borrowing and current deficits are driving the stock of net debt to a projected $20.8 billion in FY 2026/27. Despite the increase, debt as a share of GDP is expected to fall modestly (by 1.3 ppts) to 43.4% in FY 2026/27 given a solid nominal GDP projection. While the debt ratio has stabilized over the last two years, it represents the highest burden across Canada’s provinces.
Bottom Line
N.L.’s budget leans toward affordability support over near term fiscal repair, keeping the province firmly in deficit territory through the forecast horizon. While debt dynamics are slated to improve modestly in FY 2026/27 on the back of stronger nominal GDP growth, the province will likely remain Canada’s most indebted, with no clear path back to balance. Notably, conservative oil price assumptions and sizable contingencies provide some protection against downside risks – and leave room for upside – leaving the fiscal outlook still highly sensitive to energy market developments.
Newfoundland & Labrador Fiscal Position
[ C$ millions, unless otherwise noted ]
| Fiscal Year | 25-26 | 26-27 | 27-28 | 28-29 | 29-30 | 30-31 |
| Revenue | 10,677 | 10,838 | 10,459 | 10,578 | 10,863 | 11,233 |
| % Change | - | 1.5% | -3.5% | 1.1% | 2.7% | 3.4% |
| Expenses | 11,406 | 11,526 | 11,554 | 11,680 | 11,975 | 12,068 |
| % Change | - | 1.1% | 0.2% | 1.1% | 2.5% | 0.8% |
| Surplus (+)/Deficit (-) | -729 | -688 | -1,095 | -1,102 | -1,112 | -835 |
| % of GDP | -1.7% | -1.4% | -2.2% | -2.2% | -2.1% | -1.6% |
| Net Debt | 19,500 | 20,800 | ||||
| % of GDP | 44.7% | 43.4% |
Disclaimer
This report is provided by TD Economics. It is for informational and educational purposes only as of the date of writing, and may not be appropriate for other purposes. The views and opinions expressed may change at any time based on market or other conditions and may not come to pass. This material is not intended to be relied upon as investment advice or recommendations, does not constitute a solicitation to buy or sell securities and should not be considered specific legal, investment or tax advice. The report does not provide material information about the business and affairs of TD Bank Group and the members of TD Economics are not spokespersons for TD Bank Group with respect to its business and affairs. The information contained in this report has been drawn from sources believed to be reliable, but is not guaranteed to be accurate or complete. This report contains economic analysis and views, including about future economic and financial markets performance. These are based on certain assumptions and other factors, and are subject to inherent risks and uncertainties. The actual outcome may be materially different. The Toronto-Dominion Bank and its affiliates and related entities that comprise the TD Bank Group are not liable for any errors or omissions in the information, analysis or views contained in this report, or for any loss or damage suffered.
Download
Share: