Don’t Let History Repeat:
Canada’s Energy Sector Transition and the Potential Impact on Workers
Beata Caranci, Senior Vice President & Chief Economist
Francis Fong, Managing Director & Senior Economist
Research assistance provided by: Yasmine El Baba, Research Analyst
Date Published: April 6, 2021
Executive Summary
The Canadian federal government’s recently updated climate strategy sets an important new target for greenhouse gas emissions reductions. By 2030, the plan is to reduce emissions by 32-40%, with a goal to be completely emissions neutral in 2050. Both commitments are critical to avoid the worst outcomes of climate change. However, achieving this magnitude of emissions reduction will require significant action.
The elephant in the room for Canada is that any climate change policy must come to terms with the outsized impact from carbon-intensive industries in the energy sector, specifically oil & gas. The extraction and distribution of oil & gas accounts for more than one-quarter of all of Canada’s GHG emissions, making it a prime target for reduction efforts.
This will come in two forms. The first is reducing overall dependence on burning fossil fuels for energy. Oil & gas account for nearly two-thirds of Canada’s primary energy demand, so reducing the carbon footprint implies a fundamental shift towards electrification, renewable electricity and clean fuels. The second will be in reducing the emissions intensity of the sector through technological innovation. In net zero scenarios, fossil fuel demand does not disappear entirely, but its ongoing viability will be determined by the industry’s ability to sequester emissions in all its forms.
Scenario projections that are consistent with reaching the net zero target show that demand for oil & gas in North America would likely need to fall by half, with production falling commensurately. According to Natural Resources Canada, roughly 600,000 Canadians, located mostly in Alberta, Saskatchewan, and Newfoundland and Labrador are either directly or indirectly employed in the oil & gas sector. We estimate between 50-75% of those workers are at risk of displacement in the transition through 2050, equivalent to 312,000 – 450,000 workers.
The belief is that many of those displaced will find a home in the clean energy sector, but we should not assume that the transition will absorb all displaced workers. The experience of both the U.S. and Canadian manufacturing sectors in the 1990s through to the early-2000s offers a cautionary tale. At that time, automation and skill-biased technological change led to a decline in manual, routine jobs across the economy. This led to widespread displacement of middle-skilled, middle-income workers. There was not a smooth transition into the modern economy, partly due to the formation of new jobs occurring in sectors and geographical locations that differed from the areas of those that were displaced. Relative to the U.S., Canada was spared some of the hollowing out of middle-income jobs and resulting inequality due to the presence of energy sector jobs. However, this is now about to change.
It is critical that we do not repeat the mistakes of the past and ensure a just transition for energy sector workers. We recommend that Canada’s just transition policy framework have three main elements:
- A redesigned retraining/upskilling framework that complements the Canada Training Benefit by working with industry and training service providers to identify and document the taxonomy of skills needed in the clean energy sector, focusing on better linkages between stakeholders and standardization in programming. Program outcomes should also be made transparent and align with labour market information.
- To the extent possible, focusing clean energy infrastructure and development within the same communities that will bear the brunt of the energy transition.
- Broad-based income supports that can partially offset income losses due to displacement, including specific supports for older workers, such as pension bridging grants.
The clean energy transition represents an enormous economic and social opportunity to redefine and reinvigorate Canada’s energy sector. Companies are already uniquely positioned to reorient and become global leaders in new energy opportunities due to their existing capabilities around major projects, governance and large-scale delivery. However, history has shown that natural unintended dynamics can press on inequality and underemployment if market forces are left unchecked. Efforts and resources on the clean energy transition should be matched by efforts and resources to transition workers displaced in the process.
Highlights
- Canada’s transition to a low carbon economy will have a significant economic impact on the oil & gas sector. We estimate it could displace between 312,000-450,000 workers over the next three decades.
- The structural decline in the fossil fuel industries evokes the memory of the manufacturing sector decline through the 1990s and early-2000s, where automation and a skill-biased technological shift permanently displaced middle-skilled, middle-income jobs.
- The clean-energy transition will create many new job opportunities, but there is no guarantee or automatic market mechanism to ensure these benefits accrue to where the costs will be borne on the displacement. This report lays out a framework to promote a just transition for workers.
Introduction

With the federal government’s recent commitment to reducing greenhouse gas emissions to net zero by 2050, Canada’s oil & gas industry will face a seismic shift. Fossil fuel usage will need to fall precipitously from current levels. In turn, hundreds of thousands of oil & gas workers could be displaced either directly or indirectly, as production falls alongside demand.
This kind of structural shift evokes memories of the manufacturing sector’s decline of the 1990s and early-2000s. Widespread automation displaced middle-skilled, middle-income workers across the country, with the economic consequences still being felt today. The oil & gas sector is now looking down the barrel of a similar shift and Canada cannot afford to make the same policy mistakes. The energy sector has historically played a critical role in Canada’s social and economic progress. It is incumbent on government and policymakers to establish a transition framework to help those facing job displacement avoid permanently joining the ranks of the unemployed or underemployed.
We estimate that between 50-75% of current oil & gas sector workers could be displaced in the clean energy transition, representing 312,000 to 450,000 jobs. With this level of dislocation, policies aimed at ensuring a just transition will be critical. These should include a focus on communities that will be most impacted, with income supports and a revamped upskilling framework that takes into consideration the shift in skills and geographical backdrop that will likely occur due to the transition.
Canada’s Net Zero Target
The Federal government’s recently updated climate plani encapsulates a necessary urgency by setting an aggressive new target for emissions reductions over the next three decades. Canada’s original 2016 commitment aligned with the Paris Climate Agreement – namely, a 30% reduction in greenhouse gas (GHG) emissions below 2005 levels by 2030. The new commitment puts forward a target of between 32% to 40% below 2005 levels by the same timeframe (Chart 1). In addition, Canada has also committed to becoming completely emissions neutral by 2050, joining the likes of the UK, the EU, Japan, and South Korea. More recently, the U.S. and China joined the call. Repeated statements by President Biden call on the need for America to reach net zero by 2050, while China formally committed to becoming net zero by 2060. This is a target that the scientific community cites as being consistent with keeping the increase in global average surface temperatures to well below 2°C by 2100, thus avoiding the worst consequences of climate change.
These commitments can only be achieved with significant action. In Canada, this has led to an intention to increase the price of carbon to $170 per tonne by 2030 and a modification to clean fuel standards. In addition, the federal government’s updated climate plan builds on the 2016 Pan Canadian Framework on Clean Growth and Climate Change by ensuring all industries are included in emission reductions efforts.
Between the two plans, the government has clear targets it hopes to reach along the path of decarbonization, such as increasing the share of electricity production from non-emitting sources to 90% by 2030 and increasing the share of zero-emissions passenger vehicle sales to 90% by 2040ii. However, there’s still a lot of thought-evolution that will need to occur. Other areas contain less prescriptive commitments, such as decarbonizing freight and air transportation, producing and using cleaner fuels in heavy industry, and retrofitting residential and commercial buildings that burn fossil fuels for heating. Regardless of the specificity of the target itself, every one of these transitions must occur to achieve success in the overarching goal on emissions reductions.
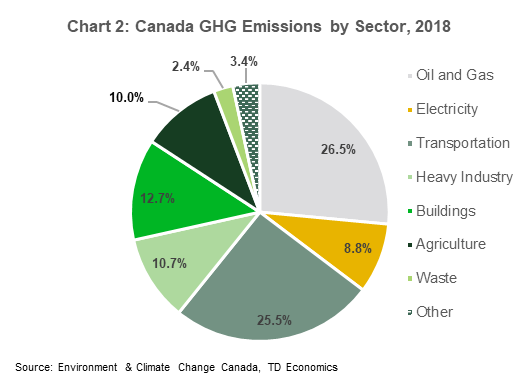
The elephant in the room for Canada is that climate change policy must come to terms with the dominant impact from carbon-intensive industries in the energy sector, specifically oil & gas. The extraction and distribution of oil & gas accounted for 26.5% of all of Canada’s GHG emissions in 2018 (Chart 2). In fact, this figure is an understatement since it does not include any additional emissions that occur downstream in industries directly linked to the sector. Among these are petroleum and gas-fired electricity generation and heavy manufacturing that use oil & gas and byproducts as feedstocks. This makes the sector a prime target for emissions reduction efforts. Not surprisingly, then, the federal government’s updated plan forecasts that oil & gas emissions will fall by roughly half by 2030.
The Oil & Gas Transition
Achieving that level of emissions reductions will require significant effort along two separate axes.
- A demand-side transition away from fossil fuel usage
- A technological shift within the oil & gas industry to lower emissions intensity
In terms of demand, oil & gas represented the source of nearly two-thirds of Canada’s primary energy consumption in 2019iii – from the gasoline and jet fuels used in everyday transportation, to the natural gas burned in heavy industry, homes and commercial buildings. Decarbonizing the sector implies the need to decarbonize everyday activities across households and businesses. This is why government policies are trying to incent a shift in demand to renewables, zero-emissions vehicles and clean fuels.
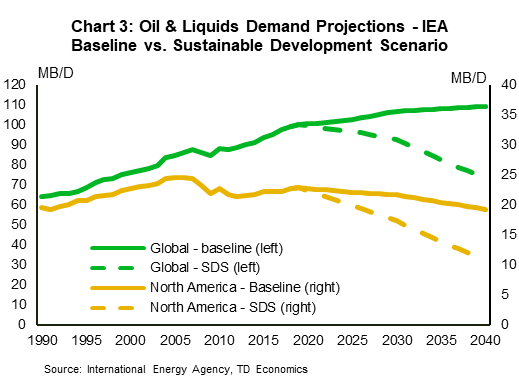
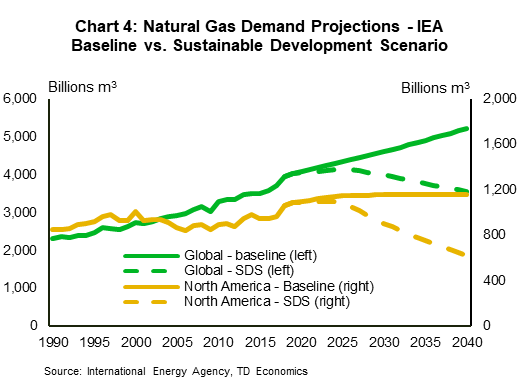
To detail the scope of this shift, the International Energy Agency’s (IEA) Sustainable Development Scenario (SDS) features the required drop in oil and gas demand at both the global and North American levels under the assumption that policies are successful in curbing demand. In North America, crude oil and natural gas liquids consumption is projected to fall by more than 51% between 2019 and 2040, while natural gas consumption falls by nearly 43%. Globally, the decline is smaller, as the scenario does not assume efforts to reduce emissions in emerging markets (EMs) will be as aggressive. Oil and gas demand fall by 26% and 12%, respectively, by 2040 (Charts 3 and 4). The analysis on EMs includes China, but it was conducted prior to their announced commitment towards net zero by 2060. However, given the much longer timeframe, it would unlikely materially move the dial for advanced economies.
In this scenario analysis, it is important to note that fossil fuel demand does not disappear entirely in the transition to a net zero world. Oil & gas byproducts and related manufactures for which there may not be viable or scalable alternatives will require some production to continue. In addition, clean fuels, like hydrogen or methane, can be extracted from them. In fact, the Canadian federal government’s updated climate plan includes a hydrogen strategy that strongly considers the use of blue hydrogeniv. This is extracted from fossil fuels, with emissions along the entire value chain sequestered, in order to replace the direct burning of fossil fuels.
Some fossil fuels may also be needed for both firm electricity generation and risk management. This would reflect capacity that can be produced on demand, at any time of the year, regardless of weather conditions. Recent extreme weather events in Texas highlight the importance of maintaining appropriate contingency planning for all circumstances.

However, both propositions are entirely dependent on the viability and scalability of technologies to sequester emissions, like carbon capture, utilization and storage (CCUS), from the extraction of fossil fuels and during the subsequent production of clean fuels or electricity. Technologies like CCUS will be critical in ensuring the ongoing viability of the oil & gas sector in Canada in order to align with climate change policies. This will be a challenge. The level of per barrel emissions in Alberta’s oil sands has already fallen by more than 20% between 2011 and 2019v. Yet, little progress has been made in aggregate. According to Natural Resources Canada (NRCan), the overall emissions intensity of the upstream mining sector (which includes oil & gas extraction) has remained relatively constant since the late-1990s (Chart 5), owing largely to growing production biasing towards higher-emitting sources.
Potential Energy Worker Impacts
The evolution of oil & gas production in Canada will thus be a function of the intertwined transitions in demand and technological advances. The combination will impart a significant impact on the livelihoods of those employed in the sector.
According to NRCan, the oil & gas sector employed almost 600,000 Canadians in 2019. Scenario projections suggest that many of those workers will likely be displaced by the clean energy transition. According to the IEA’s sustainable development scenario, North American oil production is projected to fall by roughly one-third and natural gas production by more than half. Notionally, employment might follow a similar path, but there are additional considerations.
Perfectly mirroring production and employment declines, particularly at a continental level, would assume that the capital-to-labour ratio remains constant through 2050 and that Canada maintains its share of North American production. This would be a poor assumption. The U.S. has gained tremendous market share in North America since the shale boom began in the mid-2000s. Moreover, 70% of those 600,000 jobs in Canada are in downstream industries related to refining, manufacturing, and construction. These might evolve along a completely different path from extraction and distribution.
For illustrative purposes, Net Zero America is a project from Princeton University that maps out a series of possible scenarios for how the U.S. can reach net zero by 2050. They forecast that downstream employment in the oil & gas sector could fall by between 50% and 95%, depending on the chosen path. Applying these estimates for Canada, we estimate that employment within the oil & gas sector could fall by between 312,000 to 450,000 by 2050, or in a range of between 50-75%.

These losses will not be evenly felt across the country. Alberta, Saskatchewan, and Newfoundland & Labrador account for nearly two-thirds of mining, oil, and gas employment (Chart 6) – not surprising, considering that the three account for 97% of all crude oil production and two-thirds of all natural gas production in the country.
The common counterargument to ease the economic pain is that net zero scenarios also forecast significant net positive growth for employment in the energy sector. This is due mainly to offsetting growth in the renewables sector, which generally has a lower capital-to-labour ratio than oil & gas – at least at the out start as the infrastructure is being established. And, there may be additional offsets within the oil & gas sector itself with projects such as orphan site restoration and other land restoration initiatives. Alberta, for example, has over 160,000 active wells and nearly 170,000 inactive or abandoned wells that will need to decommissioned and sites restoredvi. This comes on top of the nearly 11,000 orphan sites already needing decommissioning or reclamationvii. So when all the transition impacts are accounted for, Net Zero America estimates that the share of the labour force that will be dedicated to the energy sector will actually grow from 1.5% of the total labour market today to between 2-4.5% by 2050.
History Offers a Cautionary Tale
However, this relatively sanguine view of the impacts on energy-sector workers assumes a smooth transition of displaced workers from carbon-intensive energy jobs to clean ones. This will occur to some degree, but there will be significant frictions that could leave many workers in the lurch. First, the skills needed along the entirety of this new value chain are likely to be different. Second, clean energy jobs in the future will likely be more geographically dispersed than the energy jobs of today, simply because deriving energy from renewables is not necessarily beholden to the geographic location of natural deposits of fossil fuels.
This combination of a structural employment decline in a broad sector and a mismatch of skills needed in a transition evokes the manufacturing sector experience in Canada and the U.S. between the 1980s through to the early-2000s, the economic consequences of which are still being felt today. A well-established body of literatureviii on the issue discusses how skill-biased technological change over that time led to a “hollowing out” of the labour market as manual, routine jobs across the economy became automated. In turn, this led to a relative decline in middle-skilled, middle-income jobs, pushing the labour market to polarize as workers concentrated at either the low end or the high end of the skills curve over time (Chart 7).


Though this occurred across several industries, the manufacturing sector was considered ground zero given the higher proportion of jobs that were vulnerable to automation. In both Canada and the U.S., the manufacturing share of total employment has fallen by more than half since 1980 (Chart 8). In absolute terms, the number of manufacturing jobs in Canada peaked in 2002 and fell by nearly 625,000 by 2010, before flatlining. In the U.S., employment in the sector fell by nearly 6.2 million between 1998 and 2010.

Going beyond employment figures, Autor and Dorn (2013)ix also show a similar profile for U.S. wage growth . Higher growth occurred in both lower and higher-skilled occupations between 1980 and 2005 relative to those in the middle, with a more notable skew to the higher end. Indeed, according to the U.S. Census Bureau, the share of income going to the top 20% of households rose by 4.7 percentage points at the expense of the bottom 80%. The middle of the distribution saw the weakest income growth, thereby losing the largest share (Chart 9).
Canada’s Oil & Gas Sector Mitigated Labour Market Polarization
Canada was able to skirt the U.S. experience of wage polarization in part because of the growth of the energy sector since around 2000. While manufacturing jobs were being shed, the oil & gas sector was booming due to the global rise in commodity prices that raised the viability of natural gas and heavy crude projects. This development offset the impact of skill-biased technological change on certain middle-skilled manufacturing jobs. Employment growth in oil & gas extraction and related support services rose by 71% and 103% between 2001 and 2014, respectively, heavily outpacing the rest of the economy prior to the most recent commodity price crash (Chart 10).
These jobs also tend to have higher wages and the rapid growth in the sector had important spillover effects on other low and middle-skilled industries (Chart 11).


Indeed, Green and Sand (2015)x show that the level of labour market polarization experienced in Canada was less than that recorded in the U.S., while Fortin and Lemieux (2015) show that a combination of increases to the minimum wage and the growth of the extractive resources sector in Newfoundland & Labrador, Alberta, and Saskatchewan after 2000 contributed significantly to keeping inequality in check. The Gini coefficient in Canada has thus remained flat since around 2001 compared with the U.S. where it has continued its upward trajectory (Chart 12).

These social impacts further magnify the historical economic significance of the oil & gas sector in Canada. Keay (2007)xi estimates that the resource extraction sector, which naturally includes oil & gas, accounts for approximately 20% of the growth in Canada’s GDP per capita over the entirety of the 20th century. This is perhaps unsurprising given the prevalent role these sectors play in capital deepening. Despite accounting for just 5% of GDP, oil & gas extraction has consistently accounted for roughly one-quarter of all capital expenditures in Canada since 2001.
Clean Energy Transition Can Create Geographical Inequity
The risk of displacement of workers from high carbon to low carbon industries is further complicated by the current energy sector’s geographical concentration in Canada. There’s no guarantee or automatic market mechanism to ensure that the benefits of the clean energy transition accrue to where the employment costs will be borne.
There are already footprints forming within Canada’s energy transition. Ontario is currently home to over 40% of Canada’s wind capacity and 98% of solar capacityxii. Simultaneously, the province also imports all the crude oil used in its refineries to produce gasoline from Western Canada and the USxiii. To the extent that the transportation sector is successfully electrified, Ontario has a tremendous opportunity to grow its renewables sector by leveraging its existing infrastructure and expertise, which could imply a shift in how the province meets its energy needs away from Western Canada. This outcome is not guaranteed, as a multitude of factors will determine where clean energy sectors ultimately develop and gain critical mass. However, it will be Canada’s moment of truth on whether the lessons learned from past economic transitions can be internalized for better outcomes.

Returning to our manufacturing parallel and the cautionary tale offered by the U.S., after its employment bottomed out in 2010, jobs did begin to return. However, those states that suffered the biggest manufacturing job losses were not necessarily the ones that regained them. Of the top states ranked by manufacturing job losses between 1990 and 2010 and job gains between 2010 and 2019, only Michigan straddles both worlds (Chart 13).
We are likely to see a geographical dispersion of energy sectors, given that provinces can notionally pursue clean energy projects independently. And, climate change policies actually encourage this outcome as each province seeks to develop low-carbon offsets to other local industries.
This, in turn, can lead to a geographic inequity in both the costs and benefits of the energy transition, particularly in an era where workers are far less likely to relocate for work than in the past. Recent research shows that the share of Canadians and Americans moving to other provinces for work has been on a structural decline since the 1970s, and fell to record lows following the financial crisis. Today, less than 1% of workers in Canada move for work each yearxiv, which is less than half the pace in the U.S. where it is also at a record low of between 2-2.5%xv. The pandemic and work-from-home experience with digital adoption may now offer some benefits on not requiring as much proximity to workplaces, but it’s far too early to know this outcome and should not be relied upon by policymakers as the main strategy.
And, taking this logic further, job creation could press completely in the other direction. If worker-proximity to corporate activity is indeed less relevant, the job creation benefits of the clean energy transition could bleed offshore to jurisdictions completely outside of Canada’s labour market. Part of the challenge of the transition is establishing the most efficient way to decarbonize among a wide range of possible pathways. Each of those pathways leverages different levels of electrification, clean fuels, and clean technology, in turn, requiring a slightly different set of infrastructure and supply chains. Without active and effective policies on firm creation alongside worker retraining and retention, Canada’s labour market may not fully benefit from the energy transition via the necessary supply chains that will fuel the move to net zero.
A Just Transition for Energy Sector Workers
The complexity described highlights the strong need for Canadian policymakers to support displaced energy sector workers. A disorderly transition creates a stronger impulse for job losses, geographic inequity and a deterioration in inequality. In turn, economic disenfranchisement can reduce public support for environmental policies over time.
A growing body of literature discusses what the nature of this support should be, referred to as a “just transition”. Firstly, it must be recognized that the costs of the transition will not be evenly felt across the country. Smaller communities heavily exposed to carbon-intensive industries will bear far more of the economic impact of the energy transition relative to larger, more diversified and services-oriented regions elsewhere in the country. Nationwide, oil & gas extraction represents just 1.5% of the labour force. However, in areas such as Fort McMurray or Cold Lake in Alberta, that share rises to as high as 25-30%, according to the 2016 Census. These communities also tend to be more dependent on single sectors or employers as primary income generators for the region. This means the downstream impacts of the clean energy transition will be far more devastating. As such, a just transition needs a localized policy framework aimed at addressing these impacts.
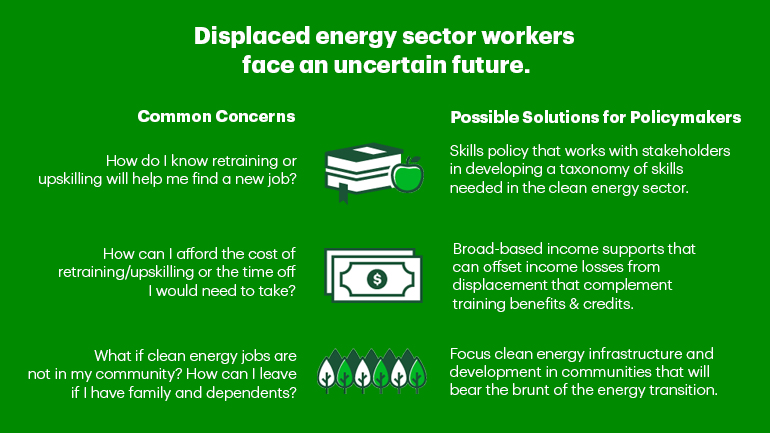
There have already been some attempts at developing such a policy framework in Canada. In 2019, the federal government launched the Task Force for a Just Transition for Canadian Coal Power Workers and Communities. Stakeholders suggested policies addressing two main concerns.
- The financial burden of transitioning, including uncertainty around future employment, lost income, potential moving expenses if re-employment occurs in another location, and specific concerns from older workers, such as pension losses.
- Challenges related to retraining/upskilling, including the financial burden and the lack of information on what skills will be needed or what jobs will be available.
Policymakers have a menu of options in addressing the financial aspect of the transition. In fact, in 2017, the Alberta government launched a transition program to help displaced coal workers after a series of federal and provincial policies aimed at curbing coal usage and mining led to a dramatic decline in the sector beginning in 2012xvi. These supports aligned with precisely what stakeholders were raising, including bridge grants for displaced workers seeking re-employment or skills training, reimbursement for moving expenses, as well as separate support for those near retirement.
The potential problem with financial supports, in isolation, is that they tend to have limited long-term positive impacts in helping workers cope with job displacement. The U.S., for example, provides workers displaced by trade policy with income supports and job training benefits through the Trade Adjustment Assistance program (TAA). A 2012 study conducted on the TAA showed that participants who only received income supports faced significantly lower employment rates and income levels relative to the control group after the 4-year observation period. Comparatively, those that received TAA-funded training in addition to income fared significantly betterxvii. In other words, income supports can be a useful tool in addressing short-term income loss, but the central component of a just transition policy should be those aimed at re-employing displaced workers – namely retraining and upskilling programs.
Canada’s patchwork of policies and supports leave much to be desired. First, the financial burden of retraining tends to fall on the individual and can often be a barrier to access. Government support programs are available, but few are aimed at those who are displaced. Federal-provincial job grants, for example, provide subsidies to employers who are looking to train existing employees, leaving those facing job losses out of the picture. The federal government’s recent introduction of the Canada Training Benefit does lower barriers to access somewhat by providing a lifetime grant of $5000 per Canadian through an individual skill account (ISA) and protecting job training leave through Employment Insurance. However, ISA’s may also prove insufficient if the retraining required is more significant, such as returning to post-secondary education for a multi-year degree. Additional education and income supports may be needed for those looking to make more significant career changes. The 2017 just transition framework in Alberta included a maximum of $12,000 in tuition vouchers for any post-secondary education and career training initiated within 5 years of layoff. Such measures could be considered in addition to the Canada Training Credit in order to establish a larger toolkit of retraining policies.
Funding model aside, Canada’s bigger challenge is in the consistency and relevancy of programming. Training and upskilling programs are currently delivered by a loose network of post-secondary education institutions, for-profit institutions, non-profit organizations, and labour groups, covering a wide range of possible career pathways and skillsets. Yet, these programs may overlap or lack standardization. Stakeholders in the federal task force on a just transition raised concerns that ranged from a lack of information on what programs were available to uncertainty as to whether participation will successfully lead to re-employment.
The evidence does support that the existing framework could be more effective. Chen & Morissette (2020, 2020)xviii,xix tracked the outcomes of coal workers displaced between 2004 and 2011 and oil & gas workers displaced between 2009 and 2011, showing a majority suffered material income losses one year after displacement. Among coal workers, the bottom 50% experienced at least a 32.4% drop in real income, while the bottom 25% suffered at least an 80.5% decline. Among oil & gas workers, those figures were 17.3% and 65.1%, respectively. Even five years later, income losses persisted for a significant share of displaced workers – the bottom 25%, for example, still had incomes 50-60% below their prior earning potential.
These results provide strong evidence that Canada needs a more comprehensive approach to retraining and upskilling, particularly from a program delivery perspective. As part of a just transition framework, retraining policy should be overhauled to focus on two key requirements:
- Better linkages between service providers and local employers to ensure the needs of employers are met.
- Standardization of programming across providers to ensure consistent quality across the country. Program outcomes, such as admissions, placement rates, program evaluations, etc., should also be made fully transparent and aligned with labour market information to provide participants with insights into potential career paths.
Singapore’s SkillsFuture program is often cited as a global leader in government-led upskilling/retraining initiatives. Like the Canada training benefit and job grants, Singapore’s program has both ISAs and employer subsidies to address funding concerns. But critical to the program’s success is the level of granularity with which it approaches skills needs. The government has created, with direct input from business, industry transformation maps for, so far, 32 different sectors. Within each sector, the program identifies all possible career pathways, the occupations/roles that fall under each pathway, critical work functions and tasks performed in the role and the skills needed to be successful in each task.
The work completed so far has already identified over 1700 different occupations across hundreds of career pathways and work is still ongoing. The importance of this level of granularity cannot be understated. It not only allows the identification of skill needs, but it also provides a baseline common understanding of the taxonomy of skills across the entire economy that workers, employers and training service providers can use. This, in turn, facilitates the standardization of programming in the same way schools standardize education curricula.
Since the program launched in 2015, it has seen enormous success. In 2019, the program saw an astounding 48.5% participation rate among working-age adults and survey results show that 86% of participants indicated that they were able to perform their work better after receiving trainingxx.
For speed and effectiveness, it is likely not necessary for Canada to fully replicate Singapore’s economy-wide model at this juncture. As a matter of priority, incorporating elements of the SkillsFuture program focused on mapping the transferable and transitional (up-skilled) skills that will be needed by energy sector workers can act as a significant stop-gap measure.
Three pillars to Canada’s just transition policy framework:
- A redesigned retraining/upskilling framework that complements the Canada Training Benefit by working with industry and training service providers to identify and document the taxonomy of skills needed in the clean energy sector.
- To the extent possible, focusing clean energy infrastructure and development within the same communities that will bear the brunt of the energy transition.
- Broad-based income supports that can partially offset income losses due to displacement, including specific supports for older workers, such as pension bridging grants.
Concluding Remarks
There can be no doubt that carbon-intensive industries like oil & gas are set to bear the brunt of the economic impact as Canada transitions to a low carbon economy. Efforts currently underway to shift the landscape of energy demand away from fossil fuels are expected to lower oil & gas consumption by between 40-50% in North America and we anticipate this could lead to a net displacement of 312,000 to 450,000 jobs in the sector through 2050.
With that level of job dislocation, there is an enormous need for policy to step up and ensure that workers can smoothly transition into the clean energy economy. That policy package should aim to minimize the potential dislocation by focusing the clean energy transition towards those communities that will be most impacted. For those that are displaced, policies focused on income support and job retraining and upskilling will be needed to help smooth the transition.
With regards to retraining and upskilling, Canada’s patchwork of policies leaves much to be desired. Workers currently have to navigate a complex web of programs delivered by a multitude of organizations and institutions with little foresight as to whether or not the skills gained actually align with what is needed. The first step in rethinking our nation’s retraining framework is establishing a taxonomy of skills that will be needed across the clean energy sector that takes into consideration input from industry, followed by a much-needed overhaul that simplifies program delivery and ensures that programming aligns with the needs of businesses. In addition, a critical part of the policy framework should be on longitudinal tracking of worker outcomes in order to establish whether or not efforts to address this problem have been successful and to make adjustments as needed, including job placement rates, income levels, length of training and unemployment, and satisfaction with programming. Measurement needs to be at the core of this framework in order to ensure transparency and accountability.
The clean energy transition represents an enormous economic opportunity to redefine and reinvigorate the Canadian energy sector and become established as a globally competitive leader in a net zero world. In fact, Canada’s energy sector is already well-positioned to lead the transition given the wealth of experience in infrastructure development, major project execution, governance, policymaking, and in capital markets. But, failure to ensure a just transition for workers risks repeating the mistakes of the past. Policymakers should not underestimate the structural shifts bearing down on oil and gas workers. A more innovative approach to labour market shifts should be considered and prioritized in parallel to climate emission targets as a means to mitigate negative unintended economic and social consequences.
{related-articles-row}
End Notes
- https://www.canada.ca/content/dam/eccc/documents/pdf/climate-change/climate-plan/healthy_environment_healthy_economy_plan.pdf
- http://publications.gc.ca/collections/collection_2020/eccc/En1-77-2019-eng.pdf
- BP Statistical Review of World Energy 2019. https://www.bp.com/en/global/corporate/energy-economics/statistical-review-of-world-energy.html
- https://www.nrcan.gc.ca/sites/nrcan/files/environment/hydrogen/NRCan_Hydrogen%20Strategy%20for%20Canada%20Dec%2015%202200%20clean_low_accessible.pdf
- https://open.alberta.ca/opendata/alberta-oil-sands-greenhouse-gas-emission-intensity-analysis
- https://www.alberta.ca/oil-and-gas-liabilities-management.aspx#:~:text=Quick%20facts,162%2C500%20active%20wells
- https://www.orphanwell.ca/about/orphan-inventory/
- Autor, David H., and David Dorn. 2013. “The Growth of Low-Skill Service Jobs and the Polarization of the US Labor Market.” American Economic Review, 103 (5): 1553-97.
- Ibid
- Green, D.A. and Sand, B.M. (2015), Has the Canadian labour market polarized?. Canadian Journal of Economics/Revue canadienne d’économique, 48: 612-646
- Keay, I. (2007). The Engine or the Caboose? Resource Industries and Twentieth-Century Canadian Economic Performance. The Journal of Economic History, 67(1), 1-32.
- https://www.cer-rec.gc.ca/en/data-analysis/energy-commodities/electricity/report/2017-canadian-adoption-renewable-power/canadas-adoption-renewable-power-sources-energy-market-analysis-solar.html
- https://www.cer-rec.gc.ca/en/data-analysis/energy-commodities/crude-oil-petroleum-products/report/2019-gasoline/index.html
- https://www150.statcan.gc.ca/n1/pub/11-626-x/11-626-x2017076-eng.htm
- https://www.brookings.edu/wp-content/uploads/2016/03/MolloyEtAl_DecliningFluidityLaborMarket_ConferenceDraft.pdf
- https://www.parklandinstitute.ca/albertas_coal_phaseout
- https://mathematica.org//our-publications-and-findings/publications/the-evaluation-of-the-trade-adjustment-assistance-program-a-synthesis-of-major-findings
- https://www150.statcan.gc.ca/n1/pub/11-626-x/11-626-x2020022-eng.htm
- https://www150.statcan.gc.ca/n1/pub/11-626-x/11-626-x2020021-eng.htm
- https://www.ssg-wsg.gov.sg/news-and-announcements/500-000-individuals-and-14-000-enterprises-benefitted-from-skill.html#:~:text=In%202019%2C%2086%20percent%20of,their%20work%20better%20after%20training
Disclaimer
This report is provided by TD Economics. It is for informational and educational purposes only as of the date of writing, and may not be appropriate for other purposes. The views and opinions expressed may change at any time based on market or other conditions and may not come to pass. This material is not intended to be relied upon as investment advice or recommendations, does not constitute a solicitation to buy or sell securities and should not be considered specific legal, investment or tax advice. The report does not provide material information about the business and affairs of TD Bank Group and the members of TD Economics are not spokespersons for TD Bank Group with respect to its business and affairs. The information contained in this report has been drawn from sources believed to be reliable, but is not guaranteed to be accurate or complete. This report contains economic analysis and views, including about future economic and financial markets performance. These are based on certain assumptions and other factors, and are subject to inherent risks and uncertainties. The actual outcome may be materially different. The Toronto-Dominion Bank and its affiliates and related entities that comprise the TD Bank Group are not liable for any errors or omissions in the information, analysis or views contained in this report, or for any loss or damage suffered.
Download
Share: