A Sober Second Look
Taking Stock of the Competitiveness of Canada’s Climate Policy Framework Relative to the U.S.
Francis Fong, Managing Director & Senior Economist
Date Published: April 24, 2023
- Category:
- Canada
- ESG
- Government Finance & Policy
Highlights
- Despite criticism, Canada’s financial support for the clean energy transition is yielding positive results and has established a competitive position relative to the U.S.
- TD Economics estimates a total of C$139 billion in total spending since budget 2021, or 5% of nominal GDP. This compares favourably to the U.S. Inflation Reduction Act’s (IRA) estimated US$393 billion in spending, or 1.5% of nominal GDP. The higher proportional outlays are likely a necessity for a small, open economy that needs to punch above its weight in order to compete for similar foreign investments relative to industrial powerhouses such as the U.S., Germany, and China, that historically are able to attract more capital and form centers of innovation.
- Canada has also tracked closely in key sectors. In the U.S., US$52 billion in EV and battery production announcements have occurred versus C$17.4 billion in Canada since the government’s climate policy framework began accelerating in 2021.
- Going forward, Canada’s competitiveness will be dependent on maintaining this investment momentum, but also in the development of lesser touched areas, such as skills development and expediting project assessments.
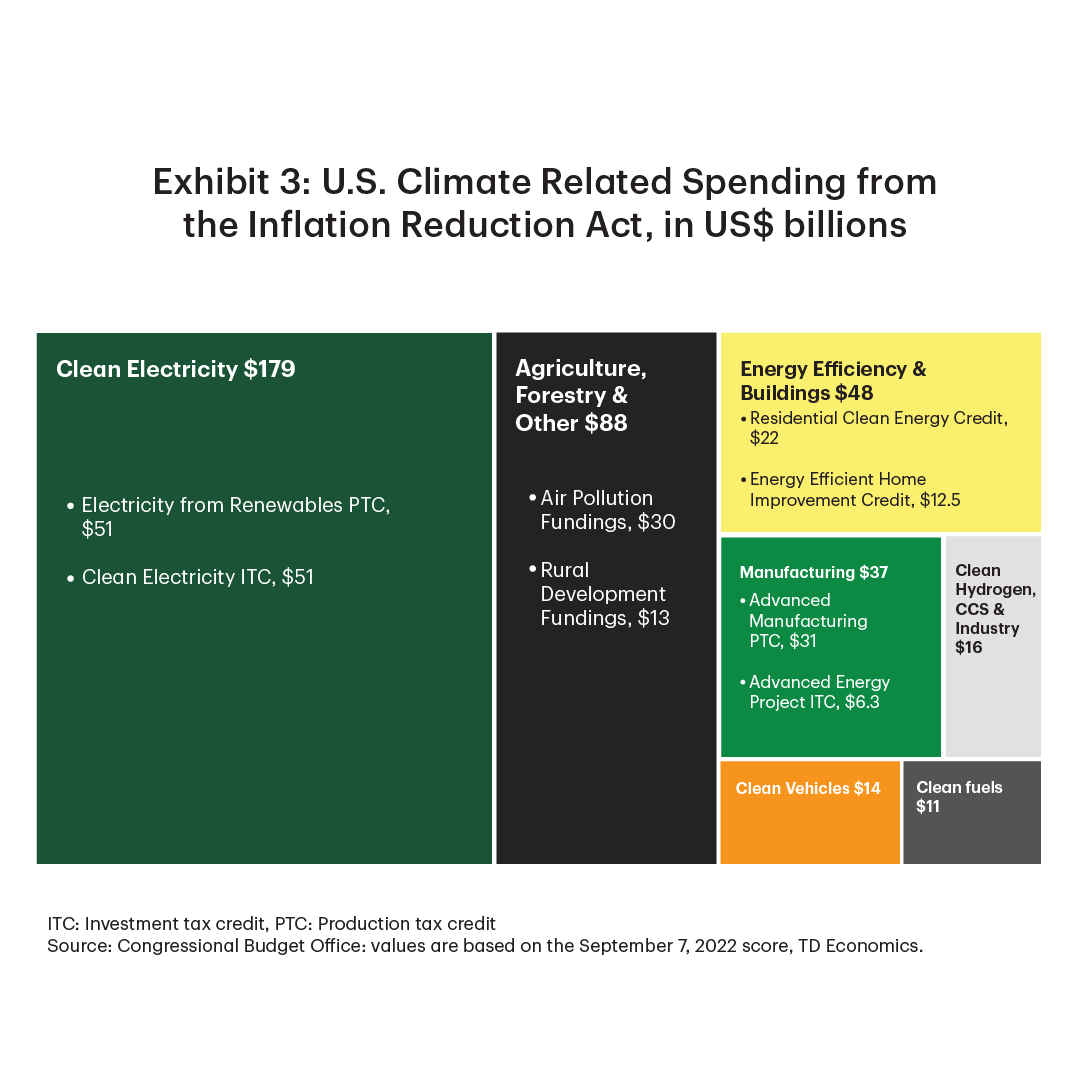
Heading into the Federal Budget, it had been an open question how the government would respond to the might of the clean energy components of the U.S. Inflation Reduction Act (IRA). The U.S. Congressional Budget Office (CBO) estimates the legislation to cost a whopping $393 billion, with actual spending likely surpassing that amount given that the IRA’s uncapped investment and production tax credits now acting as a gravity well for investment in clean energy, technology, and manufacturing.
However, Canada’s investment strategy is not quite as simple as treating clean energy investments as a zero-sum game and competing to offer the biggest subsidy. There is certainly some sense of that. As the budget notes, “the recent passage of the United States’ Inflation Reduction Act poses a major challenge to our ability to compete in the industries that will drive Canada’s clean economy.” But Canada stands to benefit from the IRA given concessions in domestic content requirements to include Canada and Mexico. In other words, the IRA represents just as much an opportunity for Canada as it does a challenge. And the maturation of climate policy in Canada is reflecting areas where the government sees opportunities that ought to be supported, or where obstacles require mindful navigation.
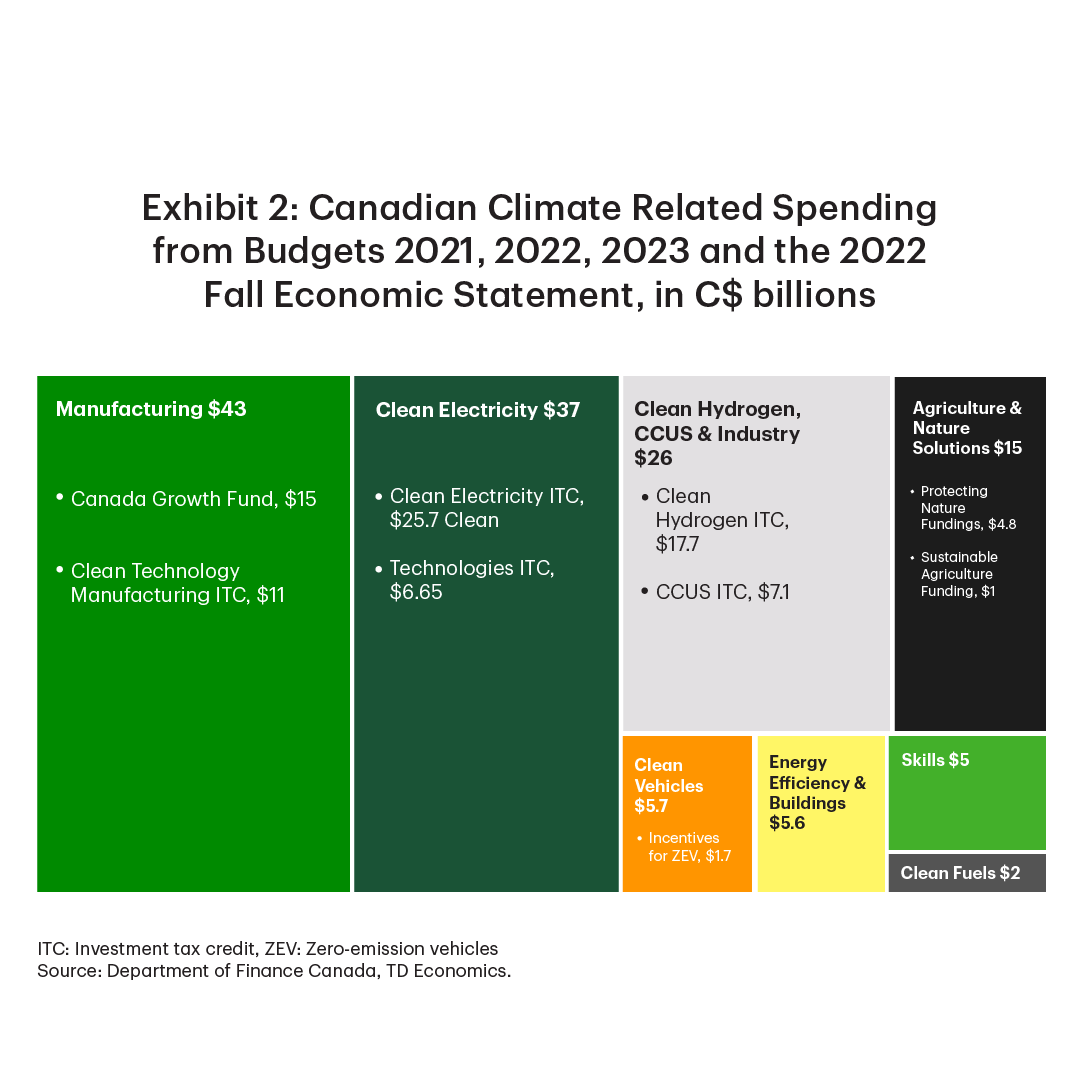
Tracking total spending and individual investment announcements, Canada is charting its own path. TD Economics estimates a total of $139 billion in spending across all budgets and fall economic statements since 2021, or 5% of nominal GDP. This compares proportionally well to the IRA’s expected $393 billion in spending, which represents just 1.5% of U.S. nominal GDP. The higher proportional outlays are likely a necessity for a small, open economy that needs to punch above its weight in order to compete for similar foreign investments relative to industrial powerhouses such as the U.S., Germany, and China, that historically are able to attract more capital and form centers of innovation.
Some have pointed out that regardless of total dollar figure, the per unit subsidies offered in Canada are, in some cases, significantly less than their U.S. counterparts. However, this has not stopped Canada from securing significant domestic and international investments. TD Economics estimates that Canada has received C$17.4 billion in EV and battery plant investment announcements since 2021, which again compares favourably to the U.S. relative to each economy’s size. For the U.S., BloombergNEF estimates investment announcements in the same sector of US$52 billion since the passing of the IRA in October.
This is not to diminish the importance of governments pursuing industrial policy, but rather to suggest that the future success Canada sees in the energy transition is perhaps less a function of per unit subsidies for production and more on a wider range of issues, including expediting project assessments, speeding up mine development times, and refocusing policy on developing the right skills in order to upskill the labour force.
An Apples-to-Oranges Comparison
Attention is often focused on comparing Canada and the U.S. based primarily on subsidies and direct funding of clean technology investments. Indeed, both countries make good use of these tools, but Canada’s framework includes a much wider array of regulations and funding tools that target different sectors or needs. In contrast, the U.S. primarily uses subsidies and relatively limited direct funding. This makes comparison difficult.
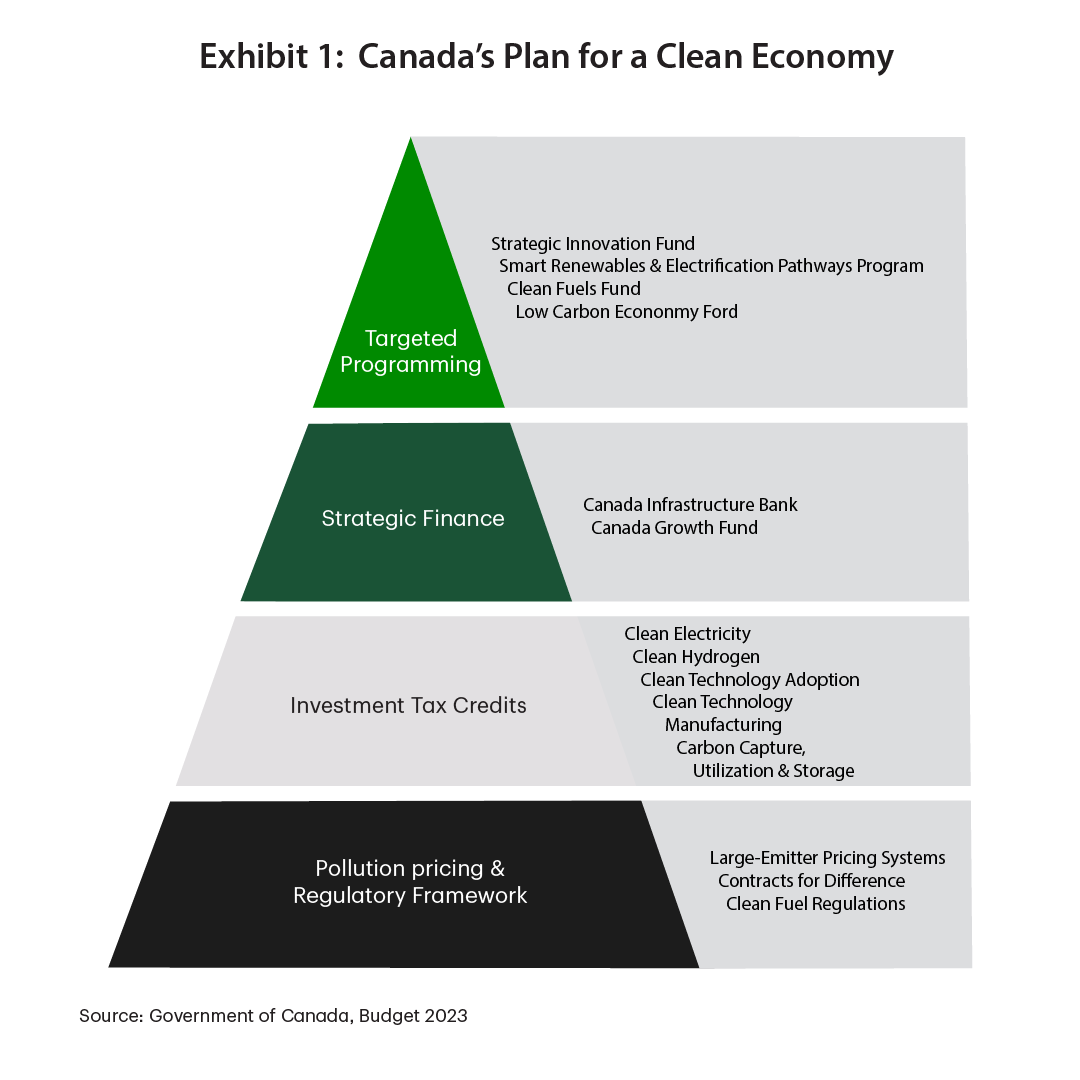
The foundation for Canada’s climate policy framework is a one-two punch of carbon pricing and clean fuel regulations (Exhibit 1). In both cases, the costs are ultimately passed on to consumers through the value chain to incent a shift in consumption behaviours – e.g. driving battery electric vehicle versus a gasoline-powered one. The purpose of layering on direct funding and subsidies is twofold: where possible, subsidies are used to further lower the cost of non-emitting activities to ideally make them the more economical option – e.g. providing electric vehicle rebates. Conversely, they can also be used to make necessary investments economical. For instance, developing a clean hydrogen supply chain currently faces the near-term challenge of having a limited market for hydrogen given the early stage of adoption and development.
At the federal level, the U.S. does not employ carbon pricing, nor does it have a broad set of regulations used to cap emissions or emissions intensity across sectors. There are some exceptions, such as fuel economy standards for vehicles or the Renewable Portfolio Standard in electricity generation. However, those target specific sectors and do not cover as large a share of emissions compared to a broad-based fuel charge. As such, American subsidies and direct funding have to clear a higher hurdle relative to Canada to reach the same point where zero-emissions activities or clean tech investments are economically viable. In other words, they have to be larger in the absence of carbon pricing for the investment to make sense to firms and individuals.
Moreover, cross-country comparisons are made difficult by how subsidies and funding are delivered. One of the main attractions of the IRA is its simplicity and speed of execution. Most of the expected spending comes from uncapped production and investment tax credits which cover a laundry list of specific technologies – everything from batteries to manufacturing equipment to carbon capture to clean hydrogen. Treasury guidance simply provides the framework for how firms can draw on each credit. Incidentally, this makes estimation of spending impacts of the IRA difficult. Initial CBO scoring of the IRA suggested that its clean energy provisions would add approximately US$393 billion over 10 years in spending. However, if clean energy investments begin to pick up momentum, the drawdown of tax credits could be much greater. A recent Brookings report suggested that actual spending could be closer to US$1 trillion1.
These types of tax credits are also available in Canada. However, they often complement direct funding that the government provides which is delivered through specific programs seeded with public capital. Projects are assessed on an individual basis by the government for eligibility and magnitude of support. These programs include the Low Carbon Economy Fund or the Strategic Innovation Fund’s Net Zero Accelerator, among others. The downside is that adding complexity through government assessments slowdowns the process. This is traded off with more flexibility to provide funding for projects that fall outside the umbrella of tax credits or if credits are subsequently shown to be insufficient to change the calculus of a project’s economic viability.
With those caveats in mind, it is still possible to compare the dollar value of Canada’s subsidy and direct funding framework on a sector-by-sector, or technology-by-technology basis. By this simplistic comparison, Canada tracks well relative to the U.S.
Breaking down the totals into their constituent parts by sector, we can see that in almost every area, Canada’s subsides on offer compare relatively favourably.
Take, for example, one of the key pillars of both countries’ subsidy frameworks – tax credits for the adoption of renewable power generation. Both countries offer tax credits, such as the section 48E’s 30% investment tax credit in the IRA and the 15% Investment Tax Credit for Clean Electricity in Budget 2023, to support the renewables build out, including for solar PV, on-shore and off-shore wind, utility-scale grid storage, and next-generation nuclear, among other technologies. The IRA’s expected spend on these credits alone is expected to reach over 40% of the total at US$161 billion. Meanwhile, Canada’s offering in Budget 2023 alone is expected to be C$26 billion. Proportionally, given the larger total spend in Canada (5% vs. 1.5% of GDP), even Budget 2023’s additions represent a higher share of GDP than the U.S., not including previous provisions for clean electricity adoption.
On the manufacturing side, the IRA’s main offering is a US$31 billion advanced manufacturing production tax credit which provides per unit subsidies across battery, solar, wind, and critical mineral production. This is supplemented by the US$10 billion Advanced Energy Project Credit that subsidizes projects across a wider swathe of industrial production.
This compares to C$12.4 billion offered in Canada between C$11.1 billion in investment tax credits for clean technology manufacturing and C$1.3 billion in a special 50% reduced corporate income tax rate for clean technology manufacturers. This could further be supplemented by the C$8 billion Net Zero Accelerator from Budget 2021 and the addition of C$500 million from the Strategic Innovation Fund from Budget 2023, for a total not proportionally far off from their American counterpart of C$21 billion.
U.S. subsidies were hitting harder heading into Budget 2023
Of course, absolute dollar values provide a single, simplistic perspective. As noted earlier, the above figures are only estimates based on what governments expect to spend, and actual spending remains unknown. For the competitiveness debate, it is important to understand how the entirety of tax credits, direct funding, and carbon credits impact the actual cost of capital expenditures for firms looking to invest in different jurisdictions. This is impacted by the nuances of how subsidies are delivered, how climate policy is structured, and the differing capex costs between the U.S. and Canada. And it is here, where the rubber hits the road, that cracks appear to form in Canada’s competitiveness.
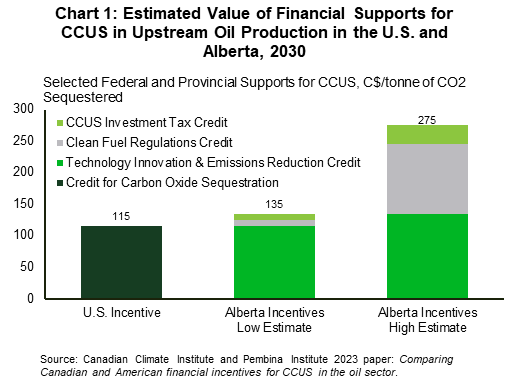
Prior to Budget 2023, several organizations had modelled the value of U.S. and Canadian financial supports on a per unit basis for different technologies. The Canadian Climate Institute (CCI) assessed the value of tax credits for carbon capture, utilization and storage technologies (CCUS) in the U.S., commonly referred to as 45Q provisions, valuing them at C$115 per tonne by 2030. In Canada, the value of financial support varies and is greater than in the U.S., but depends significantly on the uncertain value of carbon credits generated by emissions reductions. In the CCI’s example of CCUS technology deployed in Alberta, the bankable subsidy comes from carbon credits generated in both Alberta’s industrial carbon cap and trade program (TIER) and through the Clean Fuel Regulations system. The federal investment tax credit itself (which was expanded only modestly in Budget 2023 to include adjacent carbon capture technology, including heat and water equipment) was valued at about 1/5th the size of 45Q credits – just C$10-30 per tonne (Chart 1).
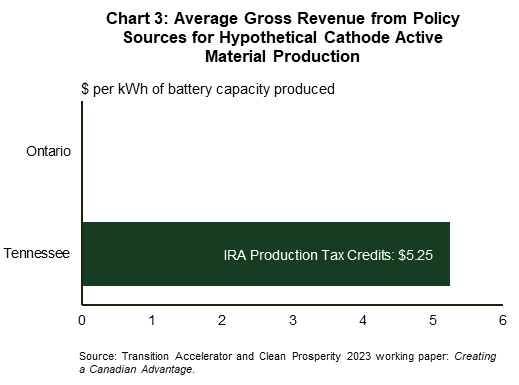
The Clean Prosperity Institute modeled a greater variety of per unit subsidies for different technologies and found that Canada compared poorly in several important areas. Notably, they assessed that the total gross revenue from tax credits and grants for a battery manufacturing plant is more than 20 times higher in the U.S. than in Canada (Chart 2), with Canada having had no subsidies for cathode active material manufacturing at the time. In contrast, the advanced manufacturing tax credit in the U.S. offered C$5.25/kWh since the credit covers critical minerals production (Chart 3).

Batteries represent one of the most important technologies that need to be scaled immediately to support near-term emissions reduction goals in transportation for the transition to battery electric vehicles (BEVs) and in power generation for grid storage. Securing a place in this supply chain is critical to a country’s position in the clean energy economy of the future.
Canada has a natural competitive advantage in this area given sizeable deposits and proximity to critical minerals and a long history and expertise in mining. But Clean Prosperity noted that the sizeable gap in cathode active material production incentives puts that advantage at risk. The U.S. has a different subset of critical mineral deposits that could be used in different battery chemistries. Which battery chemistries ultimately end up being the primary choice in downstream applications is still an open question. The answer is as much a function of which countries incent and expedite the supply chain via subsidies as it is in which countries have the preferred critical minerals deposits.
Where does Budget 2023 leave Canada from a competitiveness standpoint?
Critics were quick to point out that Budget 2023 did not change the calculus significantly in Canada’s competitiveness position relative to the U.S., pointing to relatively modest changes to existing programs with new programs, at best, matching their U.S. counterparts. But in our view, this was by design.
A significant lobbying effort by federal and provincial governments successfully secured concessions by the Biden administration to loosen domestic content requirements in IRA provisions to include Canada and Mexico. Meaning supply chains that developed in America could be as much of a benefit and opportunity to Canada as they are a competitive threat. Indeed, the host of investment announcements and developments that have occurred in Canada over the last year, speak to its own share of supply chain developments, which the budget reacted to as much as the IRA, if not more.
Viewed through this lens, the budget’s C$66.2 billion in additional climate provisions takes on a different colour. A few recent initiatives are worth noting because they tell this story about Canada’s clean energy transition and the federal government’s balancing act:
- C$17.7 billion in a new 40% investment tax credit for clean hydrogen production, including an additional 15% investment tax credit for equipment to convert hydrogen to ammonia
- C$11.1 billion in a new refundable 30% investment tax credit for clean technology manufacturing, including for critical minerals processing and for manufacturing or processing upstream components for batteries
- C$1.3 billion to 13 federal departments to expedite project assessments and approvals, which was announced in the 2022 Fall Economic Statement and reiterated in Budget 2023.
The clean hydrogen tax credit, for example, goes some way towards closing the funding gap relative to the U.S. in supporting hydrogen producers. Clean Prosperity notes that it is unlikely to fully close the gap2. But even before the launch of the credit, Canada had already seen two major developments on this front – the signing of a green hydrogen trade agreement with Germany last summer during Chancellor Olaf Schulz’s visit, and an earlier memorandum of understanding with the Netherlands to create a clean hydrogen supply chain centered on the Port of Rotterdam3. Both agreements aim to create a cross-Atlantic supply chain for hydrogen, which represented major wins for both the renewables and budding clean hydrogen sectors in the Atlantic provinces.
This is likely the logic for complementing the clean hydrogen tax credit with an additional 15% credit for equipment used to convert hydrogen into ammonia, which is key for the marine transport of hydrogen, and also why the tax credit might not have been designed exclusively to “beat” the U.S.’s equivalent subsidy.
In a similar vein, the new clean technology manufacturing tax credit and the spending to expedite project assessments tells a similar story about Canada charting its own path – specifically around battery manufacturing. As Clean Prosperity noted in its earlier report, Canada notionally stands little chance of competing on the battery front given the overwhelming funding gap. The new budget measures go some ways in closing that competitiveness gap. In fact, the tax credit specifically cites critical minerals processing and upstream battery components – a clear callout to the subsidy gap in active cathode materials. But yet again, the gap isn’t likely to close entirely.
That might not have been the point. Because even prior to the release of the budget and after the release of the IRA, Canada was still recording significant success in competing in this sector. The pure tax credit funding gap didn’t prevent Volkswagen from their decision to locate an estimated $2.2 billion investment to build their first Gigafactory outside of Europe in St. Thomas, Ontario this past March. Critics were quick to point out that, at the time of the announcement, it was unknown how much the provincial and federal governments kicked in to secure the investment. Recent reports suggest that the figure likely matched what Volkswagen would have received from the U.S., at about C$13 billion4. Regardless, it shows either Canada can compete, or that investment decisions are not entirely based on per unit subsidies for production. Governments are deploying many tools to entice investment, some tailored to specific companies and projects, and others that throw the net wide.
With this strategy, Canada is beginning to establish itself as a player in the global battery supply chain.
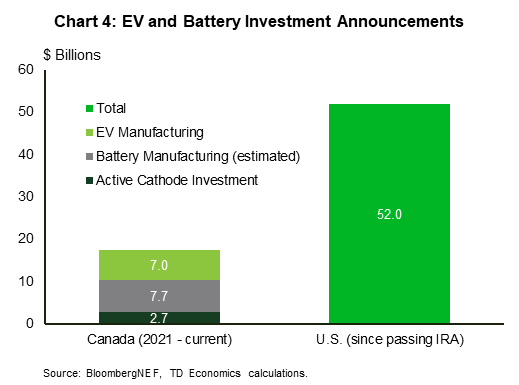
We estimate that there have been C$17.4 billion in EV and battery plant investment announcements since March 2022. Of that, C$2.7 billion are to build active cathode material production, C$7.7 billion in battery production, and C$7 billion in EV production (Chart 4). This compares proportionally well to similar announcements in the U.S. – BloombergNEF estimates that since the passing of the IRA in October 2022, US$52 billion in EV and battery manufacturing investments have been announced.
Canada’s position in this supply chain is not exclusively a function of subsidies and climate policies. Importantly, proximity to critical minerals is one of the primary draws of investment initiatives. BloombergNEF recently ranked Canada 2nd, ahead of the U.S. and behind only China – the current global leader by a mile-and-a half in battery and EV production – in its annual battery supply chain ranking5.
The research organization specifically noted Canada’s access to raw materials, commitment to ESG, and the country’s “industry, innovation, and infrastructure” as key factors behind the high placement. This is a competitive advantage that flies far under the radar of most conversations about industrial strategy. However, companies are taking note, evidenced by Volkswagen’s EV battery plant announcement last month. The company specifically cited access to raw materials and Ontario’s power sector energy mix being primarily zero-emissions as reasons for St. Thomas’ s appeal.
This makes the additional C$1.3 billion in spending from the 2022 Fall Economic Statement on expediting project assessments all the more important. Canada has a negative reputation on being slow to approve new projects, particularly in the mining sector. Mine development is a complex process of exploration, project feasibility & environmental impact assessments, and construction. No amount of subsidies could offset the economic loss and risk to a company if project approvals and development span decades. A transparent, expeditious, and reliable process is of the utmost importance in developing a supply chain for critical minerals needed in all clean technologies.
Where is more focus needed going forward?
There are three key issues of concern for governments in attracting investment: 1) maintaining a competitive position in terms of industrial policy, 2) following through on commitments, and 3) expanding policies to support other areas of the energy transition.
Both federal and provincial governments have made it known that speeding up mine development times is of the utmost priority. Critical minerals form the backbone of the clean technology economy, and the majority of existing global supply lies in places further afield than North America. China, Australia, Chile, Indonesia, and a handful of countries in Africa account for the lion’s share of the extraction of nickel, copper, rare earths, lithium, and other minerals needed to produce clean technologies. The IEA predicts that based on existing mine development times averaging 17 years from discovery and exploration through to final construction, there is unlikely to be any change in the existing supply chain for mineral production. That must change if Canada (and the U.S. and Europe) intends on securing the energy transition.
Second, more focus is needed in developing the right skills framework to upskill the existing workforce in preparation for those investments Canada aims to attract. Already, there are concerns that labour shortages at battery plants will be a barrier to further investment as the existing labour force trained in internal combustion engine powertrains or propulsion systems are unable to translate those skillsets into their electric counterparts6.
Lastly, a multitude of sectors that produce significant emissions remain relatively untouched by policy that will need to be addressed over the medium term. The buildings sector, for example, accounts for 13.1% of emissions – more than passenger transportation, which accounts for 11.8% of emissions yet receives most of the attention from policymakers. The decarbonization pathway for buildings is just as well known and just as developed, yet outside of a smattering of federal initiatives to decarbonize the sector, including the Greener Homes loan and grant programs, little is being done to address this important source of emissions. The government announced the Green Buildings Strategy last July, which is expected to be released in the coming months, but the buildings sector in general has played a much smaller part in the broader discourse around decarbonization.
This is not to diminish the importance and focus on industrial policy – rather, this is the unfortunate complexity of the energy transition. Reaching net zero at the speed we need to do so requires focus on every issue simultaneously. Public discourse, in our view, is overly focused on competitiveness and not on what needs to specifically occur to reach our emissions reduction goals.
End Notes
- https://www.brookings.edu/bpea-articles/economic-implications-of-the-climate-provisions-of-the-inflation-reduction-act/?utm_campaign=Economic%20Studies&utm_medium=email&utm_content=252404703&utm_source=hs_email
- https://cleanprosperity.ca/budget-takes-big-steps-on-climate-action-though-more-is-needed/
- https://natural-resources.canada.ca/climate-change/canadas-green-future/the-hydrogen-strategy/memorandum-understanding-between-the-government-canada-and-the-government-the-netherl/23907
- https://www.reuters.com/business/autos-transportation/canada-offering-more-than-c13-bln-over-decade-volkswagen-battery-plant-govt-2023-04-20/
- https://about.bnef.com/blog/chinas-battery-supply-chain-tops-bnef-ranking-for-third-consecutive-time-with-canada-a-close-second/
- https://www.theglobeandmail.com/business/article-canada-ev-battery-factory-skilled-labour/
Disclaimer
This report is provided by TD Economics. It is for informational and educational purposes only as of the date of writing, and may not be appropriate for other purposes. The views and opinions expressed may change at any time based on market or other conditions and may not come to pass. This material is not intended to be relied upon as investment advice or recommendations, does not constitute a solicitation to buy or sell securities and should not be considered specific legal, investment or tax advice. The report does not provide material information about the business and affairs of TD Bank Group and the members of TD Economics are not spokespersons for TD Bank Group with respect to its business and affairs. The information contained in this report has been drawn from sources believed to be reliable, but is not guaranteed to be accurate or complete. This report contains economic analysis and views, including about future economic and financial markets performance. These are based on certain assumptions and other factors, and are subject to inherent risks and uncertainties. The actual outcome may be materially different. The Toronto-Dominion Bank and its affiliates and related entities that comprise the TD Bank Group are not liable for any errors or omissions in the information, analysis or views contained in this report, or for any loss or damage suffered.
Download
Share: