The Curious Case of Young Families’ Shrinking Mortgages
Maria Solovieva, CFA, Economist | 416-380-1195
Date Published: July 29, 2025
- Category:
- Canada
- Real Estate
Highlights
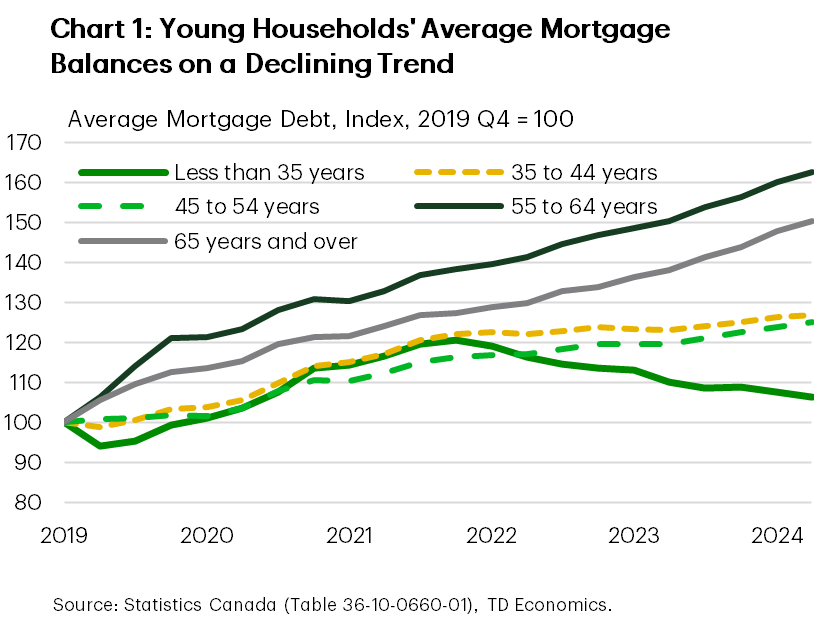
- Statistics Canada’s Distributions of Household Economic Accounts (DHEA) contains a treasure chest of interesting facts and figures on the financial position of households. One trend that stood out for several quarters now is the steady decline in average mortgage balances of young families, even as mortgage debt has continued to rise for all other age groups (Chart 1).
- Since the peak in Q3 2022, average mortgage balances among households where the primary earner is under 35 years of age have fallen by $15.5k. Compared to Q1 2023, the reduction stands at $11k. Over the same period, mortgage balances increased by $18k for households aged 55-64 and by $4k for those aged 65 and older.
- The drop among younger borrowers appears to be at least partly explained by a decline in young people entering the housing market or opting for less expensive homes due to affordability challenges. Household formation in this age group has surged, growing at 2.5 times faster than other age groups in the last two years – yet many of these new households remain renters. According to Statistics Canada’ 2024 Canadian Social Survey more than half of young people reporting being very concerned about their ability to afford housing1. Home ownership remains elusive for younger generations with 35% of young adults renting, compared to 23% of older aged group.
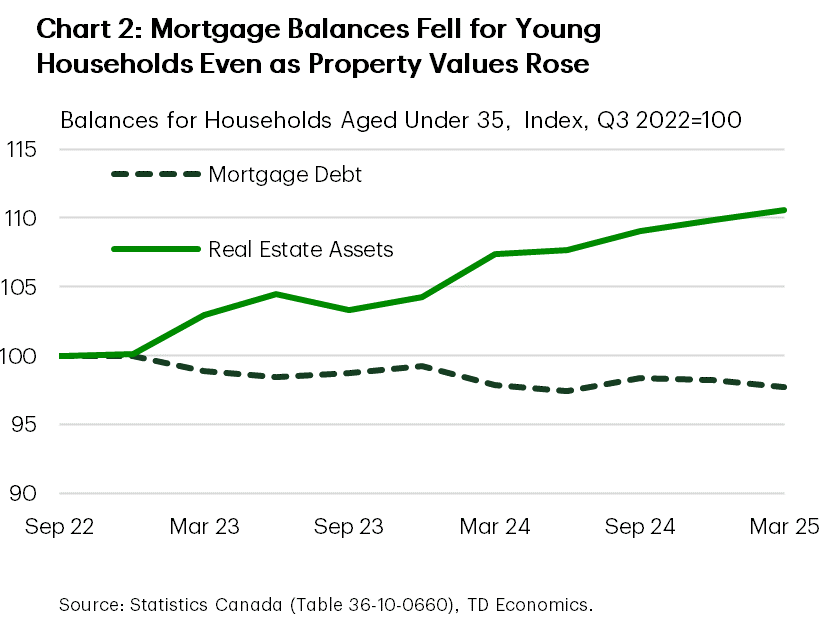
- Another possible explanation is downsizing: young homeowners may be trading high-priced homes for more affordable ones in response to higher borrowing costs. But the data doesn’t support this idea. Since Q3 2022, the total value of real estate assets has actually increased, while the total value of mortgages has declined (Chart 2). If downsizing were widespread, we’d expect asset values to fall in tandem with mortgage balances.
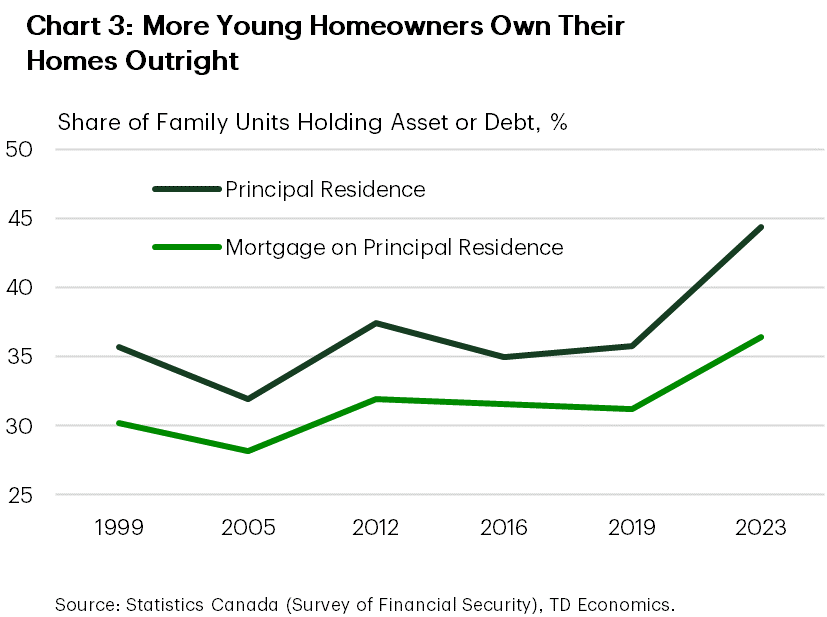
- Instead, this gap may be explained by another phenomenon: the growing share of younger households owning their homes outright. According to the Survey of Financial Security (SFS), last conducted in 2023 – at the start of our analysis – 8% of households owned their property free and clear. That is the highest share on record (Chart 3). This trend may have persisted in subsequent quarters.
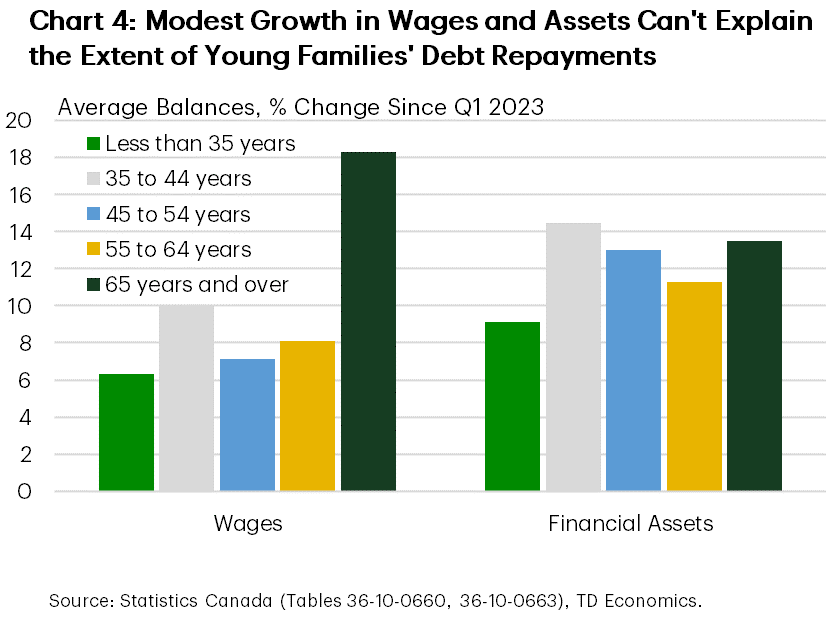
- Finally, another explanation for why average mortgage balances falling is prepayment. It’s very likely that some of the youngest households may be prioritizing reducing debt obligations in the face of the rise in the cost of borrowing since 2022. This raises another question: how are younger homeowners managing to fund prepayments. Employee compensation and financial asset growth for young families has been modest compared to other age groups (Chart 4). This points to another potential source: financial support from older relatives.
- Indeed, as younger families reduced debt, older age groups – especially those nearing or in the retirement – took on more. Yet there is no sign of increased ownership of investment properties or spike in renovation activity that would typically justify an increased leverage among these groups. That raises the possibility that some of this debt is being used to help adult children with homeownership.
- Other research on intergenerational support backs up this view. A 2021 study by Statistics Canada found that 17.3% of residential properties owned by individuals born in the 1990s were co-owned with their parents2. Similarly, a recent Bank of Canada study highlights the growing role of parental support: over 20% of first-time homebuyers (FTHBs) received gifted down payments, with younger FTHBs more likely to receive this assistance than their older peers3. These gifts – whether drawn from financial assets or sourced through borrowing – lower children’s loan-to-value ratios, helping them qualify for mortgages and purchase homes that would otherwise be out of reach. If what we see in the DHEA is capturing the effects of parents borrowing to support their children, it suggests that intergenerational wealth transfer increasingly occurs not just through asset gifts, but also through the debt channel.
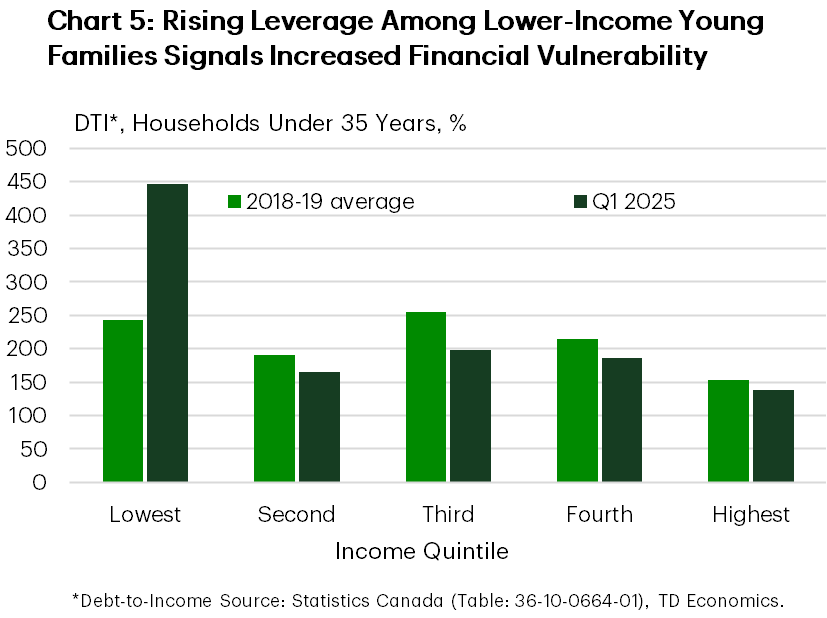
- This pattern isn’t spread evenly across income levels. Among the lowest-income young households, the debt-to-income (DTI) ratio – a key measure of financial vulnerability – has surged from 244% before the pandemic to 446% in Q1 2025, signaling rising financial strain. In contrast, this ratio improved across all other income cohorts during the same period (Chart 5). This reinforces concerns that housing-centric wealth transfer could deepen intergeneration inequality, as homeownership becomes increasingly dependent on family support, leaving lower-income young families further behind.
End Notes
- Statistics Canada. Housing challenges related to affordability, adequacy, condition and discrimination, August 2 to September 15, 2024. Available at; https://www150.statcan.gc.ca/n1/daily-quotidien/241119/dq241119b-eng.htm
- Khalid, A., Gordon, J., and Mirdamadi, M, Intergenerational housing outcomes in Canada: Parents’ housing wealth, adult children’s property values and parent–child co-ownership. May 2024. Available at: https://www150.statcan.gc.ca/n1/pub/46-28-0001/2024001/article/00002-eng.htm
- Allen, J., Carmichael, K., Clark, R., Li, S, and Vincent, N., Housing Affordability and Parental Income Support. July 2024. Available at: https://www.bankofcanada.ca/wp-content/uploads/2024/07/swp2024-28.pdf
Disclaimer
This report is provided by TD Economics. It is for informational and educational purposes only as of the date of writing, and may not be appropriate for other purposes. The views and opinions expressed may change at any time based on market or other conditions and may not come to pass. This material is not intended to be relied upon as investment advice or recommendations, does not constitute a solicitation to buy or sell securities and should not be considered specific legal, investment or tax advice. The report does not provide material information about the business and affairs of TD Bank Group and the members of TD Economics are not spokespersons for TD Bank Group with respect to its business and affairs. The information contained in this report has been drawn from sources believed to be reliable, but is not guaranteed to be accurate or complete. This report contains economic analysis and views, including about future economic and financial markets performance. These are based on certain assumptions and other factors, and are subject to inherent risks and uncertainties. The actual outcome may be materially different. The Toronto-Dominion Bank and its affiliates and related entities that comprise the TD Bank Group are not liable for any errors or omissions in the information, analysis or views contained in this report, or for any loss or damage suffered.
Download
Share: