When Defence Spending Becomes Industrial Policy
Date Published: January 12, 2026
- Category:
- Canada
- Government Finance & Policy
Highlights
- The federal government is planning a substantial increase in defence expenditures to improve force readiness and support the economy.
- Many segments of Canada’s industrial base are operating below capacity suggesting opportunity for economic gains, even though some high-profile defence sectors feature capacity constraints and a high degree of import reliance.
- Longer-term investment in developing a more robust domestic supply chain represents the upside to growth.
November’s budget leaned heavily on public investment to (hopefully) spur a new wave of productivity growth. Part of this puzzle are “generational investments” in the armed forces that are purported to “create opportunities for the Canadian defence industry”, delivering the proverbial guns and butter.
This process comes at a time that Canadian defence expenditures were already due to rise as part of the Our North, Strong and Free Strategy. In the third quarter, spending on “weapons systems” rose 82% (quarter-on-quarter, not annualized) as part of an existing multi-year strategy to enhance air and naval capabilities. Ottawa has also recently budgeted for defence expenditures to reach 2% of GDP this year and intend to reach 3.5% by 2035 as part of new NATO spending targets. With the start of the new spending initiatives, Canada has entered the E.U.’s $240 billion joint procurement program – Security Action for Europe (SAFE). Together, these decisions reflect both a geopolitical imperative and an economic gamble.
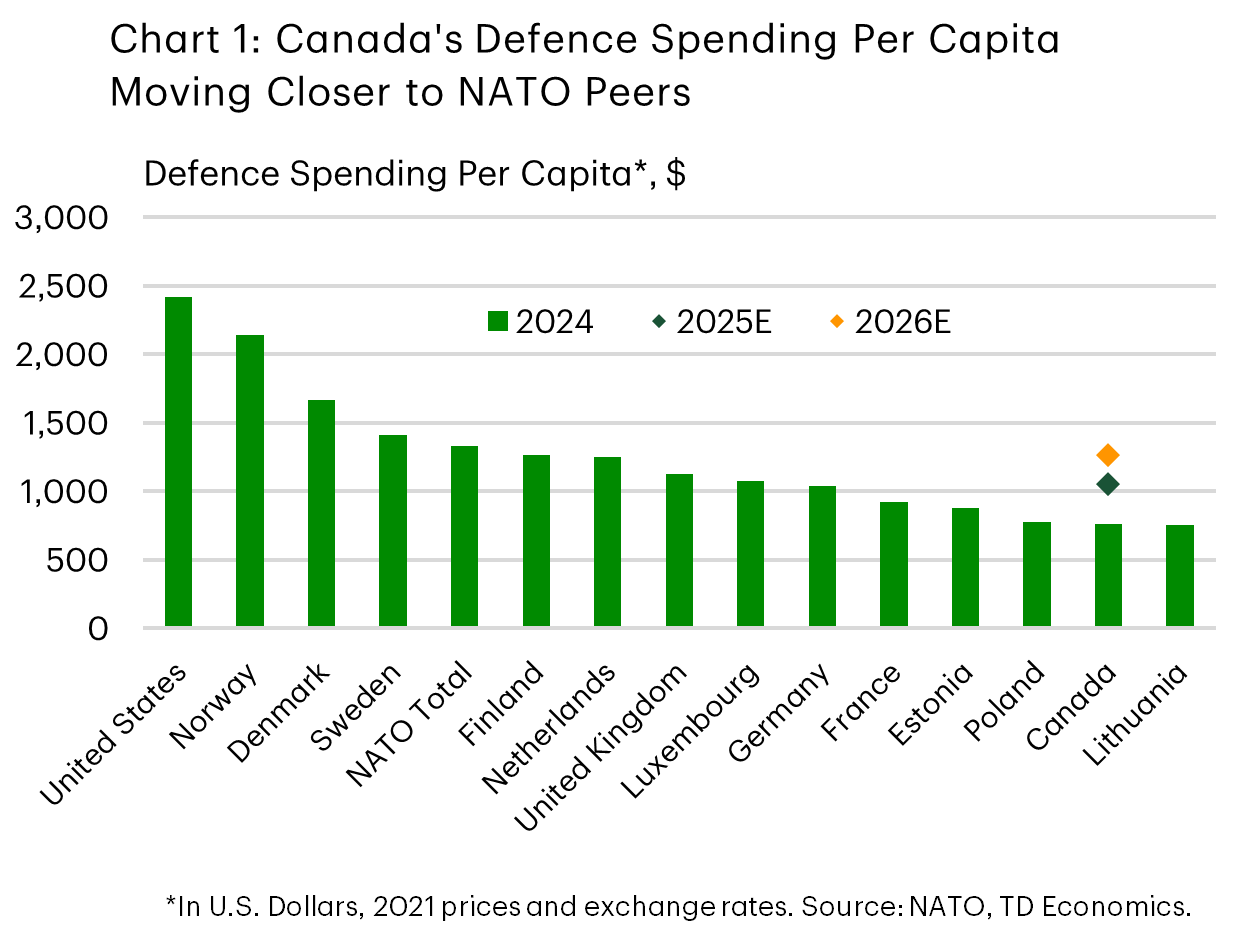
The new spending commitments would bring Canada’s defence spending per capita closer in line with NATO members, rising from $763 per person to roughly $1,050 in 2025, and $1,263 in 2026 – a level comparable to Finland (Chart 1).
A Keynesian Moment?
The budget was light on details for how (and when) allocated spending will be deployed. Moreover, the PBO noted a lack of clarity on how the announced money interacts with previous plans in Our North Strong and Free and the Defence Department’s 2025-2026 Departmental Budget. Nonetheless, Budget 2025 allocated $55.9 billion ($81.8 billion on a cash basis) to be distributed between 2025 and 2030.
The cash outlays were broken down further. The largest component ($20.4 billion) is to provide compensation increases to Canadian Armed Forces (CAF) personnel and for the delivery of healthcare. The compensation increases are retroactive to April 1st of 2025 and will be rolled out over the coming 12 months.
This should provide a near-term lift to output. The direct impact on GDP may be modest but secondary effects could lift output by roughly 0.1-0.2 ppts over the medium-term once indirect multiplier effects are considered. Further, the government’s June 2025 plan to add roughly 13,000 Regular and Reserve members would provide a boost to employment and household income. However, persistent challenges with recruitment and retention suggest this may be a more medium- to long-term achievement.
Allocations to capital spending are due to be larger than on personnel, with $19 billion to “sustain CAF capabilities” and expand training infrastructure. There are an additional allocations of $10 billion for digital infrastructure, and $17.9 billion to “expand Canada’s military capabilities ”through outlays in vehicles (armoured and otherwise), counter drone and long-range capabilities, and domestic ammunition production.”
Estimating the macroeconomic impact of these outlays is more complex. The notion that military spending can stimulate growth, often referred as Military Keynesianism, rests on the idea that defence R&D and procurement can spur innovation (raising productivity), and generate positive spillovers to civilian industries through fiscal multipliers.
Global Supply Chains and Canada’s Participation
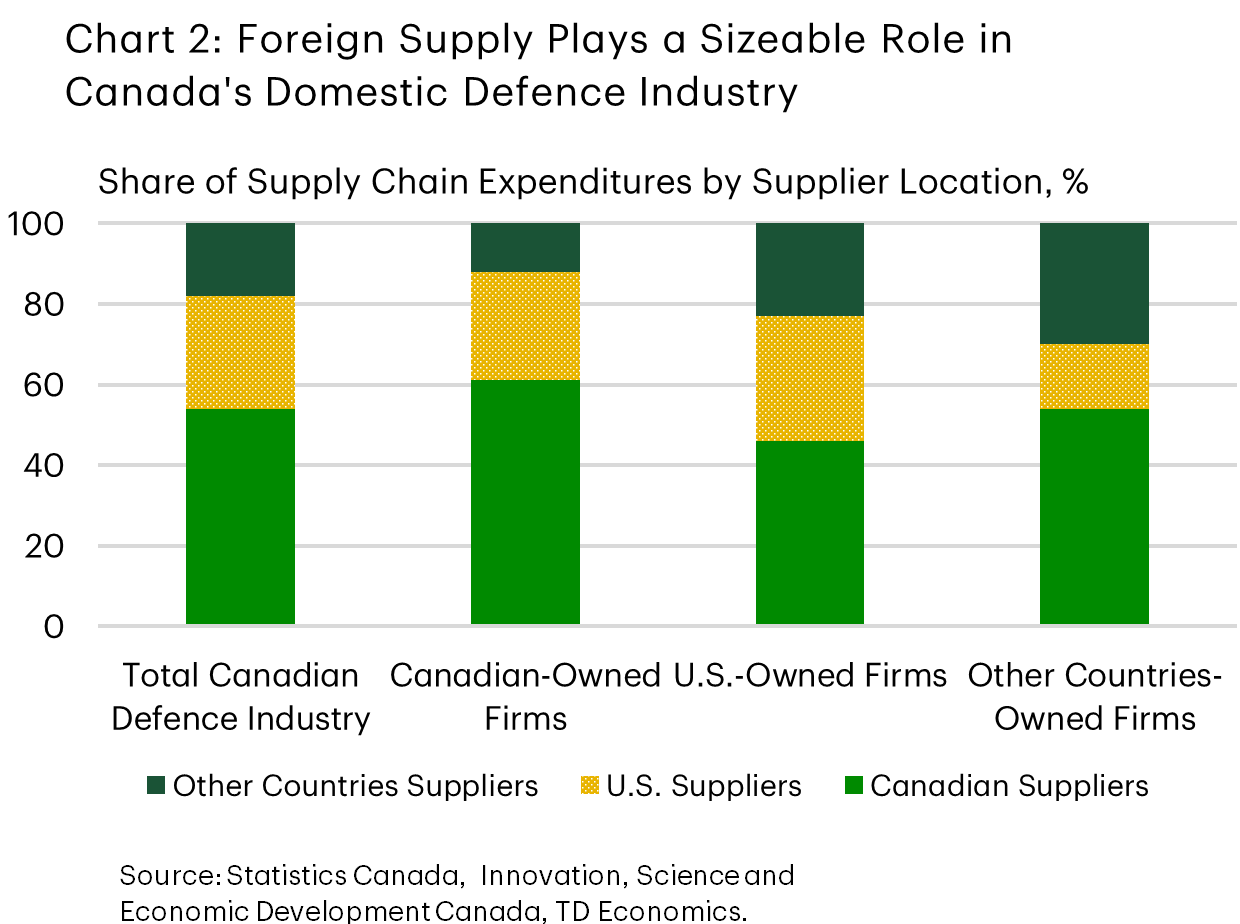
The worry, as always, is that some capital investments will deliver smaller economic dividends because they rely heavily on foreign suppliers. While Canadian firms participate in global supply chains, such as through F-35 industrial participation contracts, roughly half of the procurement spending flows abroad (Chart 2), limiting the domestic multiplier. The benefits of direct purchases through these programs tend to accrue primarily through maintenance, training, information technology, and infrastructure work performed in Canada.
This is why forthcoming negotiations on domestic content for the Canadian Patrol Submarine Project, and the government’s ongoing review of the remaining fighter-jet acquisitions, could materially affect the economic payoff. A shift toward local assembly, or greater Canadian workshare in maintenance and mission systems, would raise the economic impact of these programs.
On balance, increased Canadian military outlays will likely result in relatively smaller domestic multipliers than other government spending (as industry is not set up to deliver products) and some spillovers abroad. So, while the focus below is on domestic spending and investments, multipliers on capital outlays can likely be discounted due to the degree of international reliance.
It should be noted that, with global rearmament in full swing, Canadian firms will also likely benefit from increased spending internationally. For instance, Canada’s participation in the E.U.’s SAFE initiative would see domestic firms involved in the bloc’s joint procurement of defence assets. These represent another set of upside risks to the outlook but are beyond the scope of this examination.
Domestic Industrial Multipliers
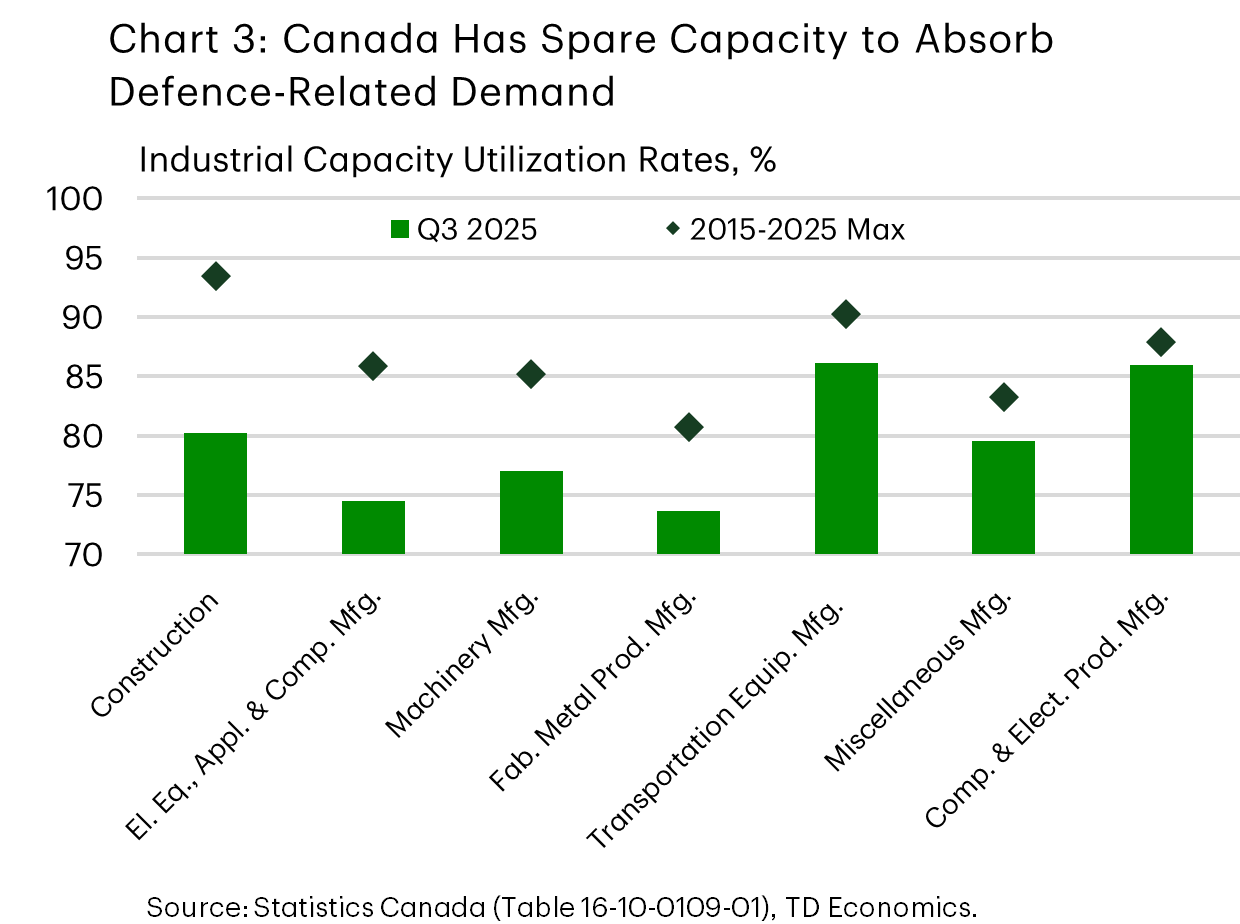
Despite the reliance on suppliers abroad, spending can still help lift domestic activity, particularly when inflation is moderating and spare capacity exists. These are the circumstances Canada finds itself in today (Chart 3). In this environment, officials hope well-structured spending can stabilize output, offsetting potential trade shocks from a more protectionist United States.
Data suggest several sectors already have the scale and expertise to absorb additional demand. For instance, capacity utilization in the transportation equipment manufacturing sector is roughly 4 percentage points below its 2015-2025 maximum. This sector includes aerospace manufacturing, ship and boat building, and armoured vehicle manufacturing – all industries where Canadian firms have expertise. Of course, a lens at the high level doesn’t speak to instances where key firms face capacity constraints. But overlooking this nuance, these industries have long-term GDP multipliers (including direct, indirect, and induced effects) in a range from 1.9 to 2.2.
An impact of similar magnitude could come from the expansion of artillery and other ammunition production. Fabricated Metal Product manufacturing is currently operating roughly 7% below last decade’s peak suggesting room for output gains with minimal inflationary pressure. Moreover, subsectors like industrial machinery, metalworking, commercial and service industry machinery, and engine and power-transmission equipment manufacturing all feature total multipliers ranging from 2.3 to 2.6 (Table 1).
Conversely, the upside from the planned outlays on digital infrastructure will likely require a build out of new capacity. Domestic production in computer and electrical equipment manufacturing, (including communications, radar, and mission-system components) is bumping up against peak production levels. This suggests limited scope to immediately leverage higher demand, but a ripe opportunity to respond by increasing capital investment.
Beyond manufacturing, service industries will benefit directly from higher personnel numbers and training demand. Canada features a world leading flight simulation industry that stands to gain from both domestic defence contracts and spillovers into commercial aviation. Similarly, data processing, hosting, systems design, and telecommunications firms should benefit from expanded spending on cybersecurity and joint defence networks. If R&D in these dual-use technologies is nurtured effectively, it could complement broader public and commercial investments in digital infrastructure and AI capacity.
Uncertainty About Timeliness Lingers Over Outlook
An old Roman adage proclaims, “If you want peace, prepare for war” (si vis pacem, para bellum). The premise is simple: deterrence through strength. As the global order becomes less stable, with conventional and cyber threats mounting, states are being forced to treat their industrial capacity and infrastructure as national security assets.
The motivation is meeting reality. Although a steep jump in outlays was recorded in Q3, persistent spending delays have been a hallmark of Canada’s Defence strategy and loom over how quickly the newly formed Defence Investment Agency will get up and running to ensure timely outlays. Coupled with potential constraints in industrial capacity and expertise, we err on the side of caution when embedding new spending into our economic outlook, focusing primarily on funding allocated to recruitment and retention of personnel. This underpins part of our assumptions about the healthy government spending growth heading into 2026 that supports a 1.6% gain over the next 12 months.
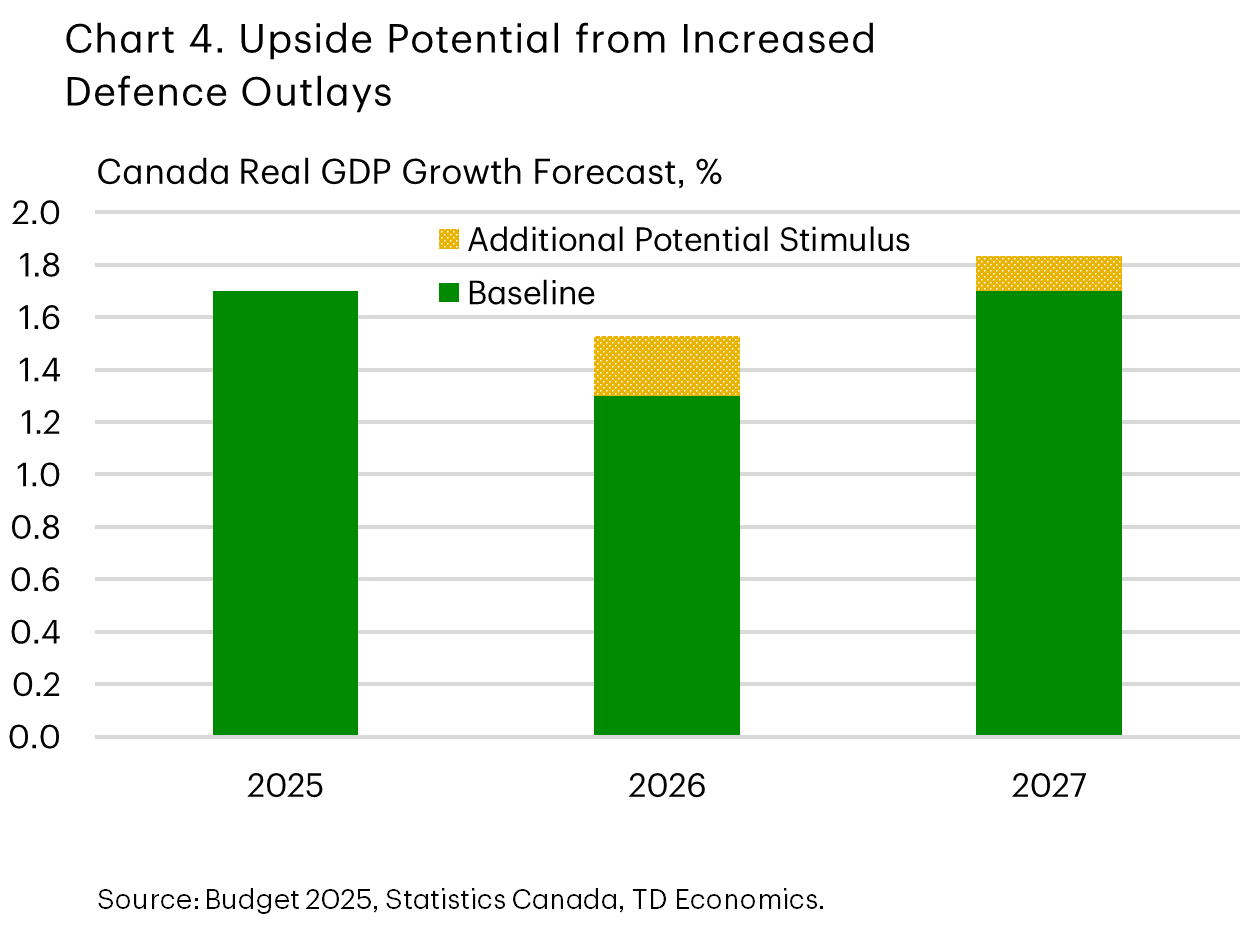
That said, an upside exists, and if a new page is truly being turned, the allocated funds, together with international partnership, could form the foundation of a larger fiscal impulse. The budget didn’t offer a specific breakdown for the timing of the planned cash outlays over the coming years but prorating the total amount in line with the timeline for expense recognition in the budget can serve as a guidepost. In this conservative upside scenario, where the fully allocated funds are spent promptly, and within the existing supply chain (meaning only roughly half of funds for acquisitions are imported) the projected increase in spending could result a lift to growth of up to 0.2% in 2026 and 0.1% in 2027 above our baseline projection (Chart 4).
Exhibits
Table 1: GDP Multipliers of Canada's Defence-Adjacent Industries
| Industry | GDP Type I Multiplier | GDP Type II Multiplier | Examples |
| Construction | 1.3 to 2.4 | 1.4 to 3.1 | Residential (barracks) and non-residential construction |
| Fabricated Metal Products | 1.8 to 2.0 | 2.3 to 2.6 | Ammunition, ship sections, transmission towers and masts |
| Machinery Manufacturing | 1.6 to 1.8 | 2.0 to 2.3 | Simulation equipment, optical gun sighting and fire control equipment, various engines and power transmissions |
| Computer and Electronic Products | 1.4 to 1.5 | 1.9 to 2.0 | GPS equipment, space satellites, communications equipment, semiconductors |
| Electrical Equipment, Appliance and Computer Manufacturing | 1.5 to 1.8 | 1.9 to 2.4 | Engine generators, switchboards, circuit breakers |
| Transportation Equipment Manufacturing | 1.6 to 2.0 | 2.0 to 2.3 | Aircrafts, fuselage, naval ships or submarines, patrol vessels, aerospace equipment R&D |
| Transportation (Air, Rail, or Truck) | 1.4 to 2.6 | 1.6 to 3.3 | Air cargo, rail/ river/ freight, coastal shipping, general freight tracking. |
| Telecommunications | 1.4 | 1.6 | Satellite or missile tracking stations, operated on a contract basis |
| Data Processing, hosting and related | 1.5 | 2.0 | Cloud Computing |
| Architectural, engineering and related services | 1.4 | 1.9 | Industrial engineering, drafting, surveying, mapping |
| Computer systems design and related | 1.5 | 2.1 | Systems design, custom software development, cybersecurity architecture |
| Management, scientific and technical consulting services | 1.4 | 1.8 | Scientific and technical advisory, logistics consulting |
| Scientific research and development services | 1.3 | 1.8 | Life & science, industrial research, electronic R&D, biotech R&D |
| Other professional, scientific and technical services | 1.6 | 2.1 | Technical testing and analysis |
| Repair and maintenance (except automotive) | 1.5 | 2.0 | Industrial equipment and machinery, repair and maintenance |
| Defence Services | 1.4 | 1.8 | Military Operations |
Disclaimer
This report is provided by TD Economics. It is for informational and educational purposes only as of the date of writing, and may not be appropriate for other purposes. The views and opinions expressed may change at any time based on market or other conditions and may not come to pass. This material is not intended to be relied upon as investment advice or recommendations, does not constitute a solicitation to buy or sell securities and should not be considered specific legal, investment or tax advice. The report does not provide material information about the business and affairs of TD Bank Group and the members of TD Economics are not spokespersons for TD Bank Group with respect to its business and affairs. The information contained in this report has been drawn from sources believed to be reliable, but is not guaranteed to be accurate or complete. This report contains economic analysis and views, including about future economic and financial markets performance. These are based on certain assumptions and other factors, and are subject to inherent risks and uncertainties. The actual outcome may be materially different. The Toronto-Dominion Bank and its affiliates and related entities that comprise the TD Bank Group are not liable for any errors or omissions in the information, analysis or views contained in this report, or for any loss or damage suffered.
Download
Share: