Quantitative Tightening:
Watching Milk Boil
Maria Solovieva, CFA, Economist | 416-380-1195
Date Published: December 6, 2022
- Category:
- Canada
- Financial Markets
Highlights
- U.S. Treasuries, the ultimate safe asset for the global economy, are showing signs of stress.
- In an already vulnerable environment, Quantitative Tightening could be more akin to watching milk boil rather than “watching paint dry”. Everything looks fine, until it suddenly isn’t.
- There are safeguards in place to prevent a repeat of 2019 repo episode, while more fundamental reforms are under way to improve liquidity. Still, the risk of increased disruptions is real and warrants monitoring of Treasury market dynamics.
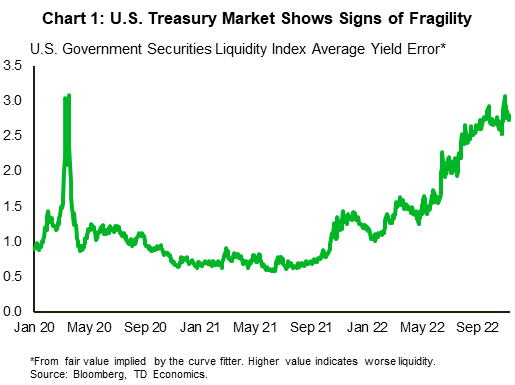
U.S. Treasuries are the ultimate safe asset for the global economy and support the systemic stability of institutions across the market. Recently, market depth (the ability to trade large market orders without impacting the price) and bid-ask spreads (the difference between the highest price that a buyer is willing to pay and the lowest price that a seller is willing to accept) have deteriorated. There’s growing caution in intermediating large-sized orders and the increased costs of trading in the environment of increased volatility. According to the Financial Stability Report, the U.S. Treasury market continued to function smoothly in the third quarter, but measures of trading costs remain elevated, and liquidity is reduced.
The Bloomberg U.S. Government Securities Liquidity Index tracks average yield deviations from fair value, and reached a high of 3% on October 31st (Chart 1). The recent deterioration started when the Fed began to reduce accommodative monetary policy. The gap has since grown larger alongside the policy rate. On its own, a rising policy rate should not result in increased fragility and a fixed income securities sell-off is unavoidable during a rising rate environment. However, heightened uncertainty about the future path of monetary path has injected more instability into an already vulnerable environment.
The Fed’s Quantitative Tightening (QT) also removes a key buyer from the market. Since June, the Fed has reduced its nearly nine trillion-dollar balance sheet by no longer reinvesting the proceeds of maturing securities. By design, the monthly run-off of Treasuries has been accelerating over four months, reaching the desired cap of $60 billion in October. At this pace, over the next year, there’s as additional $700 billion in government securities that needs to be absorbed by the private sector.
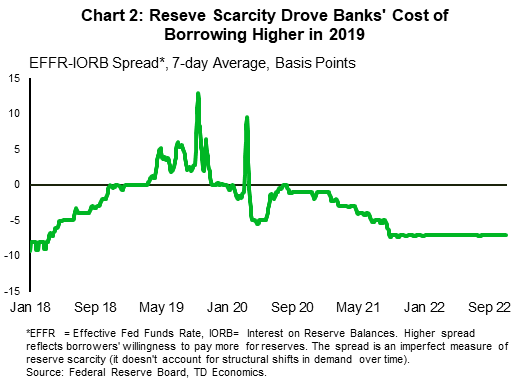
In 2017, then-Chair Janet Yellen compared the Fed’s balance sheet reduction to “watching paint dry” – a process that would go unnoticed in the background. However, in practice, that round of QT ended with a stress episode in the repo market in 2019, when increasing reserve scarcity prevented banks from lending in the money markets where demand for cash drove repo rates higher (Chart 2). This isn’t the case today, but more financial tightening lies ahead and it’s possible that QT could be akin to watching milk boil. Everything looks fine, until it suddenly isn’t.
Where that temperature lies remains a trial-and-error exercise, and any market dislocation that risks the smooth functioning of financial markets would quickly prompt the Fed into action on a resolution. The repo market experience led to an establishment of a domestic Standing Repo Facility (SRF), which should serve as a backstop in money markets. By providing funds in the SRF, the Fed can support a ceiling on repo rates, reducing the potential for disruptions.
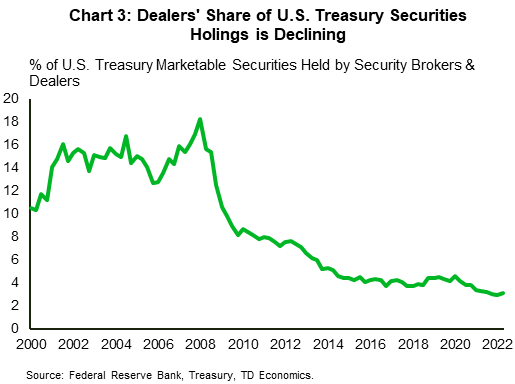
In the current environment, this facility alone won’t solve all problems in the Treasury market and there are already proposals being explored as key backers of the U.S. Treasury market – the primary dealers – face restraints to warehouse government securities under tougher regulations post-Global Financial Crisis. Since then, the dealers’ share of government holdings declined by 15 percentage points, reducing their ability to intermediate market activity (Chart 3).
The Department of the Treasury is discussing a government securities buyback program, which would effectively swap highly liquid Treasuries for less liquid ones – a measure that will provide tactical relief and balance sheet space to dealers. In addition, more fundamental reforms are currently under discussion with proposals ranging from universal central clearing of all trades to creating an “all-to-all” trading market resembling the equity market, thereby removing primary dealers from the equation.
Wherever the new policy lands, it will take some time to implement. In the meantime, there’s always a risk that the Fed may be forced to respond in advance to any outsized Treasury market stress. Absent this, we expect the Fed to wrap-up its QT program by early 2024.
Disclaimer
This report is provided by TD Economics. It is for informational and educational purposes only as of the date of writing, and may not be appropriate for other purposes. The views and opinions expressed may change at any time based on market or other conditions and may not come to pass. This material is not intended to be relied upon as investment advice or recommendations, does not constitute a solicitation to buy or sell securities and should not be considered specific legal, investment or tax advice. The report does not provide material information about the business and affairs of TD Bank Group and the members of TD Economics are not spokespersons for TD Bank Group with respect to its business and affairs. The information contained in this report has been drawn from sources believed to be reliable, but is not guaranteed to be accurate or complete. This report contains economic analysis and views, including about future economic and financial markets performance. These are based on certain assumptions and other factors, and are subject to inherent risks and uncertainties. The actual outcome may be materially different. The Toronto-Dominion Bank and its affiliates and related entities that comprise the TD Bank Group are not liable for any errors or omissions in the information, analysis or views contained in this report, or for any loss or damage suffered.
Download
Share this: