Ceasefire Brings Some Relief To Crude
Prices – But Diplomatic Setbacks Keep
Risks Elevated
Marc Ercolao, Economist | 416-983-0686
Date Published: April 15, 2026
- Category:
- Canada
- Commodities & Industry
Highlights
- U.S.–Iran talks over the weekend ended without an agreement, raising doubts about whether the current ceasefire can evolve into lasting de‑escalation. Core disagreements over Iran’s nuclear program and control of the Strait of Hormuz remain unresolved.
- Crude prices have remained volatile since last week’s ceasefire news, initially rebounding before sliding again as markets pin hopes on a resumption of talks.
- We’ve updated our two main oil price scenarios – baseline and prolonged disruption – to reflect the most recent developments. Both scenarios feature upgrades to the price path to incorporate the impact of damage to infrastructure, a slower assumed recovery in oil exports and higher risk premia.
- Beyond crude, the conflict continues to ripple through refined products, LNG, freight, and fertilizer markets, with knock-on implications for inflation and global growth.
Hopes for a lasting U.S.–Iran de-escalation took a hit over the weekend after direct talks between Washington and Tehran ended without an agreement. The failure to secure a deal leaves the truce – initially announced as a two‑week ceasefire – on increasingly fragile footing.
Core differences remain unresolved. U.S. officials said negotiations broke down mainly due to Iran’s refusal to abandon its nuclear weapons ambitions, while Iranian representatives called U.S. demands excessive and insisted on maintaining leverage over the Strait of Hormuz. Initial talks ended without clarity on whether further negotiations would happen before the current ceasefire expires on April 22nd, though recent signals suggest both sides remain open to re‑engagement.
President Trump also imposed a full naval blockade of the Strait of Hormuz on Monday morning. While the U.S. blockade is formally limited to Iranian ports, it still means that up to 2.0 million barrels per day (bpd) of Iranian product could be removed from global markets almost instantly.
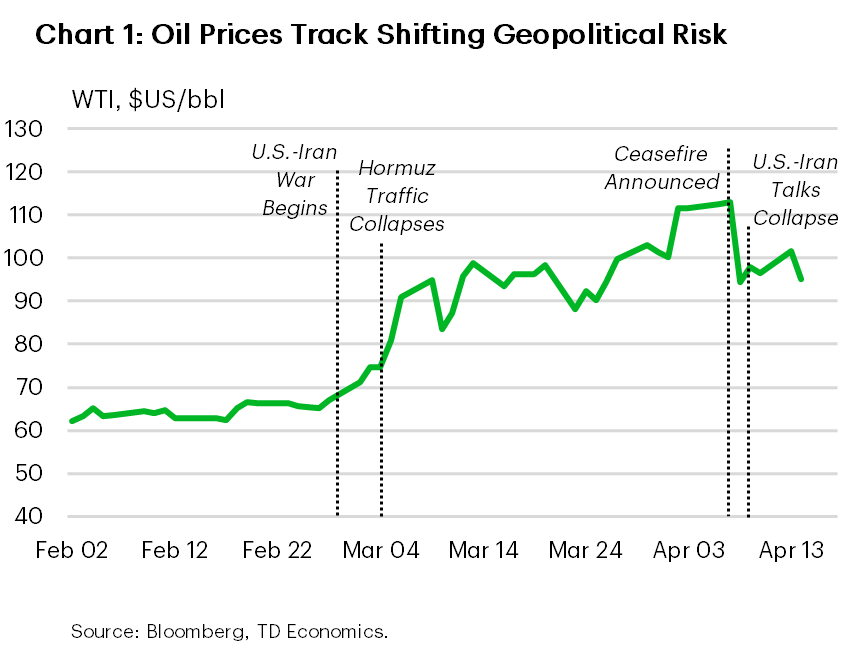
Oil markets have been reacting swiftly to recent developments. Upon receiving last week’s ceasefire news, WTI crude fell more than 16% in a single session while Brent dropped roughly 13%, marking one of the largest one‑day declines since the pandemic era. Prices quickly pared losses after the weekend’s failed negotiations with both benchmarks pushing back above $100/bbl. As of writing, prices once again dropped around 5% as markets price in the potential for second-round talks. Zooming out, both benchmarks are up nearly 40% since the onset of the war (Chart 1).
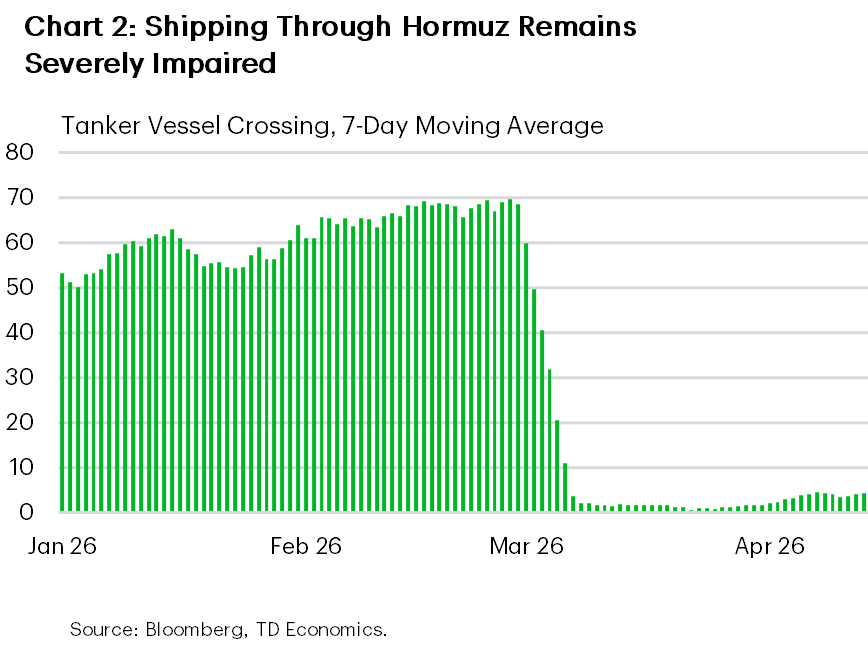
Amid the back and forth, shipping traffic through Hormuz remains effectively shut to tanker traffic. Recent estimates show that tanker movements continue to grind well below pre‑war levels due to security concerns and a backlog of stranded crude. Chart 2 shows that on a 7-day moving average basis, around 5 tankers per day are transiting the strait, a decrease of over 90% from pre-war levels. Insurance premiums and war‑risk surcharges also remain elevated, discouraging a rapid return of commercial shipping. Overall, the ceasefire has bought markets more time, but the path forward is still extremely muddy with negotiations still in deadlock.
Updated Oil Price Outlook
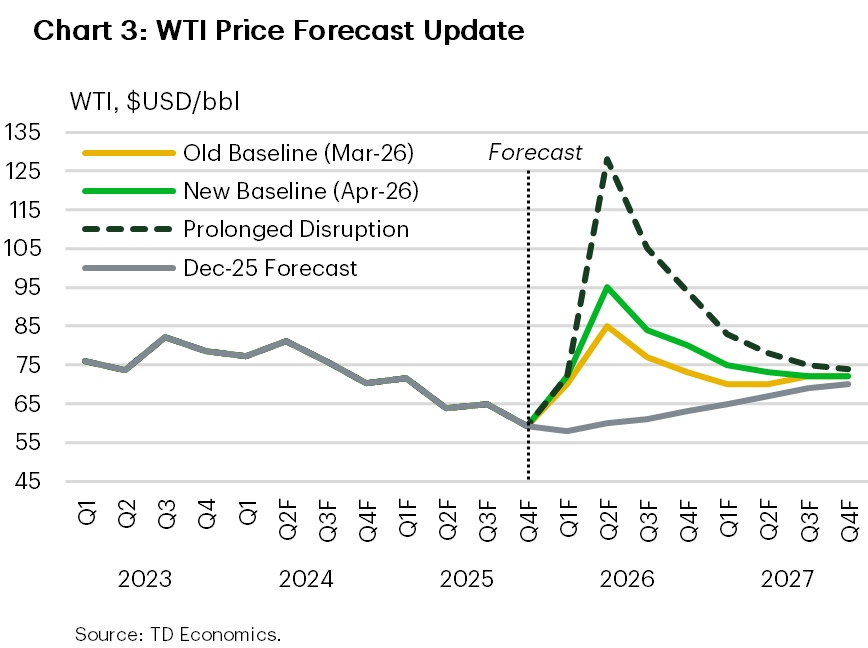
We have revised up our baseline WTI forecast from last month’s projection to better incorporate known risks and new developments (Chart 3).
- The ceasefire extends beyond the initial two week window but is frequently tested and/or violated at the margin.
- The two sides ultimately return back to the table, with a deal reached by early May.
- The U.S. naval blockade persists until a deal is reached. Some tankers are selectively allowed to transit through the Strait, but flows remain severely restrained until a deal is reached.
- Full Hormuz traffic flows recover only gradually over the remainder of this year. This is in line with a growing consensus that it could now take several months for a full normalization to take place in oil markets.
- Physical bottlenecks and insurance constraints ease incrementally.
Under these assumptions, we’d expect oil prices to trade around $100/bbl for the rest of April and start to trend lower thereafter. Still, prices are expected to remain elevated relative to pre‑war levels, in the $85-95/bbl range from May-September, before settling ~$80/bbl by year-end ($73/bbl in our prior forecast). We expect mid-to-low $70/bbl average pricing in 2027.
The new path reflects stickier residual risks, slower normalization, and a fundamentally tighter market by end of the year. While the oil market entered 2026 in a structural surplus, the war reversed that trajectory. According to major oil watching agencies, and even assuming a gradual normalization in exports and production, global oil balances are more likely to remain tight and undersupplied into late 2026 rather than reverting quickly back to surplus.
Prolonged Disruption Scenario Assumptions
Our March forecast outlined an alternative “prolonged disruption scenario” that we’ve also adjusted higher to reflect subsequent events. This scenario incorporates the following assumptions:
- Any renewed talks fail and the two week ceasefire collapses or expires without extension.
- Iran re-imposes strict controls on tanker traffic through the Strait, while insurers withdraw coverage.
- Strategic reserves are exhausted, failing to fill global shortage gaps
- Futures pricing skyrockets and physical markets get even tighter.
Under this scenario, crude oil benchmarks quickly retest recent highs ($120/bbl) before moving higher into May, especially if flows through Hormuz test March lows. We’d expect prices to peak close to $130/bbl in Q2 and hold above $90/bbl by the end of the year. A material share of the roughly 9–10 million barrels per day of export constrained supply (more on this in the next section) remains offline for an extended period in this scenario. Strategic reserves would also do little to cushion the blow, failing to offset a prolonged chokepoint disruption. Spillovers to refined products and global gas markets would also amplify inflationary pressures. For North America, demand destruction remains contained, though for countries more exposed, further escalation could tip the scales into recession.
Making Sense of the Supply Side
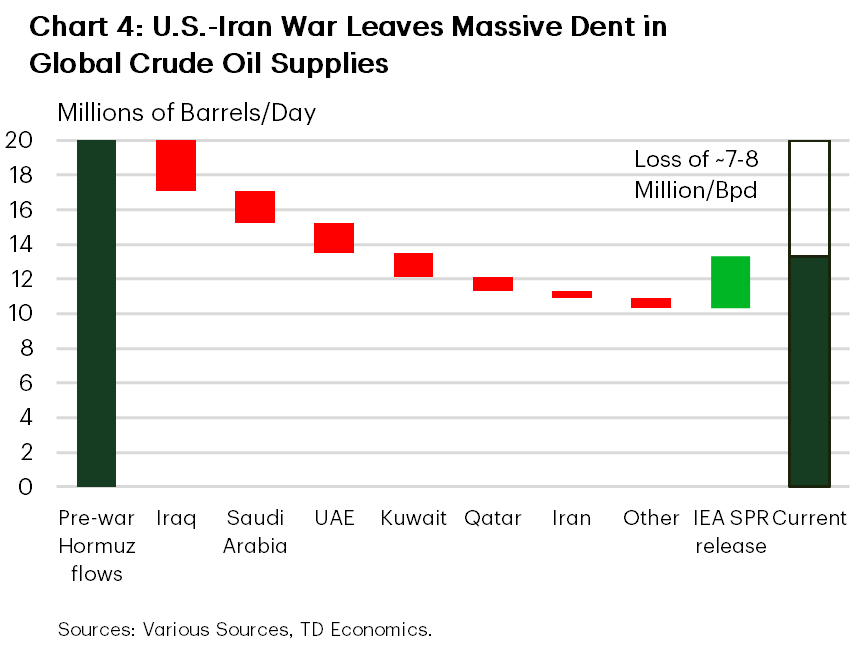
Barrel counting in this environment is unusually complex. Chart 4 illustrates the scale of the current oil supply disruption by tracing a path from the roughly 20 million/bpd of pre-war flows through the Strait of Hormuz to current effective supply. At present, we estimate that there are roughly 9-10 million/bpd of net export constrained volumes tied to the Gulf region. These figures capture reduced deliverability from countries including Iraq, Saudi Arabia, the UAE, Kuwait, Qatar, Iran, and smaller Gulf exporters. Importantly, not all volume has been lost outright; instead, it reflects a combination of export constraints, infrastructure damage, and storage limitations resulting in production shut-ins. Embedded in these country-level estimates are 4.5-5.0 million/bpd of pipeline bypasses that have cushioned part of the shock. Saudi Arabia has diverted production through the East West pipeline to the Red Sea, the UAE has utilized the Habshan–Fujairah route, and limited volumes have moved through Iraq’s northern export infrastructure.
Coordinated releases from strategic petroleum reserves (SPRs) are expected to provide some relief, albeit temporary. The coordinated release of roughly 400 million barrels from strategic petroleum reserves (SPRs), equivalent to about 3 million/bpd of supply for around 40–45 days, partially offsets the loss of deliverable oil. The SPR releases do not represent new production. Once reserves are drawn down, the underlying imbalance re-emerges unless physical trade flows normalize.
Putting these pieces together, the structural shortfall facing global oil markets is still in the order of 7–8 million/bpd on a temporary, SPR adjusted basis, and roughly 10–11 million/bpd once emergency stock releases are exhausted. This represents a sizeable 7-10% of global supply and exceeds the scale of notable past crises: the 1973 Arab oil embargo, the 1979 Iranian Revolution, the 1990 Gulf War, and the 2022 Russia‑Ukraine oil shock.
Oil benchmarks and the Brent–WTI spread
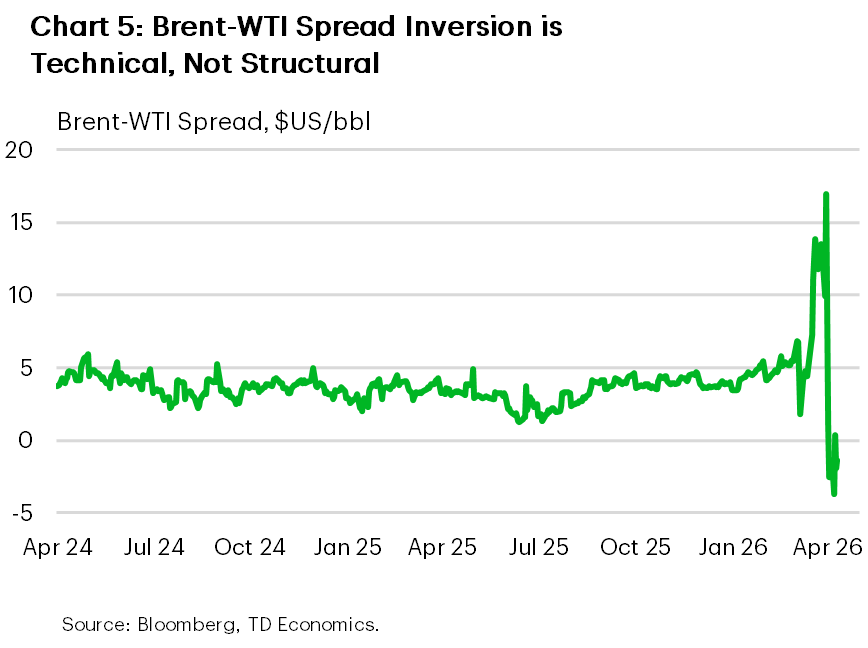
Brent prices, the global seaborne benchmark, continue to be disproportionally impacted by Middle East supply disruptions. The spread to its WTI counterpart widened to as much as ~$17/bbl in late-March and has averaged significantly higher than the $3–$5/bbl long run average. And so the recent tightening – and current inversion – in the Brent–WTI spread may somewhat confuse market watchers (Chart 5). The anomaly is largely due to a temporary futures contract mismatch and not a change in fundamentals.
Front month WTI futures are still referencing May delivery, while Brent futures have already rolled to June. This effectively means the widely quoted spread is comparing higher prized prompt barrels (WTI, May) against later dated supply (Brent, June). In the current deeply backwardated market, where near term barrels are commanding exceptionally large premiums, this mismatch mechanically skews the headline spread. Once futures’ references re-align in coming weeks, this technical effect should unwind, reinstating a wider Brent premium if underlying conditions remain unchanged. What’s more, when you align delivery months (e.g. June-June) Brent still trades at a premium to WTI.
It’s worth noting that below the surface, WTI has likely picked up a modest security premium, reflecting its status as an immediately accessible and more insulated source of supply. With no exposure to contested sea lanes and ample pipeline and export capacity, U.S. barrels remain a preferred alternative for now.
Beyond crude
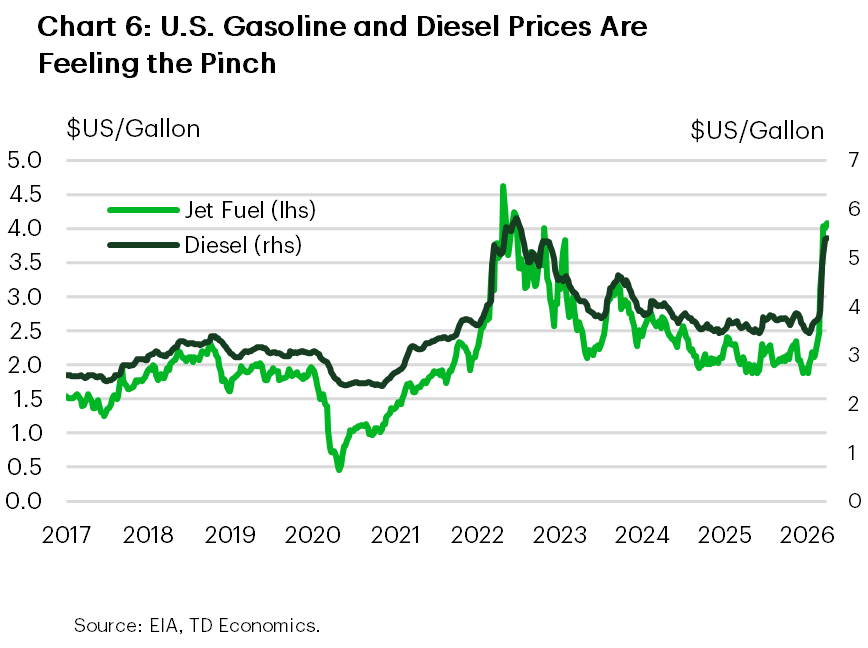
The fallout from the U.S.–Iran conflict is extending beyond crude oil into a broader set of globally traded commodities, with refined products, fertilizers, and natural gas among the most exposed. Within refined products, diesel and jet fuel stand out as key pressure points (Chart 6), with the former being more exposed given its central role in global freight and food supply chains. Gasoline markets are also at risk but have benefited from relatively healthier inventories in North America.
Global diesel balances are tight, particularly in Europe and parts of Asia. In the U.S., diesel prices have risen over 45% relative to pre war levels and now sit within about $0.20 per gallon of their 2022 peak. While the U.S. imports little diesel directly from the Middle East (less than 5%), it is a net exporter, meaning global shortages are quickly transmitted into higher domestic prices. If disruptions persist, diesel prices could push toward record highs near $6 per gallon. Given diesel’s outsized role as a fuel source across trucking, rail, and agriculture – as much as 70-80% of total use in these industries– price increases feed rapidly into goods inflation via higher transportation and input costs.
Fertilizers have emerged as another critical pressure point. The Gulf region accounts for a substantial share of globally traded nitrogen based fertilizers, including urea and ammonia, with an estimated 30–40% of global trade transiting the Strait of Hormuz. Prices have already responded sharply, with urea benchmarks up more than 50% in recent weeks. Given fertilizers’ central role in crop production, sustained disruptions raise the risk of lower yields and higher global food prices over the near term.
Natural gas markets have also been affected, primarily through disruptions to Qatari LNG exports, which normally account for roughly one fifth of globally traded LNG. Damage at key facilities and lingering maritime risks have materially constrained LNG flows, pushing Asian spot prices higher and reducing flexibility for Europe ahead of the storage refill season. U.S. gas markets have been more insulated due to domestic oversupply and export flexibility, but European benchmarks (TTF) have risen sharply, albeit remaining well below 2022 peaks.
Beyond energy markets, spillovers are visible in freight and insurance. War risk premiums for vessels operating in the Gulf have increased sharply, effectively acting as a tax on energy trade and pushing up delivered prices even where benchmark prices have eased. Secondary risks are also emerging in helium supplies, agricultural commodities, and industrial inputs like aluminum, underscoring that the conflict’s inflationary impulse extends well beyond crude oil alone.
Bottom Line
The ceasefire has reduced the risk of an immediate supply shock, but failed negotiations has kept the floor under oil prices firmly elevated. With export constraints through Hormuz still binding and a structural supply shortfall equivalent to roughly 7–10% of global production, the market has shifted decisively out of the pre war surplus it was heading into in 2026. Even under gradual normalization, oil balances remain tight, volatility elevated, and upside risks skewed should the truce falter.
Disclaimer
This report is provided by TD Economics. It is for informational and educational purposes only as of the date of writing, and may not be appropriate for other purposes. The views and opinions expressed may change at any time based on market or other conditions and may not come to pass. This material is not intended to be relied upon as investment advice or recommendations, does not constitute a solicitation to buy or sell securities and should not be considered specific legal, investment or tax advice. The report does not provide material information about the business and affairs of TD Bank Group and the members of TD Economics are not spokespersons for TD Bank Group with respect to its business and affairs. The information contained in this report has been drawn from sources believed to be reliable, but is not guaranteed to be accurate or complete. This report contains economic analysis and views, including about future economic and financial markets performance. These are based on certain assumptions and other factors, and are subject to inherent risks and uncertainties. The actual outcome may be materially different. The Toronto-Dominion Bank and its affiliates and related entities that comprise the TD Bank Group are not liable for any errors or omissions in the information, analysis or views contained in this report, or for any loss or damage suffered.
Download
Share: