Unpacking Ontario’s Consumption Resilience
Rishi Sondhi, Economist | 416-983-8806
Date Published: March 13, 2024
- Category:
- Canada
- Provincial & Local Analysis
Highlights
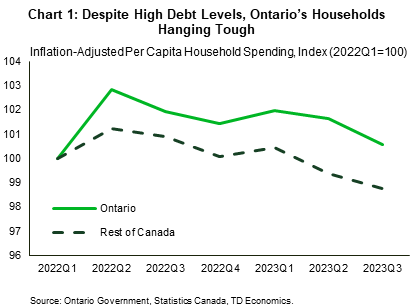
- Despite high household debt levels, per capita consumption has held up better in Ontario than the rest of Canada. Support has come from services and durables spending.
- However, we don’t think this can be sustained, given the prospect of a soft job market, weaker population gains and less pent-up services demand. Slower consumption growth in Ontario should keep its economy underperforming Canada’s over the forecast horizon.
The Ontario Economic Accounts are painting a story of resilience in household spending for the province. Now, by no means is it strong, having seen roughly no growth in the second and third quarters of 2023 (before some improvement likely took place at the end of last year). However, in per capita terms, Ontario’s consumption has apparently held up slightly better than the rest of Canada since the Bank of Canada began hiking interest rates (Chart 1).
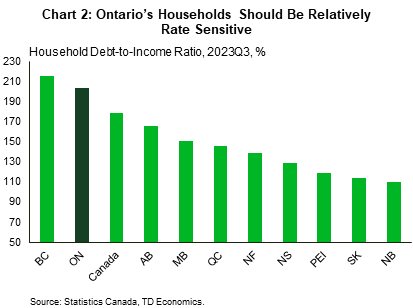
This is surprising, as households in Canada’s largest province are the second most indebted of any region in the country (Chart 2). Ontario’s unfavourable standing in this regard stems from some of the worst housing affordability conditions in the country, which has caused buyers and renters to stretch their budgets in recent years. These high debt levels imply a heightened sensitivity of households to borrowing costs, as homebuyers renew these expensive mortgages at elevated interest rates, forcing them to divert more of their disposable income towards servicing these costs. Ontario’s consumption resilience is made more peculiar by the fact that housing – the most sensitive interest rate category – has buckled much more in Ontario than the rest of the country under the weight of high borrowing costs.
What Has Driven This Resilience

Digging under the hood, two broad household spending categories have been responsible for Ontario’s relative resilience, according to Ontario government data (Chart 3).
The first is services spending, which, in per capita terms increased 4.2% from 2022Q1 through 2023Q3 (covering the period when the Bank of Canada first started hiking their policy rate, to the last period of available expenditure data for Ontario). This compares to a 1% gain for the rest of the country over the same time. In terms of what supported Ontario’s outperformance, it would be tough to argue that it was the job market, as employment increased at nearly the exact same rate in Ontario as it did in the rest of Canada from 2022Q1 – 2023Q3. What’s more, Ontario lagged in terms of per capita personal disposable income growth over this period. Slightly stronger growth in employee compensation was offset by weaker growth in other income sources, such as interest made on investments and dividend payments. Also, recall that the Ontario government wasn’t as generous as other provinces in delivering “inflation-relief” payments to households.
So, what has driven this growth? In our view, services spending in Ontario was merely playing catch-up to the rest of the country in terms of getting back to pre-pandemic levels, with this spending likely funded in part through a savings drawdown in Ontario. Recall that Ontario kept a much tighter leash on its services industry than other provinces for almost the entire pandemic. As such, Ontario’s per person services spending was nearly 4% below its pre-pandemic level heading into the Bank of Canada’s rate hiking campaign, versus a gap closer to 2% for the rest of Canada.
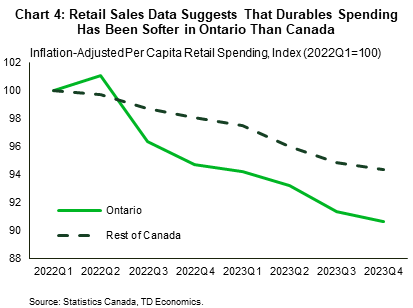
The other broad category where Ontario has outperformed in per person terms is durables consumption. Here, we find the story told by the Ontario government data to be less convincing than on the services side. According to the data, per capita durables spending in Ontario is down about 2.5% since the Bank of Canada began hiking rates, versus a 5% drop in the rest of the country. However, Statistics Canada’s retail spending data is telling a more dour story for the province (Chart 4). Most durables spending comes through purchases of motor vehicles and parts, as well as furniture and other appliances. Here, the retail spending data is much weaker for Ontario than the rest of Canada since the first quarter of 2022 and suggests to us that that this category could be downwardly revised in subsequent releases of the Ontario Economic Accounts.
Will Household Spending in Ontario Remain Comparatively Sturdy?
In our view, the answer is no. However, our internal TD spend data (which tracks debit and credit card transactions) suggests that consumption got off to a decent start to the year in Ontario. As such, spending underperformance in the province could manifest after the very near-term.
As to what underpins this view, note that per capita services expenditure in Ontario has largely caught up to the rest of Canada, in terms of its distance from its pre-pandemic level. This suggests that its contribution to Ontario’s prior spending outperformance has likely run its course. Without this offset, the impact of elevated borrowing costs on Ontario’s per capita and overall consumption should be more apparent. Again, note the relative weakness in Ontario’s retail spending data – much of which captures rate-sensitive durables spending – and its housing market.
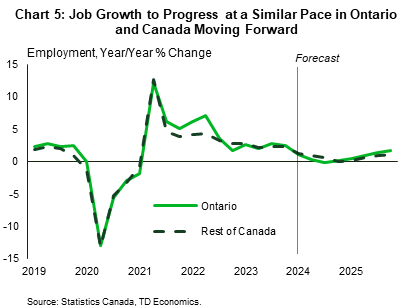
Looking at other drivers of consumption, we project Ontario’s employment growth to be weak, and run largely in line with the rest of the country (Chart 5). So, no material offset from the impact of higher rates is likely to be found in Ontario’s job market. Population growth might also be a touch softer in Ontario than the rest of Canada, as the impact of the federal cap on international students could be more pronounced in the province. Note that Ontario’s student intake has been relatively robust recently.
One area that has been stronger-than-expected in recent months has been Ontario’s housing market, both in sales and prices. Support has come from favourable weather, lower-than-expected interest rates, and a considerable amount of pent-up demand that has returned faster-than-expected. Upgraded housing market activity would naturally offer some boost to consumption in Ontario through housing-related spending. However, our modelling suggests that this factor alone would be unlikely to move the dial on consumption in a meaningful way, particularly with ultra-strained housing affordability likely to limit the degree of growth in Ontario’s housing market moving forward.
Bottom Line
Ontario’s housing consumption has held up better-than-the rest of Canada, even in per capita terms. However, there are good reasons to fade this resilience moving forward, including the prospect of slower population growth, less pent-up services demand, and, most importantly, a heighted sensitivity to elevated borrowing costs amid high household debt levels. We see Ontario’s consumption growth underperforming moving forward, which should keep its overall GDP growth below that of Canada’s over the projection horizon.
Disclaimer
This report is provided by TD Economics. It is for informational and educational purposes only as of the date of writing, and may not be appropriate for other purposes. The views and opinions expressed may change at any time based on market or other conditions and may not come to pass. This material is not intended to be relied upon as investment advice or recommendations, does not constitute a solicitation to buy or sell securities and should not be considered specific legal, investment or tax advice. The report does not provide material information about the business and affairs of TD Bank Group and the members of TD Economics are not spokespersons for TD Bank Group with respect to its business and affairs. The information contained in this report has been drawn from sources believed to be reliable, but is not guaranteed to be accurate or complete. This report contains economic analysis and views, including about future economic and financial markets performance. These are based on certain assumptions and other factors, and are subject to inherent risks and uncertainties. The actual outcome may be materially different. The Toronto-Dominion Bank and its affiliates and related entities that comprise the TD Bank Group are not liable for any errors or omissions in the information, analysis or views contained in this report, or for any loss or damage suffered.
Download
Share: