Canadian Wages:
Unionized Workers Bargaining For Their Share
Marc Ercolao, Economist
Date Published: November 23, 2023
- Category:
- Canada
- Labour
- Commodities & Industry
Highlights
- Unionized industries are striking with greater intensity and successfully negotiating higher wages. This comes after union wage growth had lagged their non-unionized counterparts over the better part of the last two years.
- Total wage growth in Canada is still too high. We expect wages to moderate as labour markets continue to find their balance, but rising union wages may delay this moderation.
- The risk to the inflation outlook is not wage growth itself, but through productivity-adjusted wages, or unit labour costs. The inertia in union wage settlements, coupled with a bleak near-term outlook for Canadian productivity, is one avenue preventing inflation from falling quicker.
- This will not derail the Bank of Canada’s effort to get inflation back to target, but it will remain on their radar.
The Canadian economy is evidently slowing but some areas are holding up better than others. A shining example of resilience are economy-wide wage gains which have been stuck at a relatively heated 5% year-on-year (y/y) since mid-2022. While this pace is down from a pandemic peak of 8% y/y, it remains more than twice as high as the 2011-19 average. Moreover, based on current productivity trends, the current pace of wage growth is even more unsustainable and inconsistent with the central bank’s 2% inflation target.
Looking ahead, we anticipate wage growth to cool in the coming months as employment slows, unemployment tracks higher, and job vacancies decline. However, a key uncertainty around the wage outlook relates to the extent to which unionized industries successfully negotiate higher wages, thus delaying the expected moderation. Notably, the cost-of-living crisis and historic acceleration in inflation over the past few years has driven workers to demand significant wage gains this year.
Less Unionized, More Wage Growth
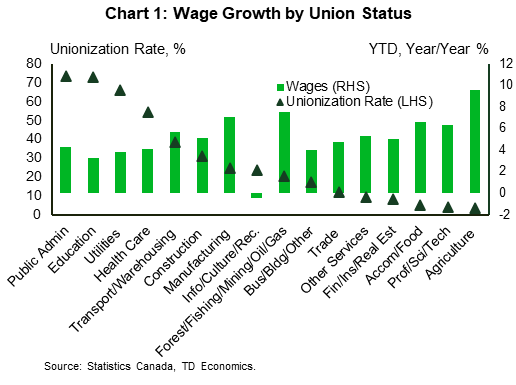
Wage strength in Canada this year is being disproportionally driven by industries with less union representation. In fact, Chart 1 illustrates a fairly strong negative relationship between unionization rates and year-to-date (YTD) wage growth across industries. To put it in context, the economy-wide 5.1% YTD wage growth figure is significantly outpacing the 3.9% average wage growth in the four industries that are over 50% unionized. The least-unionized sector, agriculture, has the highest rate of YTD wage growth at 9.6%. The forestry/fishing/mining/oil/gas and manufacturing sectors have the second and third highest rates of wage growth, respectively, outpacing wage gains in industries with similar unionization rates. Further, the one-third of Canadian industries that are under 10% unionized have average YTD wages running at a hot 6.6%. Lastly, the education sector, which is the second most unionized industry, ranks last in terms of wage growth this year, excluding the information, cultural, and recreation industry, the only industry with falling YTD wages.
As the labour market shifts into excess supply, many of these industries, especially ones less unionized, should see wage growth slacken. But the question relates to timing, and in particular, how recent rising strike activity and elevated union wage settlements feed into union sector wages and delay the slowdown in aggregate wages into next year.
Canada is Heavily Unionized
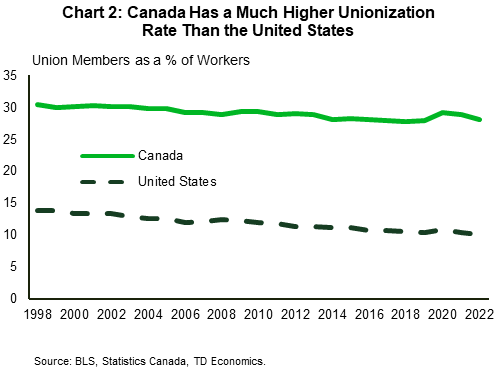
Unionized workers account for roughly one-third of Canada’s labour force. While this share has trended slightly downward over the years, it is significantly higher than the unionization rate south of the border (Chart 2). Wages of unionized workers in Canada therefore exert more influence on the total wage structure of the economy. Despite clear signs of a slowing economy, the labour market hasn’t fully ceded its strength. Job vacancies are still elevated, monthly employment is gaining at a brisk clip, and the unemployment rate is still moderate by historical standards. At a time where many collective agreements are coming due, bargaining power is now strongly in the hands of unionized employees.
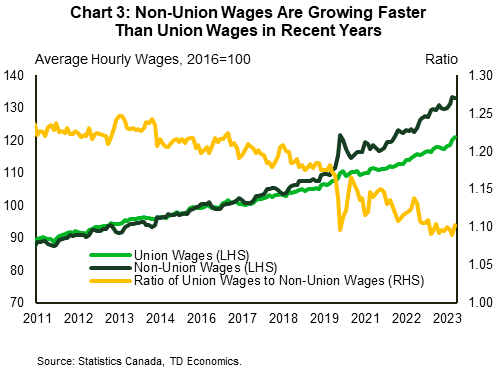
The level of unionized wages has historically been higher than those of their non-union counterparts. This is due in large part to compositional effects, where highly unionized industries are less exposed to minimum wage policies. Since 2017, non-union wage growth has risen faster than union wages, closing that gap. This growth outperformance was exacerbated further since the onset of the pandemic (Chart 3). Preceding 2017, union wages maintained an average hourly wage rate spread of $4–5 above non-union wages – this spread has since narrowed to $3/hour in 2023. Given the current state of Canada’s labour market, there is a case to be made that wages of unionized employees will restore their historical outperformance via renegotiated wage settlements.
Striking by The Numbers
The number of Canadians hitting the picket lines should be of no surprise as wage growth of unionized employees has lagged inflation. In fact, a disproportional brunt was bore by unionized employees who were more affected in the early stages of the inflation run-up. High profile strikes this year include the two-week Public Service Alliance of Canada (PSAC) strike that saw 155,000 federal public servants walk off the job. In early July, over 7,000 BC port workers put a halt to their work for 13 days, causing a disruption to around 25% of Canadian trade. Soon after, 3,700 Metro workers walked off the job for nearly a month. Most recently, nearly 600,000 public sector workers in Quebec represented by various unions are holding short-term strikes, with indefinite extensions promised if negotiations fail.
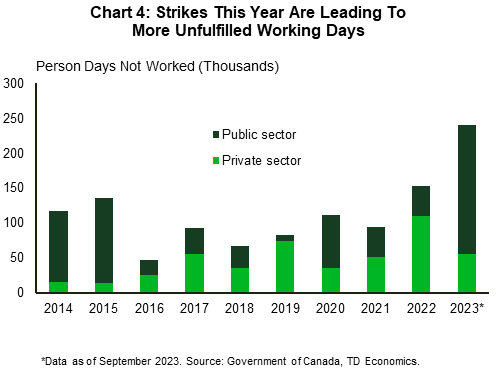
Strikes staged this year are carrying more economic consequences than in years past. This can be measured from a ‘person days not worked’ perspective, which multiplies the duration of strikes in working days by the number of employees involved. By this measure, and with only three quarters of data for the year, person days not worked is already outpacing those in past years by a significant margin (Chart 4). These unfulfilled working days are being driven primarily by public sector striking. Overall, this gives more incentive for unions and governments to ink favourable deals quicker to prevent destruction of overall economic activity.
Union Wage Settlements Are at Multi-Decade Highs
For technical purposes, the wage information on collective bargaining negotiations and settlements pertain to all bargaining units covering 500 or more employees in all industries and jurisdictions across Canada. There are over 1,000 such agreements covering approximately 2.5 million employees.
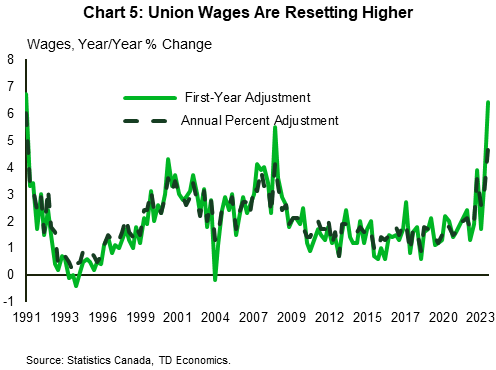
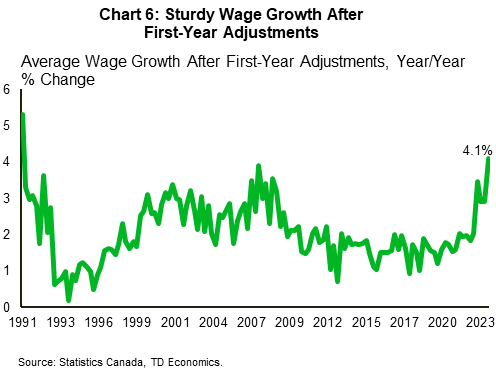
Quarterly data show that first-year wage adjustments of renegotiated multi-year contracts have reached 6.4% as of Q3-2023, their highest level since 1991. It is typical for first-year adjustments to be higher than the following contract years to compensate for lost purchasing power from previous cost of living adjustment (COLA) clauses that evidently undershot expected inflation. Further, the annual average wage adjustment over the entire duration of renegotiated agreements has pushed up to 4.7% as of Q3-2023, also the highest level since 1991 (Chart 5). For reference, union contracts are extended for 3-4 years on average. Using this data, calculated average wage growth of multi-year contracts after first-year wage adjustments has moved up to 4.1%. This is a good measure to assess the sturdiness of wage gains further into the contract’s years net of first-year effects. As a result, unionized workers are beginning to cement years of aggressive wage gains above the BoC’s target (Chart 6).
So long as labour markets don’t undergo material deterioration, there is reason to believe that striking activity and elevated wage settlements could persist over the near-term. Our forecasts project the national unemployment rate to peak at 6.7% by Q3-2024 as employment growth slows and the supply of available workers expands. By this point, inflation should also be firmly sporting a two-handle. This is the point where we should see employers regaining the upper hand in negotiations, allowing wage settlements to moderate back to average levels.
Wages, Inflation, and Productivity
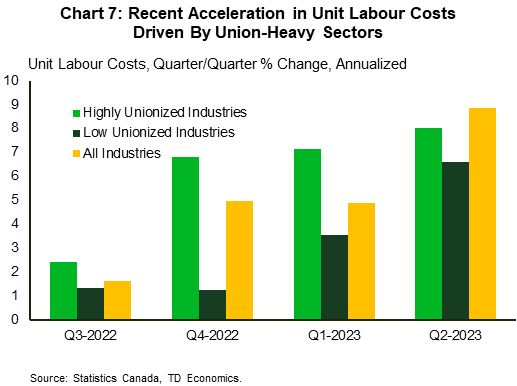
Productivity has been the Achilles heel of the Canadian economy in recent years, falling over the last 11 of 12 quarters. The risk to the inflation outlook is not aggregate wage growth itself, but through productivity-adjusted wages, or unit labour costs (ULC). Broadly separating industries into high vs low rates of unionization shows that, over the last four quarters, ULCs of union-heavy industries have risen at a faster clip (Chart 7).
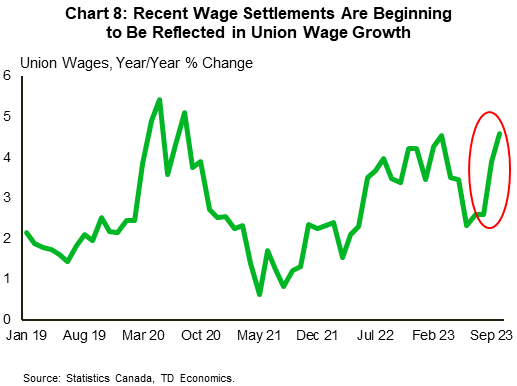
Against the backdrop of weak productivity trends, a case that seems highly likely to continue in the near-term, nominal wage growth would need to decelerate to 2-3% to bring ULCs close to the BoC’s 2% inflation target. Given the inertia in union wage settlements, and early evidence of the feed into the uptick in union wages (Chart 8), a near-term slowdown to within this range becomes a more difficult achievement. This is a risk the BoC will monitor as it continues to communicate higher-for-longer interest rates.
Bottom Line
A slackening in the job market conditions should ultimately feed through to more moderate wage growth in Canada in the coming months. Still, the degree and extent remain an open question. Recently negotiated union wage settlements highlight one area of ongoing upside wage pressure that is likely to have some staying power. And while stickiness on this front is not expected to derail the Bank of Canada’s efforts to eventually get inflation back to target, it will be one source preventing inflation from dropping faster.
Disclaimer
This report is provided by TD Economics. It is for informational and educational purposes only as of the date of writing, and may not be appropriate for other purposes. The views and opinions expressed may change at any time based on market or other conditions and may not come to pass. This material is not intended to be relied upon as investment advice or recommendations, does not constitute a solicitation to buy or sell securities and should not be considered specific legal, investment or tax advice. The report does not provide material information about the business and affairs of TD Bank Group and the members of TD Economics are not spokespersons for TD Bank Group with respect to its business and affairs. The information contained in this report has been drawn from sources believed to be reliable, but is not guaranteed to be accurate or complete. This report contains economic analysis and views, including about future economic and financial markets performance. These are based on certain assumptions and other factors, and are subject to inherent risks and uncertainties. The actual outcome may be materially different. The Toronto-Dominion Bank and its affiliates and related entities that comprise the TD Bank Group are not liable for any errors or omissions in the information, analysis or views contained in this report, or for any loss or damage suffered.
Download
Share: