From Border Blues to Local
Boom: Canada’s 2025 Tourism
Spending Outlook
Anusha Arif, Economist
Date Published: June 26, 2025
- Category:
- Canada
- Commodities & Industry
Highlights
- Tourism spending in Canada is expected to grow in the modest range of 2-4% in 2025.
- American spending is set to exert a drag on the overall tally this year. U.S. visits are falling amid trade tensions and economic uncertainty, with cross-border spending projected to decline by 5-10% this year.
- However, lower U.S. spending is expected to be offset by a rise in Canadian domestic tourism outlays as many residents redirect all or part of their travel budgets to the home market. Moreover, spending by non-U.S. international tourists in Canada is also likely to turn in a gain, even if only slight.
Heading into peak summer travel season, many eyes will be on the performance of Canada’s tourism sector as it navigates a number of crosscurrents. On one side, visits from U.S. travelers are trending downwards amid ongoing trade tensions. On the flipside, the sector appears set to benefit from a continued rise in non-U.S. international visitors and, more importantly, solid gains in Canadian domestic travel. Predicting the overall fortunes of the sector will be determined by which of these two forces wins out.
We estimate that total tourism spending1 in Canada (in nominal dollars) is on track to rise by 2-4% in 2025. While seemingly modest, especially when compared to the 15% annual gains recorded during the post pandemic rebound, it would still be a resilient outcome during a year when many other Canadian sectors will likely struggle to grow. Importantly, this outlook compares favorably to the situation in the U.S. where international visitor spending alone is projected to fall by roughly 7% in 2025.2
Snapshot of Canadian Tourism Industry
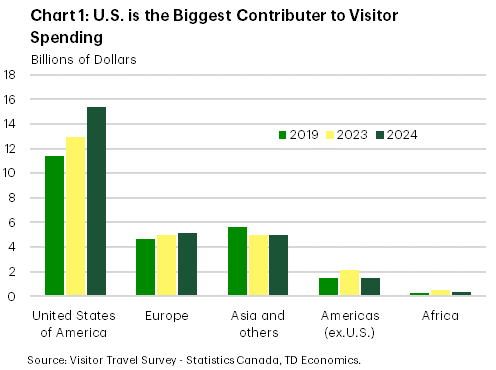
In 2024, approximately $100 billion was spent on tourist-related activities in Canada, encompassing both personal and business travel by residents and non-residents.
About three quarters of this tally is attributable to Canadians shelling out for domestic travel. Statistics Canada derives its estimate of domestic travel spending from its National Travel Survey, which includes everything from short trips of as little as 40 km in distance to longer-haul trips. Moreover, it includes personal and business-related outlays. That leaves about one quarter from in-bound international travel spending. U.S. visitors have long been the bedrock of international tourism in Canada, accounting for four out of five non-resident trips and contributing a record $15 billion in 2024, which is more than all other nations combined.
Canada’s tourism sector faced an unprecedented contraction in 2020, with spending plunging by over 50%. Since then, the sector has turned in a swift recovery, with American spending leading the charge internationally (Chart 1). In contrast, the share of international spending outside U.S. remains below pre-pandemic levels. Given its sheer heft, domestic spending has been the primary driver of the overall travel recovery. Relative to 2019, the number of local Canadian visits were up 6% last year, and total outlays up 30%.
U.S. Visits in Decline
Shifting to this year’s outlook, let’s start with the bad news – the declining trend in U.S. visits. Trade tensions, uncertainty surrounding the economy and weakness in the U.S. dollar this year are weighing on American travel plans. In May, U.S. resident car trips to Canada declined by 8.4%, marking the fourth consecutive month of year-over-year declines.3 Border-dependent communities and businesses are bearing the brunt. Duty-free shops, restaurants and retailers near key crossings report alarming drops in traffic and, in some cases, up to 80% decline in sales.4
Looking ahead, we do not anticipate much improvement in U.S. arrivals until the tail end of 2025. By that time, some of the current trade tensions and storm clouds hovering over the U.S. economy are expected to dissipate. For 2025, we are penciling in a decline of 5-10% in U.S. spending in Canada, amounting to a drop of approximately $1 billion relative to 2024.
Other International Visits Bucking the U.S. Trend
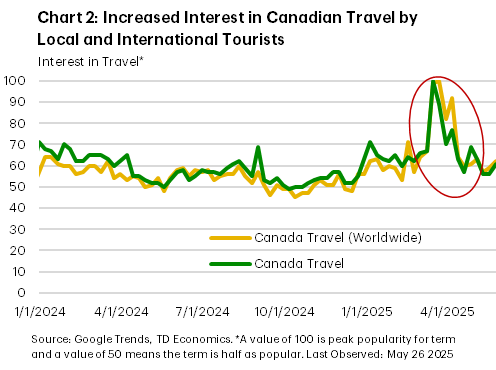
On the brighter side, non-U.S. international travel to Canada is picking up. Google Trends data shows growing global and local interest in Canada as a travel destination, with a spike in travel related searches in March and April (Chart 2). While not a direct proxy for bookings, the uptick aligns with actual numbers. In April, visits from the United Kingdom rose by 14%, Mexico by 22% and, in May, China saw an 11% gain year-on-year. These visitors still represent a small slice of the total, but the trend is promising, especially as U.S. tensions push tourists to consider Canada as an alternative destination. We are assuming these trends prevail in the months ahead, which would deliver around a modest increase in spending of about $0.3 billion in 2025.
A Critical Buffer by Canadian Domestic Travel
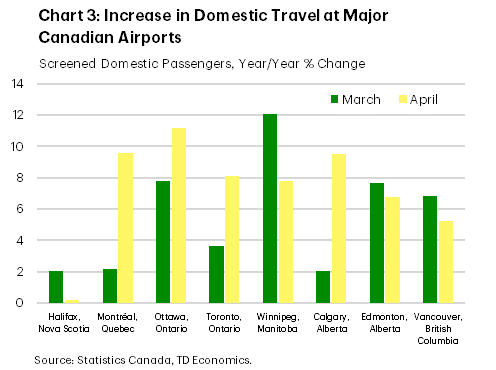
The larger offset to declining U.S tourism is expected to come from Canadians themselves, notwithstanding ongoing worries around the near-term economic outlook. Travel within Canada is being supported by shifting preferences. While hard data is still sparse, early indicators are encouraging. In particular, Airbnb reported a nearly 20% increase in domestic travel searches.5 According to a survey by TD Bank Group, 64% Canadians plan to travel domestically.6 This is underpinned by data on passenger volumes on domestic flights which also rose 7.4% year-on-year in April, indicating a continued increase in Canadians flying within their homeland (Chart 3). Hotel occupancy data, though mixed across the country, reinforces this domestic shift. Canada’s national occupancy rate in April stood at 63%, a slight decline from 2024, yet strong provincial performance in key leisure destinations highlights domestic resilience. For instance, in British Columbia, hotel occupancy hit 68.7%, the highest among provinces.7 In addition, government initiatives like the “Canada Strong Pass” which offer a widespread free and discounted access to national parks, museums and VIA Rail, alongside reduction of the carbon tax effective April 1st, are collectively making 2025 a more appealing year for local travel.
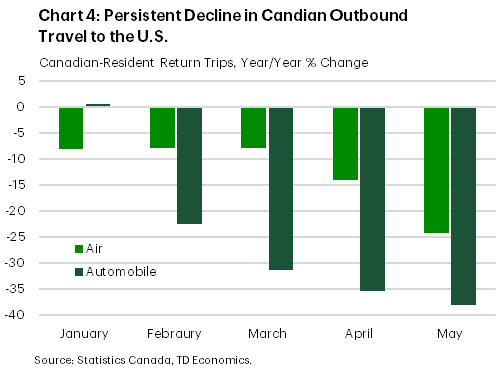
At the same time, Canadians have also shifted away from U.S. travel in larger numbers. While trips by Americans into Canada have declined, the drop in Canadian outbound travel to the U.S. has been far more pronounced. In May, Canadian-resident return trips from the U.S. were down by an oversized 38% by automobiles and 24% by air (Chart 4). There are reports that “snowbirds”, many of whom are high-income spending individuals, cancelled trips and some adjusted their travel plans this year to spend more time in Canada.8 Any reallocation of spending from regions like Florida or Arizona to Canadian markets could provide a substantial boost to the domestic tourism sector.
Despite the resilience of the Canadian consumer so far this year, some risks remain. Weakness in the job market and broader economic uncertainty are likely to weigh on domestic travel spending plans this year. While, “Buy Canada” sentiment remains strong, it will probably not be enough to deliver a standout year. Having said that, provided that the tariff-related headwinds on the economy and consumer confidence start to ease in the coming months, there is still good reason to expect some moderate growth on the order of 4% (or + $3 billion) by Canadians on travel-related activities in 2025.
Bringing it All-Together
Canada’s tourism sector is undergoing significant shifts and its overall spending fortune for 2025 hinges on the balance of two opposing forces: namely a decline in U.S. inbound spending versus the resilience of domestic and non-U.S. international spending. As our analysis suggests, the decrease in U.S. visitors is likely to be fully offset by growth in these other sources, delivering an overall net increase of $2 to $4 billion in overall tourism spending for 2025. Propelled by these tailwinds, Canada’s tourism sector could hold up far better than what otherwise would be the case in 2025.
Looking ahead to 2026, the stage is set for a pivotal year. Domestic spending is anticipated to remain robust and there is a strong possibility of renewed inbound U.S. travel. Canada’s role as co-host of the 2026 FIFA World Cup also offers a historic opportunity to elevate its global tourism profile. This major international event is projected to host vast visitor numbers across the country providing a boost to GDP and employment income. With preparations already underway, 2025 may just be the warm-up act for what could be a strong year in Canadian tourism.
End Notes
- Total tourism spending includes business and personal spending from the National Travel Survey and Visitor Travel Survey.
- https://wttc.org/news/us-economy-set-to-lose-12-5bn-in-international-traveler-spend-this-year
- All arrival data till April uses full counts from “Travel between Canada and Other Countries”. All May data uses preliminary counts from “Leading Indicator of International Arrivals to Canada”.
- https://www.theglobeandmail.com/business/article-duty-free-shops-see-sales-plummet-as-travellers-avoid-us/
- https://news.airbnb.com/canadian-2025-spring-travel-trends/
- https://www.travelpulse.ca/news/destinations/64-of-canadians-plan-to-travel-within-canada-this-summer-survey-finds
- https://str.com/press-release/canada-hotels-reported-mixed-performance-april
- https://www.ctvnews.ca/canada/article/canadas-snowbirds-reconsider-calling-the-us-their-second-home/
Disclaimer
This report is provided by TD Economics. It is for informational and educational purposes only as of the date of writing, and may not be appropriate for other purposes. The views and opinions expressed may change at any time based on market or other conditions and may not come to pass. This material is not intended to be relied upon as investment advice or recommendations, does not constitute a solicitation to buy or sell securities and should not be considered specific legal, investment or tax advice. The report does not provide material information about the business and affairs of TD Bank Group and the members of TD Economics are not spokespersons for TD Bank Group with respect to its business and affairs. The information contained in this report has been drawn from sources believed to be reliable, but is not guaranteed to be accurate or complete. This report contains economic analysis and views, including about future economic and financial markets performance. These are based on certain assumptions and other factors, and are subject to inherent risks and uncertainties. The actual outcome may be materially different. The Toronto-Dominion Bank and its affiliates and related entities that comprise the TD Bank Group are not liable for any errors or omissions in the information, analysis or views contained in this report, or for any loss or damage suffered.
Download
Share: