Highlights
- Toronto’s unemployment rate has jumped nearly 3.5 ppts from its post-pandemic lows, to nearly 9%. That has far outstripped increases recorded in the rest of Ontario and left the region with the fourth highest unemployment rate among Canada’s major urban areas.
- Up until recently, rising joblessness in Toronto was largely a function of sizzling labour force gains. However, in 2025, a sharp slowdown in hiring momentum has been a more pronounced driver, reflecting idiosyncratic factors, a weak homebuilding industry and the trade war.
- The widening gap between Toronto’s unemployment rate and the rest of Ontario’s has been particularly pronounced among young workers. At present, a concerning one-in-five youths in Toronto’s labour market are unemployed. Several reasons could explain this, including a weak economic backdrop that’s forcing older workers to take part-time jobs in industries that traditionally skew younger in their hiring practices.
- With labour force growth cooling more sharply in Toronto, the gap between it and Ontario’s unemployment rate could narrow through next year, although it may remain above average. That said, unemployment rates in both jurisdictions are likely to move lower than their 2025 level.
Toronto, as Canada’s largest city and a key economic hub, plays a crucial role in the national economy. In 2021, the Toronto Census Metropolitan Area (CMA) contributed approximately 20% of Canada’s GDP, over half of Ontario’s GDP, and currently employs about one-fifth of the nation’s workforce. Ontario also makes up roughly 40% of federal government revenues, with Toronto supplying a substantial portion of this total.
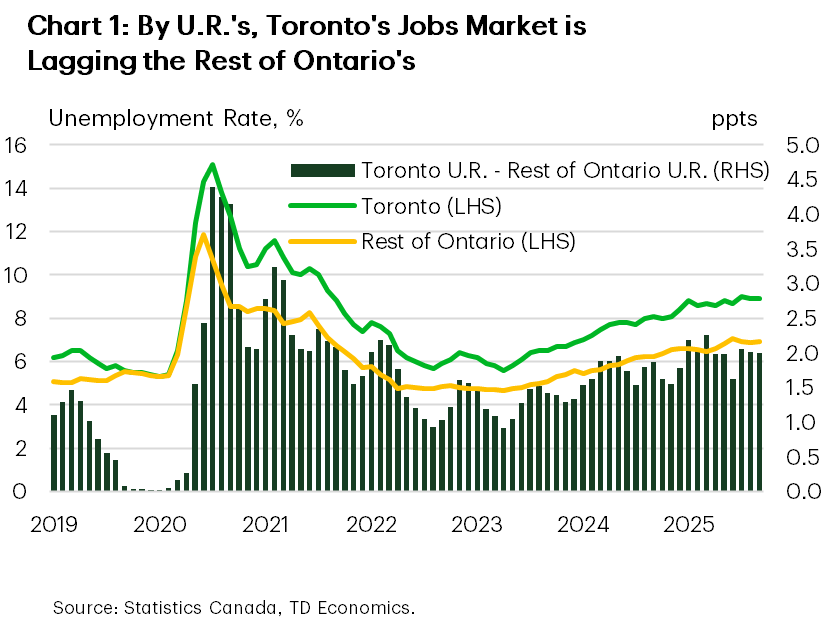
However, the region’s labour market has been sputtering recently. Indeed, the city is currently facing challenges in absorbing the influx of individuals entering the labor force. After bottoming out at 5.6% in April of 2023, Toronto’s unemployment rate shot higher last year and has continued to grind higher in 2025. It currently sits at 8.9% as of September, near the highest level since 2012 (outside of the 2020/2021 post-pandemic pop).
Toronto’s unemployment rate was the fourth highest of the 41 major CMAs in Canada reported in the Labour Force Survey in September. Within the province, only Windsor (which is even more in the crosshairs of the Canada-U.S. trade war) and Brantford (which has seen extremely strong labour force growth) have higher unemployment rates. Interestingly, the gap between Toronto’s unemployment rate and the rest of Ontario’s started to consistently widen in the beginning of 2024. In September of this year, the gap stood at an above average 2.0 ppts (Chart 1). In this note, we examine the reasons behind the growing divide in job market outcomes between Toronto and the rest of the province.
Population Growth a Key Factor
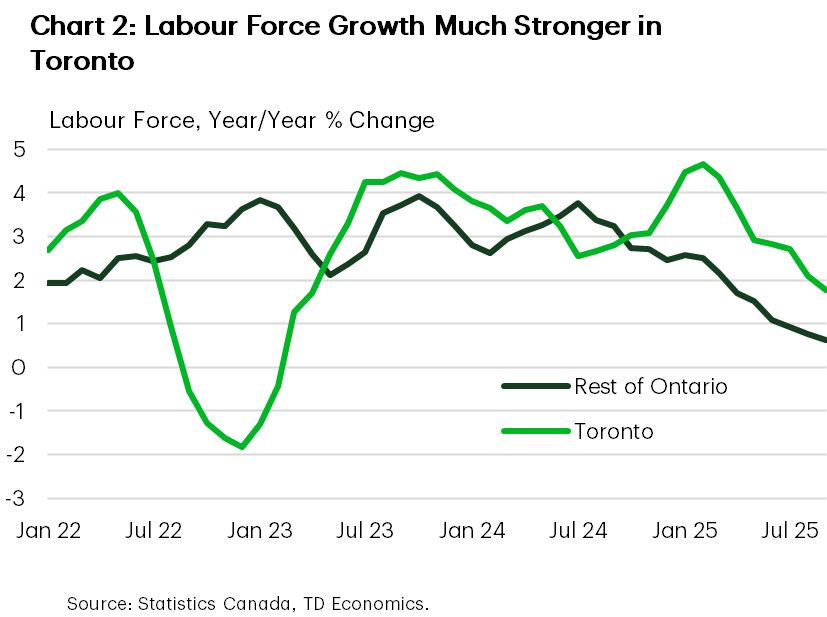
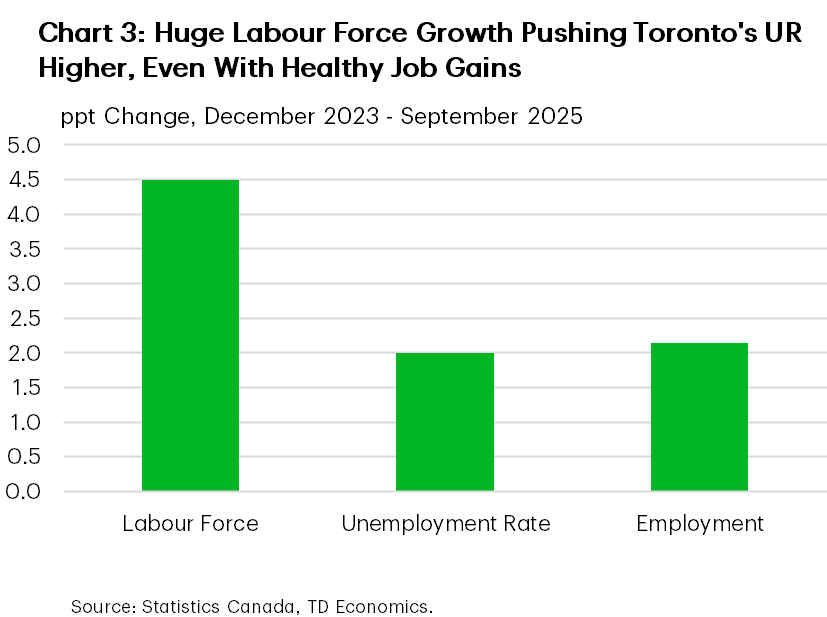
Since the end of 2023, robust population growth has driven a 4.5% increase in Toronto’s labour force – 1.4 percentage points higher than the rest of Ontario (Chart 2). Over that same time, Toronto’s employment has expanded by 2.1%, besting the 1.6% gain observed in the rest of the province. From this breakdown it’s apparent that the tremendously strong population inflow into Toronto is the key factor underpinning the relatively steep rise in its unemployment rate (Chart 3). It’s also worth noting that it’s unusual to see an almost 3.5 ppt rise in Toronto’s unemployment rate come largely on the back of labour force growth. During the Global Financial Crisis, for instance, Ontario’s unemployment rate also climbed about 3.5 ppts peak-to-trough (unemployment rate data for Toronto is unavailable for this period). However, declining employment was the driver.
Notably, the late-2024 reduction in federal migrant targets has reduced Toronto’s population faster than the rest of the province, thanks to a reduction in student inflows. Accordingly, the gap between Toronto’s labour force growth and the rest of Ontario’s has narrowed this year.
Trade War, Construction Weakness Taking a Toll
As noted, Toronto’s job growth had been running strong since 2023, just not fast enough to absorb the influx of labour force entrants. More recently, however, hiring momentum has been fading sharply. In September, Toronto’s employment was up only 0.2% relative to its level in December 2024. That is a slightly softer advance than recorded in the rest of Ontario.
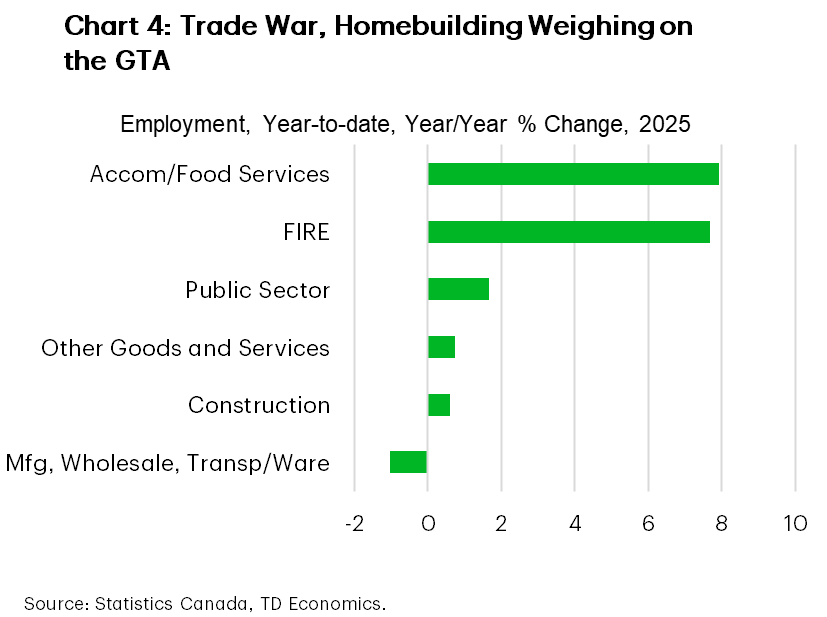
Digging into the details, job sector weakness in Toronto this year can be put down to the detrimental impacts from the trade war. In the region, industries most-levered to the U.S. (like manufacturing, transportation/warehousing and wholesale trade) are seeing steeper year-to-date job declines compared to the rest of the province.
Employment in the transportation/warehousing sector has plunged 6%, while manufacturing hiring is off by 2% (Chart 4). The latter is consistent with relatively steep retrenchment in manufacturing activity in Toronto versus the rest of Ontario. The scars of the trade war are evident, with a comparatively large sales drop taking place in the tariffed automotive sector. Along with the competitiveness impacts from the tariffs themselves, the Canada-U.S. trade war has damaged business confidence, depressing hiring activity in manufacturing. A weaker manufacturing sector has likely also had negative knock-on impacts to industries along its value chain, as well as ancillary services industries in the region, such as wholesaling, transportation/warehousing, and professional and technical services.
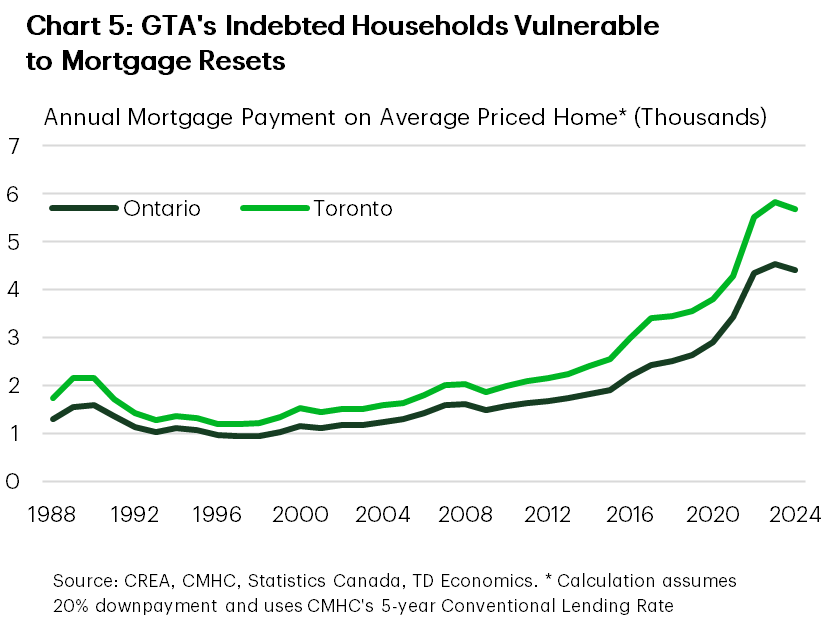
Growth in retail spending (which, due to data constraints, we take as a proxy for overall consumption) has also been significantly weaker in Toronto than the rest of Ontario this year. What’s likely part of the story here is that Toronto’s highly indebted homeowner households are particularly vulnerable to the wave of mortgage renewals taking place at sharply higher rates this year, causing them to rein in spending in order to manage this increase in debt payments (Chart 5). This could be slowing economic activity, leaving hiring more subdued than it otherwise would be. Note that job growth has been softer in Toronto than the rest of Ontario in discretionary services industries like personal services and information/culture/recreation. And, even with some bounceback in 2025, accommodation/food services employment remains subdued compared to other parts of Ontario.
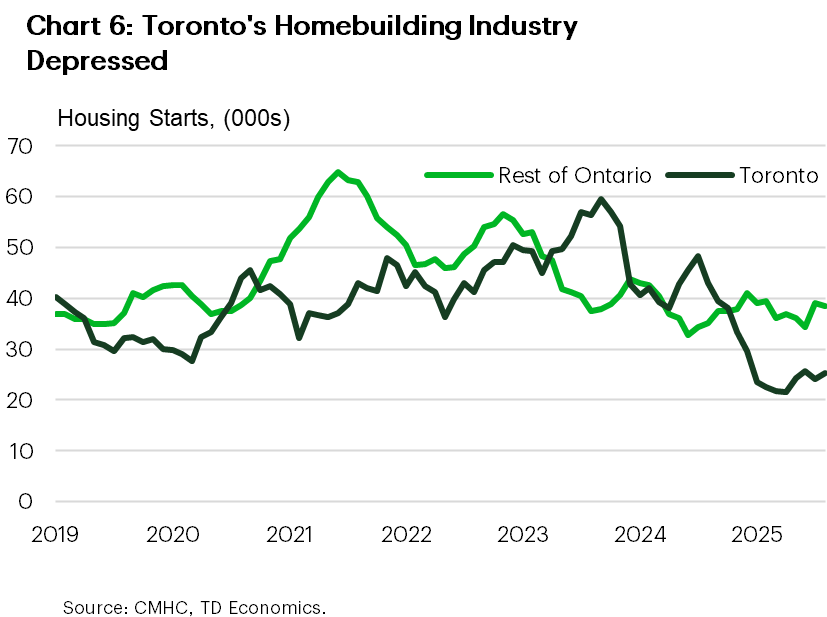
While the trade war has weighed on hiring in Toronto this year, construction hiring has been a multi-year sore spot. Indeed, employment is well off its 2023 peak in Toronto’s construction sector. This is of little surprise given the massive pullback in GTA condo construction underway as the industry grapples with modest demand, a lack of investor appetite, and elevated construction costs (Chart 6). Unfortunately, we see weakness in this sector persisting through next year, at least. This multi-year retrenchment follows a brief but robust period of activity during the pandemic, where inflation-adjusted residential investment peaked at 10% higher than its pre-pandemic level, lifting GDP by about $3 billion and creating about 21,000 direct and indirect jobs (the latter through the boost to supporting industries).
Young People Face a Historically Tough GTA Jobs Market
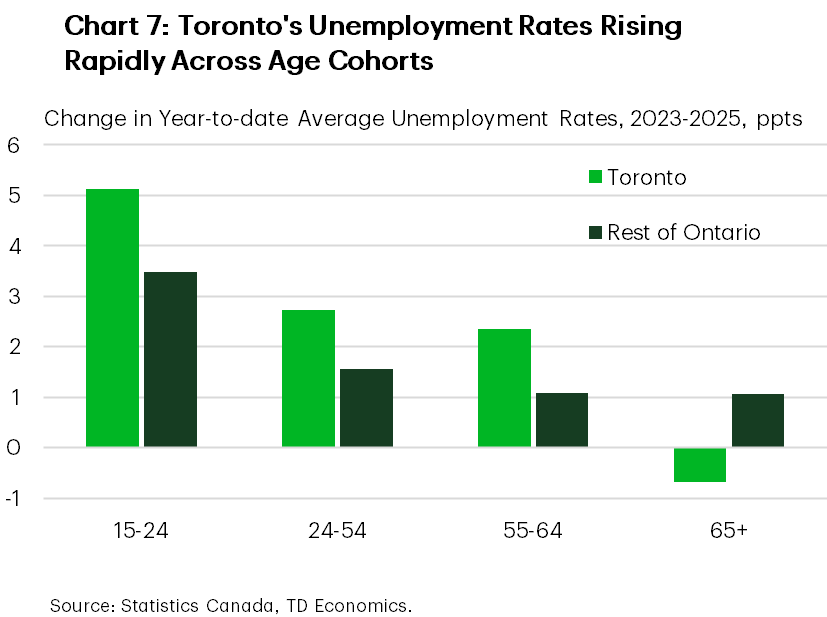
The loftier rise in Toronto’s unemployment rate than the rest of Ontario’s since the end of 2023 has been broad-based across most major demographic categories (Chart 7) with the notable exception of the 65+ age group (where a surge in hiring has unfolded).
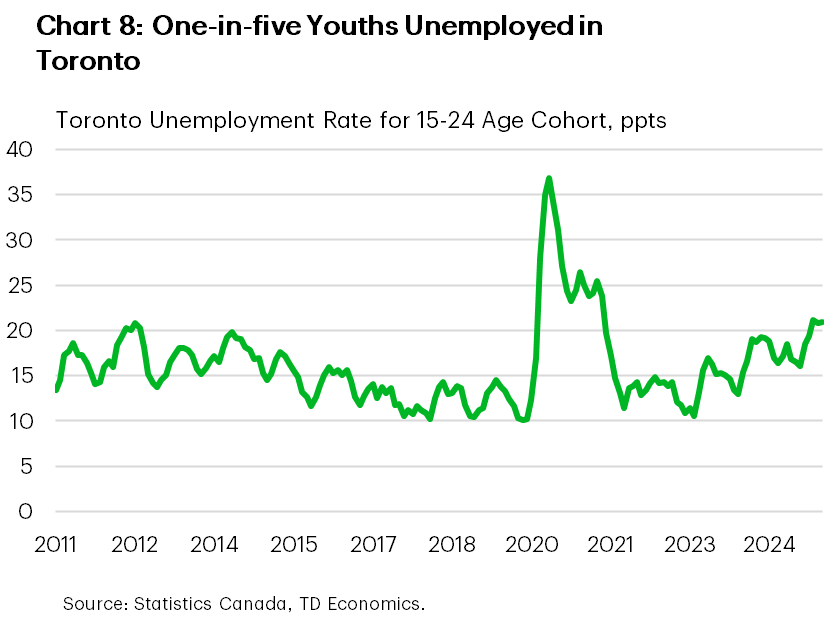
However, the youth unemployment rate in Toronto has seen the largest increase over the time. The level of youth unemployment is also concerning (Chart 8). Roughly one-in-five youths in the labour force were unemployed in September, hovering around a post Global Financial Crisis high (excluding the pandemic). As with the broader jobs market, robust labour force growth has contributed to this development, although youth employment has declined significantly this year.
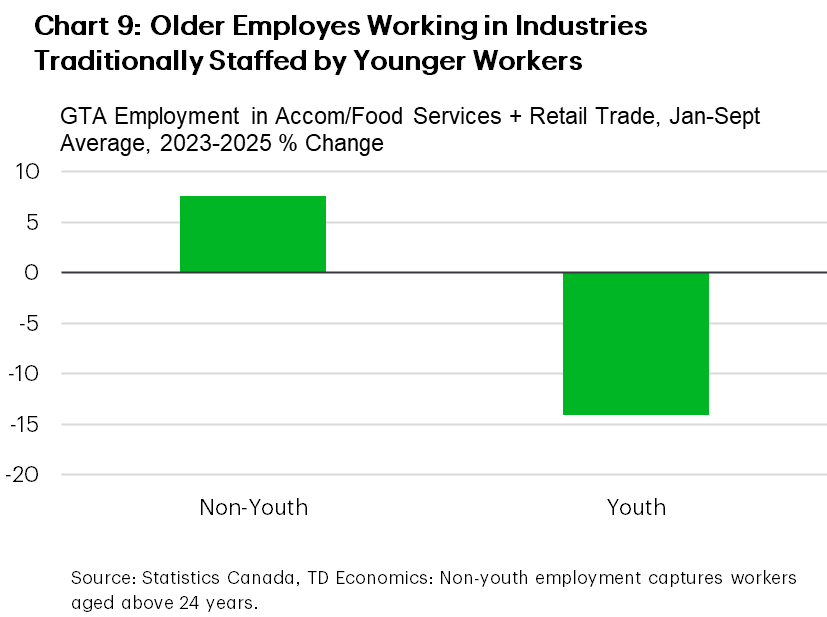
What’s been restraining youth hiring? Young workers typically do worse during down periods for the economy. What’s more, our analysis of public use microdata files tells us that older workers (facing a soft jobs market and rising living costs) are taking roles in industries that tend to hire a large share of younger workers (Chart 9). Much has been made of the potential impact of technological changes on employment, including AI. Research has noted that in some cases, younger workers in industries highly exposed to generative AI have tended to do more poorly1. We tested this for Toronto’s jobs market, using a recent Statistics Canada study2 as a benchmark to classify industries by their “exposure” and “complementarity” to AI. We found that young workers in Toronto employed in “high exposure” industries saw robust job growth since 2023. Accordingly, we didn’t find much evidence that AI is a contributing factor for the recent surge in youth unemployment.
Bottom Line
Toronto’s unemployment rate is elevated, both relative to its own history and the rest of Ontario. The key driver of the growing gap with Ontario has been the relatively rapid influx of workers into Toronto versus other parts of the province. It also reflects the U.S.-Canada trade war, and the mortgage renewal wave being faced by highly indebted GTA households. The GTA homebuilding industry has also been in recession.
The rise in the unemployment rate has been shared among age groups, although the level of youth unemployment in Toronto is troubling. The rise in youth unemployment may have to do with a weak economy forcing older employees to work in jobs traditionally staffed by youths.
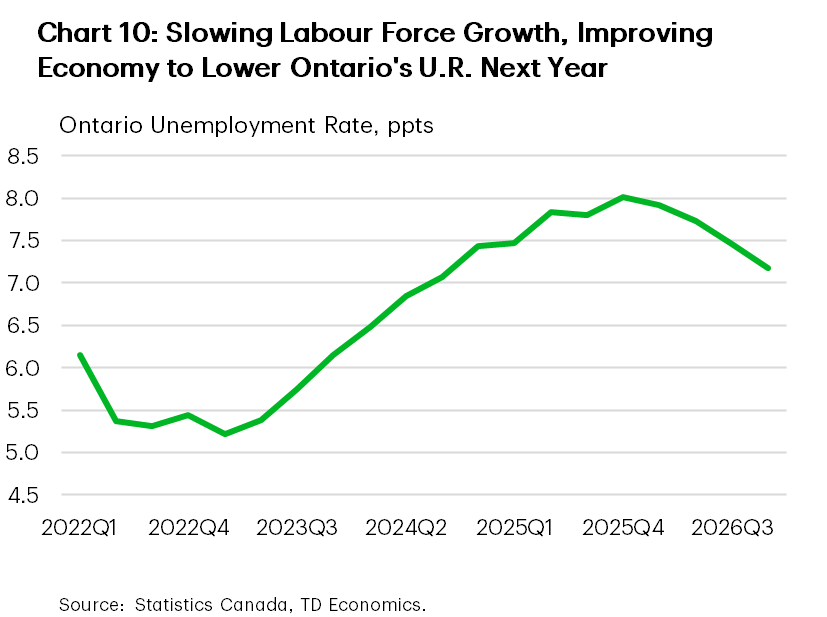
Moving forward, we expect further upside in the near-term for Ontario’s unemployment rate, as well as Toronto’s. Looking out to 2026, population growth should remain soft, while the economy gradually improves (Chart 10). These forces should help to bring down both Ontario’s and Toronto’s unemployment rates. With labour force growth slowing more sharply in Toronto than the rest of Ontario, the gap between the former’s unemployment rate and the latter’s could narrow through next year. However, it could still remain above-average, as the economy is impacted by soft homebuilding activity and trade uncertainty.
End Notes
- Brynjolfsson, E. et al. (August 2025). Canaries in the Coal Mine? Six Facts about the Recent Employment Effects of Artificial Intelligence. Stanford Digital Economy Lab. https://digitaleconomy.stanford.edu/wp-content/uploads/2025/08/Canaries_BrynjolfssonChandarChen.pdf
- Mehdi, T. and Morissette R. (September 2024). Experimental Estimates of Potential Artificial Intelligence Occupational Exposure in Canada. Statistics Canada. https://www150.statcan.gc.ca/n1/pub/11f0019m/11f0019m2024005-eng.htm
Disclaimer
This report is provided by TD Economics. It is for informational and educational purposes only as of the date of writing, and may not be appropriate for other purposes. The views and opinions expressed may change at any time based on market or other conditions and may not come to pass. This material is not intended to be relied upon as investment advice or recommendations, does not constitute a solicitation to buy or sell securities and should not be considered specific legal, investment or tax advice. The report does not provide material information about the business and affairs of TD Bank Group and the members of TD Economics are not spokespersons for TD Bank Group with respect to its business and affairs. The information contained in this report has been drawn from sources believed to be reliable, but is not guaranteed to be accurate or complete. This report contains economic analysis and views, including about future economic and financial markets performance. These are based on certain assumptions and other factors, and are subject to inherent risks and uncertainties. The actual outcome may be materially different. The Toronto-Dominion Bank and its affiliates and related entities that comprise the TD Bank Group are not liable for any errors or omissions in the information, analysis or views contained in this report, or for any loss or damage suffered.
Download
Share: