Too Much Money Can Exacerbate Inflation
James Marple, Senior Economist, AVP | 416-982-2557
Faisal Faisal, CFA, Manager, Economic Risk | 416-983-1738
Date Published: September 12, 2023
- Category:
- Canada
- Financial Markets
Highlights
- There was a time not too long ago when money supply was central to economists' expectations for inflation. While a long-term relationship between the two variables has never been in doubt, monetary aggregates have done little to explain short-term movements in inflation over the past several decades.
- History has shown that sustained high rates of inflation cannot occur without excessive money growth. The policy response to the pandemic created such a significant surge in money growth that it may have pushed the long-term relationship into the short-term.
- Our analysis shows that including money supply in a statistical model for inflation can improve its performance. While this improvement falls to effectively zero over the inflation targeting period prior to the pandemic (1992-2019), it returns in the pandemic and post-pandemic period.
- After surging in 2020, money supply is now in retreat. This does not mean that the economy is susceptible to a bout of deflation – economic conditions and inflation expectations still matter. Instead, it should contribute to confidence that the Bank of Canada has taken the steps necessary to return inflation to its 2% target.
The sharp acceleration in money supply and inflation in the aftermath of the pandemic has reignited a debate over the direct role money plays in driving faster price growth. Central banks once paid close attention to money supply. From 1975 to 1982, the Bank of Canada (BoC) directly targeted growth of M1 – a monetary aggregate consisting of currency and bank chequable deposits.1
The Bank of Canada has long since moved away from targeting money supply as an intermediate step in controlling inflation, opting for direct numerical inflation targets.2 While the central bank has largely removed money from its lexicon, ignoring it completely has its downsides. Empirical analysis shows a persistent long-run relationship between money supply and inflation that has stood the test of time. In certain circumstances, it can also be helpful in explaining shorter-term movements. Inflation's relationship with money supply is most evident in situations in which price growth has been pushed out of its narrow "low-and stable" corridor. 3,4
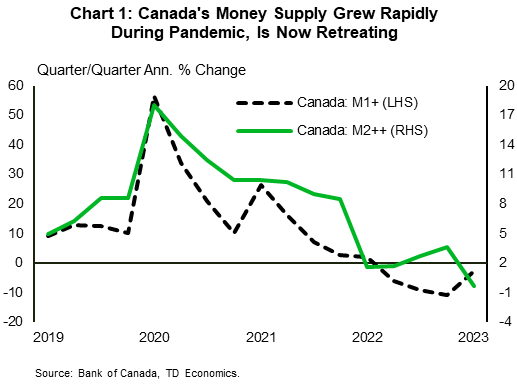
Money supply surged well before the run up in post-pandemic inflation, but it is now moving in the opposite direction. More narrow definitions of money (M1+; please see Text Box 1 for definitions) have been shrinking for the past four quarters, while broad money (M2++) declined for the first time on record in the second quarter of this year (Chart 1).
A forecasting approach that includes the typical drivers of inflation, as well as money supply suggests that the surge in money supply that contributed to its acceleration will now be helpful in moving it back to target. By removing some of the extensive liquidity provided to the economy in the aftermath of the pandemic, the Bank of Canada is showing its commitment to its 2% target and the policy actions necessary to attain it.
Text Box 1: What is Money?
- "M1+" is the sum of currency outside banks and chequable deposits held at deposit-taking institutions (chartered banks and other deposit taking institutions).
- To M1+, "M1++" adds non-chequable deposits held at deposit-taking institutions.
- "M2" is the sum of currency outside banks, demand and notice deposits at deposit-taking institutions, and chartered bank personal term deposits.
- To M2, "M2++" adds Canada Savings Bonds, money-market and non-money market mutual funds.
"We Didn't Abandon The Monetary Aggregates, They Abandoned Us…” 5
A number of factors conspired to doom central bank's past experiments with monetary targeting. For one, they focused on relatively narrow categorizations of money. Both the Bank of Canada and the Federal Reserve put their focus on "M1" measures that only included chequing deposits and cash outside of banks. The motivation was to focus on narrow money that exhibited the highest sensitivity to interest rates, and thus to the central bank's policy tools. However, financial innovations and changes in product offerings made these relationships increasingly more tenuous.
Focusing on broader monetary aggregates would have reduced some of these earlier forecast misses but even more inclusive aggregates, have had limited success in predicting inflation over the last several decades. In large part this reflects the success of central banks in anchoring inflation expectations and maintaining inflation near their official 2% targets. This credibility had made predicting inflation easier – inflation has, over a relatively short period of time, moved to whatever the central bank targets it to be.
Money Matters (Again)
The more recent period, in which changes to the overnight rate gave way to large increases in Quantitative Easing (QE) and therefore money supply, has thrown this assumption – that the best forecast is simply 2% – into question. In order to shield the economy from the impact of public health measures, policy makers coordinated fiscal and monetary policy in order to provide direct monetary supports to individuals, a welcomed move. At the same time that deficits were expanding by north of 10% of GDP, policy rates were pushed to zero and the BoC engaged in QE, purchasing large amounts of government bonds.
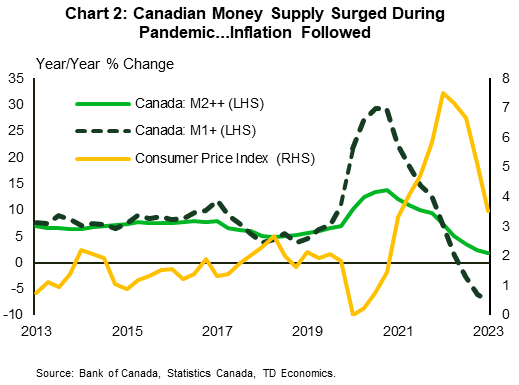
The interventions made by the Bank of Canada and the Federal Government during the pandemic resulted in an immediate surge in both narrow and broad definitions of money. In the second quarter of 2020, M1+ grew by over 50% annualized, while broader monetary aggregates grew close to 20%. Initially inflation remained quiescent, even as a relatively swift economic recovery took place in the second half of the year. However, as nominal spending power moved above pre-crisis levels, price growth began to pick up, peaking in 2022 at a near double-digit rate .
Today narrow money is declining, down 7% from its peak, while broad money growth has slowed considerably. Consumer price inflation has followed suit with a lag, registering a print of 3.5% year-over-year in the second quarter of 2023 (Chart 2). The sequencing of these events is enough to suspect a causal link between the two variables, but it does not prove that they are related. We must consider whether money adds anything to a forecast for inflation when other contributing factors have also been considered.
Including Money Better Explains Post-Pandemic Inflation Acceleration
To test the hypothesis that money supply can matter for inflation, we run two variations of a statistical model of inflation estimated over various sample periods and compare their relative forecast error. The modelling approach we take is a vector error correction model (VECM). The VECM approach allows us to test for both a long-term relationship between economic variables as well as short-term dynamics that move variables from this long-run anchor. We consider all of the variables included in a standard inflation model: the output gap, commodity prices, the Bank of Canada policy rate, and lags of inflation itself.6 The only difference between the two models is the inclusion or exclusion of broad money (M2++).
Estimation of the VECM is carried out in two steps. In the first, we test for a long-term (cointegrating) relationship between money supply and inflation. This shows a significant positive relationship between money supply and inflation, as predicted in the economic literature. We then construct the error correction terms from these estimated cointegrating relationships and estimate a vector auto regression (VAR) in first differences. Statistical tests also show a significant positive short-run coefficient of money supply on inflation. Further details of our modelling approach are contained within the Appendix.
Finally, we examine a standard measure of forecast error (Root Mean Square Error) between the VECM including money supply and the one excluding it.7 Overall, we find that the model with money supply performs better (Table 1) over the full sample. However, during the period of inflation targeting prior to the pandemic, the model without money performs just as well as the model with it included. In the period immediately prior to the pandemic to the present (we must go back to 2018 to have enough data history for the model to run), the model with money included outperforms once again.
Table 1: Root Mean Square Forecast Error
| Model Type | Full Sample (1973Q1 - 2023Q2) |
1973Q1 - 2019Q4 | 1991Q4 - 2019Q4 | 2018Q4 - 2023Q2 |
| VECM | 22 | 20 | 1.2 | 4 |
| VECM with M2++ | 11 | 13 | 1.2 | 2 |
| Reduction in forecast error | 50% | 35% | 0% | 50% |
The Bottom Line
The failure of inflation to materialize after the 2008 downturn contributed to economists downplaying the potential for money supply growth to contribute to future inflation. As growth in money surged well past anything experienced historically, focus remained on the balance of aggregate demand and supply, even as these became increasingly difficult to measure in real time.
The recent experience demands a more careful investigation. Our analysis shows that while money did little to improve model performance over the period prior to the pandemic in which the Bank of Canada targeted inflation (1992-2019), its inclusion improves it in the most recent period. With a good amount of lead time, the surge in money supply in 2020 helps explain the 40-year high in inflation that followed.
The good news is that the Bank of Canada has been successfully targeting inflation since the late 1990s. The success and credibility of the central bank gives confidence that inflation will return to its 2% target. As such, the decline in money supply over the last several months does not imply that the economy is headed for deflation, but rather that the BoC has taken the steps necessary to reduce it. Assuming they continue on this path, we will soon return to a world in which the best forecast for inflation is the central bank's 2% target.
Text Box 2: Why Did Inflation Accelerate in 2022 and Not in 2008
In the wake of the 2008 Global Financial Crisis (GFC), the BoC did not engage in large-scale asset purchases (also known as Quantitative Easing). It characterized its interventions as "credit easing". When it purchased securities in order to provide liquidity to distressed pockets of the financial system, these were neutralized with sales of other assets (mainly holdings of Government of Canada Treasury Bonds) in order to avoid significant increases in its balance sheet.
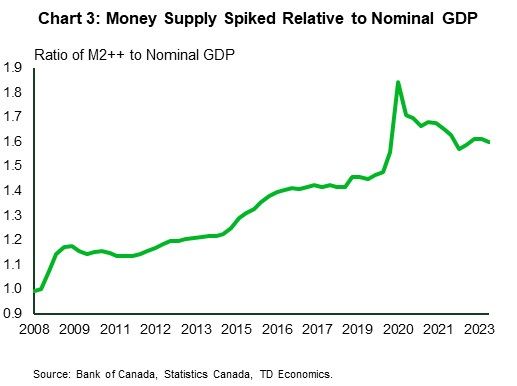
In the aftermath of pandemic, by contrast, the Bank of Canada expanded asset-purchases dramatically, adding $440 billion worth of securities in the year after the pandemic hit. At the same time, bank lending increased by $450 billion (19%) from the fourth quarter of 2020 to the fourth quarter of 2022. The combination led to a much larger increase in money supply relative to GDP. In 2008, money supply rose from 1.0 to 1.2 times nominal GDP. During the pandemic this ratio skyrocketed from 1.4 to 1.8 times nominal GDP, and still sits at 1.6 times, well above its pre-pandemic average of 1.3 (Chart 3). In combination with pandemic-related constraints on supply, this made for a much larger imbalance between the availability of funds to purchase goods and services and the economy's ability to produce them during the more recent experience relative to the GFC.
In the U.S., the Federal Reserve did engage in Quantitative Easing during the GFC, however with credit tightening and households deleveraging, this was less effective in raising spending and inflation did not rise materially, despite an increase in money supply. Still, as in Canada, the increase in money supply during the GFC was dwarfed by its increase in the aftermath of the pandemic, pushing the balance in the other direction.
Appendix
Time series data for money and price variables are in natural log form, while the output gap and BoC rate are in percentage level form. The first difference for all variables measures its growth rate or change. We use quarterly data from 1973-Q1 to 2023-Q2 to estimate the parameters of our model, thus allowing for a sufficiently large sample to test model stability at different periods.
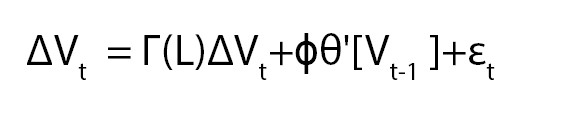
The model employed is a Vector Error Correction Model (VECM) constructed around an equilibrium relationship among prices, money, output, interest rates. Where Vt is a vector containing the endogenous variables (lagged inflation, the BoC commodity index, M2++, output gap, and Bank of Canada overnight rate), and εt is an error term. Γ(L) contains the parameters of the lag process of Vt.  measures the short-run or speed of adjustment of the endogenous variables toward their long-run equilibrium, and θ' is the matrix of parameters on the long-run cointegrating relationships within the model.
Estimation of the VECM is carried out in two steps. In the first step, we estimate the cointegrating relations from the Johansen procedure as used in the cointegration test. We then construct the error correction terms from the estimated cointegrating relations and estimate a VAR in first differences including the error correction terms as regressors. The equation also shows the speed at which the dependent variable in this case inflation returns to its equilibrium after a change in the vector of independent variables.
In the long run equation, the error correction term for M2++ is positive and significant, evidence of a long-term relationship between money and inflation. At the same time, the model shows a significant short run coefficient of M2++ on inflation. In other words, long and short run changes in money supply can help explain changes in inflation.
End Notes
- The Bank of Canada's experiment with money supply targeting and its challenges is described in detail here: https://www.clevelandfed.org/en/publications/economic-commentary/1998/ec-19980201-canadas-money-targeting-experiment
- As discussed in the Bank of Canada's recent Monetary Policy Framework Renewal, its primary tool is its overnight rate through which it influences borrowing costs and thereby aggregate demand. Monetary targets are absent from the renewal document, except in the context of past monetary policy regimes: https://www.bankofcanada.ca/wp-content/uploads/2021/12/Monetary-Policy-Framework-Renewal-December-2021.pdf
- As discussed in paper by BIS, the inflation process may be thought of as following either low- and high-regimes and may move between them following large shocks. https://www.bis.org/publ/bppdf/bispap133.pdf
- Including money supply in inflation analysis appears especially useful when unconventional monetary policy (Quantitative Easing or Quantitative Tightening) has occurred. https://www.cdhowe.org/sites/default/files/2023-04/E-Brief_340_1.pdf
- Remark by Bank of Canada governor Gerald Bouey as cited here: https://www.nber.org/system/files/chapters/c11173/c11173.pdf
- We study a similar set of variables and use a similar modelling approach to the one here: https://www.bankofcanada.ca/wp-content/uploads/2010/05/wp98-6.pdf
- Root Mean Square Error (RMSE) is the standard deviation of the residuals (prediction errors). Residuals are a measure of how far from the regression line data points are; in other words how spread out these residuals are. We obtain similar results with more simple time-series modelling approaches. We study a similar set of variables and use a similar modelling approach to the one here.
Disclaimer
This report is provided by TD Economics. It is for informational and educational purposes only as of the date of writing, and may not be appropriate for other purposes. The views and opinions expressed may change at any time based on market or other conditions and may not come to pass. This material is not intended to be relied upon as investment advice or recommendations, does not constitute a solicitation to buy or sell securities and should not be considered specific legal, investment or tax advice. The report does not provide material information about the business and affairs of TD Bank Group and the members of TD Economics are not spokespersons for TD Bank Group with respect to its business and affairs. The information contained in this report has been drawn from sources believed to be reliable, but is not guaranteed to be accurate or complete. This report contains economic analysis and views, including about future economic and financial markets performance. These are based on certain assumptions and other factors, and are subject to inherent risks and uncertainties. The actual outcome may be materially different. The Toronto-Dominion Bank and its affiliates and related entities that comprise the TD Bank Group are not liable for any errors or omissions in the information, analysis or views contained in this report, or for any loss or damage suffered.
Download
Share: