Highlights
- Canadian consumers have shown increasing resiliency to the pandemic. According to TD debit and credit card transaction data, spending during the third wave managed to hold above 2019 levels, and so far is holding up well during the fourth wave.
- The resiliency of consumption comes as a result of Canadians reorienting their purchases towards goods from services. The data indicate that with the exception of the first wave pull-back, goods outlays have been largely detached from pandemic dynamics.
- Another test of consumer resiliency could come later this fall as caseloads likely continue to move higher. A lack of pent-up demand for goods could limit the extent to which consumers re-divert their spending, risking another softening in overall personal consumption.
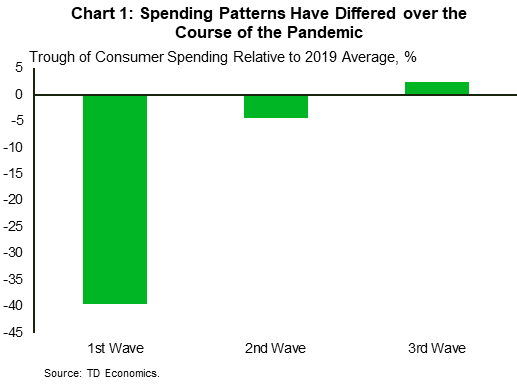
The Canadian economy has bounced back faster over the past year than what many had expected. This outcome can largely be chalked up on the resiliency of the consumer. Indeed, the impacts of the pandemic on aggregate consumer spending appear to have waned over time. To corroborate this point, we turn to TD credit and debit card transaction data, which have the benefit of a high cadence (weekly), great timeliness (figures available through early September) and broad product coverage. According to the TD data, during the first wave of the virus, weekly spending plummeted, dropping by 40% (at its trough) compared to the average level of spending in 2019 (Chart 1).1 But when the second wave came around in September 2020, outlays had recovered much of their initial losses, and were only 4% below 2019 levels. Finally, during the third wave which ran from March to December, spending bucked the trend entirely, and remained slightly above their pre-pandemic levels.
Goods Purchases Make Up For Drop in Services Spending

The resiliency of consumption comes as a result of changing expenditure patterns by Canadians. Provincial restrictions as well as health worries, resulted in consumers shunning “high-touch” areas of the economy, such as recreation, entertainment, and travel services, and, instead, directing more of their income toward purchasing goods. TD spend data show that after declining at the onset of the pandemic, goods outlays rebounded swiftly, moving above 2019 levels by the second wave, and that lead grew during the third wave (Chart 2). Meanwhile, spending on high-touch services remained well below pre-pandemic levels through all three waves. Interestingly, expenditure on all other services improved steadily through the pandemic and posted a gain during the third wave compared to the 2019 average.
It’s worthwhile noting that restrictions or higher case rates did not weigh significantly on goods purchases after the initial COVID-19 outbreak. We find using an econometric framework which controls for the stringency of restrictions and COVID-19 case rates that there is a near zero correlation between spending on goods and case rates as well as restrictions from June 2020 to the end of July this year2,3. The data suggest that with the exception of the first wave pull-back, goods outlays have been largely detached from pandemic dynamics.
The same cannot be said for high-touch services, however. Public health measures were targeted towards this area of the economy, so as restrictions were tightened, consumers spent less on recreation, entertainment, and travel activities. Our quantitative analysis finds that a 10-point increase in stringency in a given week (as measured by the Bank of Canada stringency index), resulted in 0.2% drop in spending on high-touch services. Our analysis also found little direct correlation between rising case rates and consumption in this category, suggesting that outcomes have been driven more by actual restrictions rather than precautionary spending behavior. In terms of other services, case rates or stringency did not have a statistically significant relationship with outlays probably due to greater digitalization which allowed this area to continue operating through the pandemic.
Consumers Beginning to Redirect Spending to Services But Fourth Wave Poses Risks
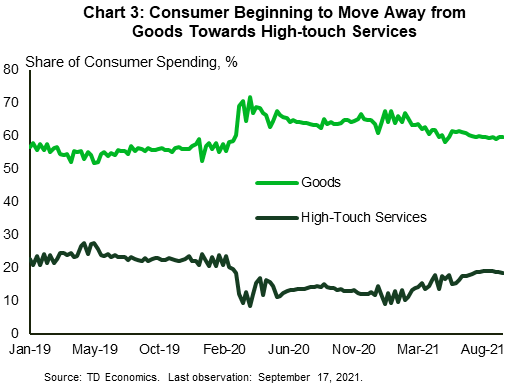
With most provinces reopening their economies in early June, consumers have begun to redirect their spending towards high-touch services from goods (Chart 3). The goods share of total consumption, which had risen from a 2019 average of around 55% to a peak of 70% during the pandemic, is now trending down. In early September, the share was 59%. In the meantime, reopening has sparked a jump in spending on high-touch services. This category’s share of total spend, which was a little over 10% through much of the health crisis, reached 19% in early September. This indicates that Canadians are slowly, but surely, returning spending patterns back to pre-pandemic norms.
Indeed, easing public health restrictions would foster a faster return to norm, but the fourth wave of the pandemic has provinces rethinking their reopening plans. Given the health risks posed by the Delta variant, most provinces have paused lifting restrictions further, with many instituting mitigating measures such as vaccine passports to blunt the impact of Delta.
The stalling of reopening plans is likely to slow the recovery in high-touch services consumption. Early September data indicate that while overall spending is holding up, high-touch services expenditure flattened in the first two weeks of the month. With the level of outlays in this category 10% lower than what it was in 2019, there is still a long way to go to make up pandemic losses.
What’s more, the risk is that if a deterioration in the health crisis forces the government to implement renewed lockdowns, goods spending may not pick up the slack in high-touch services as it had done through much of the pandemic. Consumers splurged on all types of durable items through the pandemic, ranging from furniture to recreational vehicles to games and toys. In the fourth wave, there will be a lot less demand for such goods, putting a damper on spending activity, especially if high-touch services spending growth weakens. Consumer resiliency could be put to the test this fall season.
End Notes
- Each wave is defined as when cases begin to rise to when they trough. The first wave is from March 2020 to early July 2020. The second wave is from September 2020 to the end of January 2021. And the third wave is from March 2021 to the end of May 2021. We compare spending during the pandemic to 2019 levels to assess the overall impact of the pandemic during every wave.
- To measure the stringency of restrictions, we use the Bank of Canada’s stringency index. This index quantifies the stringency of policy related to containment restrictions and public information campaigns over time.
- Given the richness of TD spend data, we ran the same regression across each province and found similar results similar to the national outcome.
Disclaimer
This report is provided by TD Economics. It is for informational and educational purposes only as of the date of writing, and may not be appropriate for other purposes. The views and opinions expressed may change at any time based on market or other conditions and may not come to pass. This material is not intended to be relied upon as investment advice or recommendations, does not constitute a solicitation to buy or sell securities and should not be considered specific legal, investment or tax advice. The report does not provide material information about the business and affairs of TD Bank Group and the members of TD Economics are not spokespersons for TD Bank Group with respect to its business and affairs. The information contained in this report has been drawn from sources believed to be reliable, but is not guaranteed to be accurate or complete. This report contains economic analysis and views, including about future economic and financial markets performance. These are based on certain assumptions and other factors, and are subject to inherent risks and uncertainties. The actual outcome may be materially different. The Toronto-Dominion Bank and its affiliates and related entities that comprise the TD Bank Group are not liable for any errors or omissions in the information, analysis or views contained in this report, or for any loss or damage suffered.
Download
Share: