A Slow Road to Recovery for Canadian
Tourism Spending
Rishi Sondhi, Economist | 416-983-8806
Marc Ercolao, Economist
Date Published: August 3, 2023
- Category:
- Canada
- Commodities & Industry
Highlights
- Canada’s tourism sector has bounced back briskly since the initial COVID-19 lockdowns. However, the pace of recovery is now easing as the sector faces headwinds from higher interest rates, a slowing jobs market, and broader cyclical slowdown in the U.S. and abroad.
- Inflation-adjusted tourism expenditures are unlikely to surpass pre-pandemic levels until 2025. Until then, more of this recovery is expected from foreign demand as international tourist counts have lagged a more robust rebound in domestic tourism.
- Across provinces, Nova Scotia stands out as the only province to recover to pre-pandemic international tourism counts, with Quebec looking to be the next to follow suit. Alberta and British Columbia have performed relatively well, outpacing the national level recovery. Ontario faces a set of immediate and structural challenges that are prohibiting growth.
Three years after the pandemic first hit, activity in Canada’s tourism industry is still running well below normal levels. Still, the industry continues to claw its way back, as it settles into a pattern of steady, but modest growth. With ground to make up, the sector should continue to provide some support to the Canadian economy as it deals with the formidable headwinds of elevated interest rates and slowing U.S. growth.
This note will explore trends in Canada’s tourism industry and offer our take on how activity will evolve in the quarters ahead.
Canada’s Rapid Tourism Recovery Is Beginning to Ease
Tourists can be broadly basketed into two groups, international and domestic travelers. We proxy international travelers using Statistics Canada’s measure for “non-resident visitors entering Canada.”
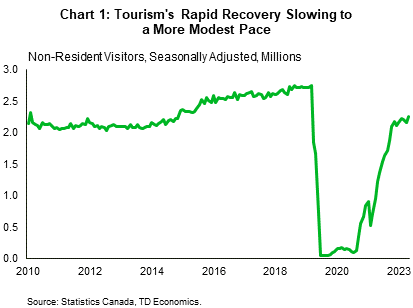
At the national level, the recovery in international tourism activity appears to be slowing after undergoing a fairly swift bounce-back from mid-2021 levels (Chart 1). Since the turn of this year, the count for non-residents travelling to Canada has edged up from 2.11 to 2.25 million travelers. The number of non-resident visitors is on par with its average over the 2011-2015 period but remains down by around 20% compared to its pre-pandemic peak. Real (inflation-adjusted) spending by non-resident visitors has recovered at roughly the same rate, implying per capita expenditures have remained relatively steady.
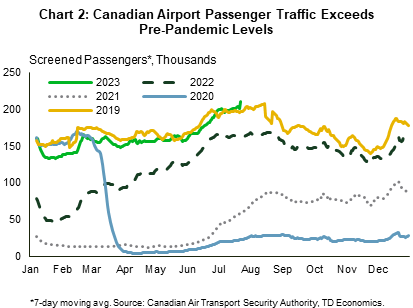

The most current data on international travelers run through May of this year. As we are now in the midst of the peak travel-season (June – August), the recovery in tourism activity should be well-supported in the near term. This is evidenced by high-frequency passenger traffic data from the Canadian Air Transport Security Authority (CATSA) which has shown that as of July, passenger activity has surpassed pre-pandemic levels. This should be reflected in an increase in non-resident tourists in the monthly accounts. Through the first five months of the year, airport activity lagged 2019 levels.
To capture domestic tourism activity, we look at inflation-adjusted tourism expenditures excluding foreign demand (note that data on the number of domestic “travelers” is unavailable). The spending data shows that domestic tourism activity fell by less than international tourism during the initial lockdowns and subsequently recovered faster. As of the first quarter of this year, inflation-adjusted domestic tourism spending has pulled up to approximately 90% of its pre-pandemic level vs. 80% for international visitors (Chart 3).
Recovery Varies Across Provinces
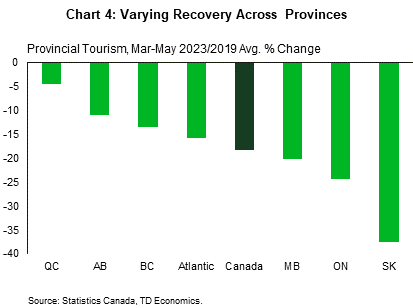
Tourism recovery patterns are starkly different across jurisdictions (Chart 4). Saskatchewan lags all other provinces, with the level of international travelers nearly 40% below its 2019 average. Part of Saskatchewan’s struggles are fueled by sluggish activity from same-day tourists, who prior to 2020, accounted for roughly 30% of travelers in the region. Today, that number has fallen to 20% with the level of same-day tourists at less than 50% of pre-pandemic levels. Saskatchewan has also seen some domestic and international flight routes halted by major airlines. Ontario, whose international traveler tally accounts for almost half of the national headcount, is down 24% from pre-pandemic levels. Ontario faces a set of immediate and structural challenges that are prohibiting growth, including staffing issues.
The Atlantic Provinces, meanwhile, sit 16% below their pre-pandemic averages, slightly outperforming the nation. Interestingly, Nova Scotia is the only province across the nation to have recaptured 2019 levels (+15%) in terms of international tourists. Aggressive marketing campaigns targeted towards Canada, the U.S. and Europe that began in March 2023 should help the province to build on its current momentum. Elsewhere, Quebec’s tourism recovery is moving at a faster pace than the rest of Canada and will likely be the next province to surpass its 2019 numbers. Over the last two years, Quebec received $110 million in support as part of the Tourism Relief Fund administered by the CED (Canada Economic Development for Quebec Regions). These funds directly supported 292 tourism-related projects in the province.
Alberta and British Columbia’s tourism sectors have also performed relatively well, with international visits sitting 11% and 13% below pre-pandemic levels respectively. However, both jurisdictions are suffering from labour shortages in the sector, which may affect their ability to meet demand heading into peak tourism season.
A Full Recovery is in the Cards, but it Will Take Some Time
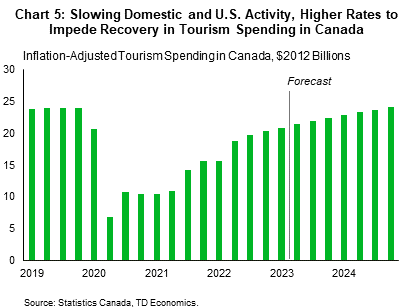
In assessing the outlook for tourism spending, the starting point is important. In the first quarter, real international and domestic tourism expenditures advanced at what would typically be considered a solid 2.6% (non-annualized) quarter-on-quarter pace. Into the second quarter, expenditures are tracking a similar gain. However, this has only put a dent in the gap between current and pre-pandemic spending activity, which is still 13% below where it was before COVID hit.
Moving forward, spending is unlikely to surpass pre-pandemic levels before 2025 (Chart 5), as several headwinds blow against it. Notably, we expect the Canadian job market to lose a considerable amount of steam beginning in the second half of this year. At the same time, higher interest rates mean households must devote more of their incomes towards debt repayment. These factors will impede domestic tourism spending. Finally, several quarters of sub-trend U.S. economic growth will weigh on spending growth from Canada’s largest tourist market. On the plus side, the Canadian dollar should remain relatively low through next year, providing a small offset to these other headwinds.
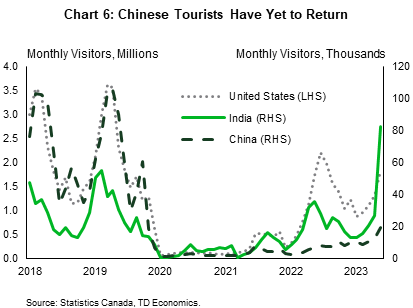
One of the key sources of weakness in terms of foreign tourism is from China. In the first five months of this year, the number of Chinese tourists visiting Canada was 80% below its level over the same period in 2019. Looking ahead, Chinese tourism could remain soft, in part reflecting tensions between the two countries (which is negatively impacting Chinese travel sentiment, according to surveys) and a Chinese ban on overseas group tours (which has been lifted for several countries, but not for Canada)1. In B.C. (historically an important destination for Chinese tourists), a major culprit has been a lack of flight capacity, as airlines cut flights and staff amid China’s long COVID lockdown. It will take time to recruit replacements and re-establish routes between the two countries. On the bright side, tourist activity stateside is picking up momentum while visitors from India have nearly doubled compared to pre-pandemic levels (Chart 6).
Bottom Line
With some ongoing pent-up demand from international visitors, Canada’s tourism recovery is likely to continue to make some gradual headway in the quarters ahead even as the Canadian and U.S. job markets slow more broadly. Still, at the expected trajectory, a return to pre-pandemic levels of overall spending and international tourism levels is not expected before 2025. Although more price-conscious tourists could weigh on profit margins in the sector, slower demand growth may allow the industry time to overcome labour shortages.
End Notes
- Cao, Yuqi. “Fewer flights, geopolitical tensions keeping Chinese tourists from B.C.”. The Globe and Mail, March 6 2023, https://www.theglobeandmail.com/canada/british-columbia/article-chinese-tourists-put-british-columbia-on-the-backburner/. Accessed June 2023.
Disclaimer
This report is provided by TD Economics. It is for informational and educational purposes only as of the date of writing, and may not be appropriate for other purposes. The views and opinions expressed may change at any time based on market or other conditions and may not come to pass. This material is not intended to be relied upon as investment advice or recommendations, does not constitute a solicitation to buy or sell securities and should not be considered specific legal, investment or tax advice. The report does not provide material information about the business and affairs of TD Bank Group and the members of TD Economics are not spokespersons for TD Bank Group with respect to its business and affairs. The information contained in this report has been drawn from sources believed to be reliable, but is not guaranteed to be accurate or complete. This report contains economic analysis and views, including about future economic and financial markets performance. These are based on certain assumptions and other factors, and are subject to inherent risks and uncertainties. The actual outcome may be materially different. The Toronto-Dominion Bank and its affiliates and related entities that comprise the TD Bank Group are not liable for any errors or omissions in the information, analysis or views contained in this report, or for any loss or damage suffered.
Download
Share: