Highlights
- Canada’s productivity challenges are magnified by the retention of top talent. Canada’s strong record of educating and training globally-competitive workers and entrepreneurs is undermined by substantially higher personal taxes that draws those individuals elsewhere, particularly to the U.S., which has always been highly selective in attracting people from Canada’s upper tail.
- The fundamental problem isn’t attracting talent but anchoring it: Canada produces strong research and education outcomes but underperforms on commercialization, business R&D, tech adoption, and scaling firms, which lowers the domestic returns to skill and entrepreneurship versus U.S. innovation clusters.
- Canada’s tax and incentive structure compounds the issue: high top marginal personal tax rates kick in at much lower income thresholds, while complex business tax rules encourage remaining small rather than growth. Strengthening incentives to scale over relocation or avoidance could reignite Canada’s innovation agenda.
Canada has always competed with the United States in developing and retaining top talent, but that fight is heating up. The U.S. has taken the global pole position in technological advances, like artificial intelligence where the reach will broaden into all industries. Tighter immigration policies south of the border will not insulate Canada from losing top talent in innovation and entrepreneurship.
The core challenge is not in attracting world-class talent, but in anchoring that talent within its borders to build, scale, and lead globally competitive firms at home. Absent progress on this front, Canada will continue to be a feeder system for the U.S. innovation economy.
One under appreciated lever in this competition is Canada’s tax system. Even before comparing the scale and dynamism of U.S. innovation clusters, Canada asks high earners and founders to pay top marginal rates at much lower income levels—and, in several provinces, allows inflation to quietly push more households into higher brackets over time. Meanwhile, a complex corporate tax architecture rewards sophisticated deferral and income-shifting strategies that can protect some entrepreneurs, but also diverts time and capital toward tax planning rather than growth. If Canada wants to retain and attract globally mobile talent, the question goes beyond educating and selecting the right people. It asks whether Canada’s tax and incentive structure makes building a career or scaling a company the rational choice.
Leaking from the top
Statistics Canada finds that while permanent migration to the United States has declined since the late 2000s, Canada has still experienced a net loss of residents over long horizons1. More importantly, permanent migration data understate the problem. A growing share of talent loss now occurs through temporary and semi permanent channels, particularly U.S. employer sponsored visas. These pathways are largely invisible in conventional “brain drain” metrics but increasingly decisive.
Those leaving are not marginal workers. Canadians applying for U.S. labour certification—a key step toward employment based green cards—are disproportionately highly educated and concentrated in computer science, engineering, and technical management. Roughly half work in computer, mathematical, architecture, or engineering occupations, and associated wage offers are exceptionally high (Statistics Canada, 2025). The United States has always been highly selective of the labour it attracts from Canada, absorbing its upper tail.
The composition of outflows reinforces this conclusion. By 2024, foreign born Canadian citizens accounted for about 60% of Canadian applicants for U.S. labour certification, up from just over half a decade earlier (Statistics Canada, 2025). Canada has increasingly functioned as a staging ground: it selects skilled immigrants, integrates them into the labour market, and then loses them to larger and more lucrative U.S. ecosystems.
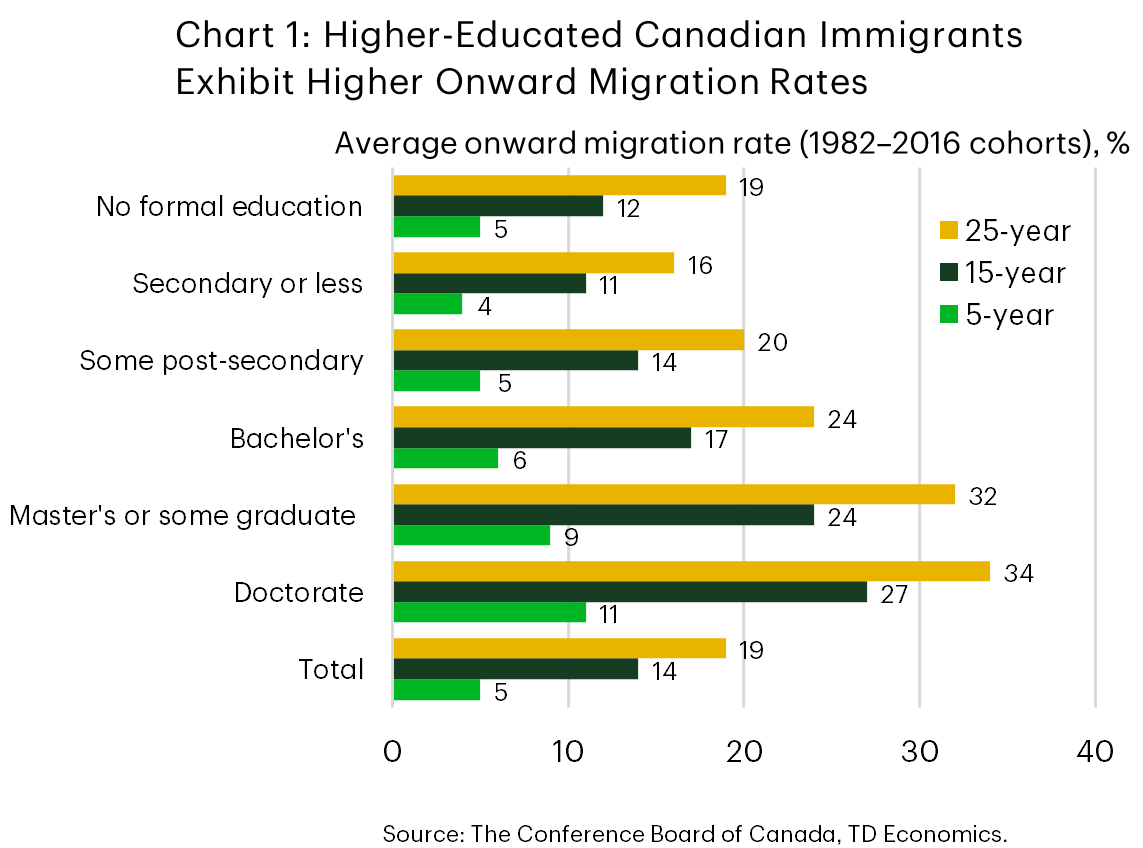
Similar patterns appear among new graduates. Statistics Canada’s analysis of STEM retention shows that graduates in mathematics, computer science, and engineering are less likely to remain in Canada than non STEM graduates, even among Canadian citizens (Retention of STEM Graduates in Canada, 2025). Doctoral graduates and graduates from highly ranked universities have the lowest retention rates, particularly in the first five years after graduation. Mobility rises with skill portability (Chart 1).
International students exhibit slightly improved retention, but the gains are fragile. Students from top institutions and advanced programs still leave at disproportionately higher rates. Canada is educating globally competitive STEM talent in fields where U.S. entry barriers are relatively low—through TN visas and employer sponsorship.
Immigration does not offset these losses. Rather, it intensifies them. The Institute for Canadian Citizenship’s Leaky Bucket 2025 report2 shows that onward migration is highest among immigrants with doctoral degrees, strong earnings potential, and experience in management, ICT, engineering, and science based occupations. Within five years of entering Canada, highly educated immigrants are more than twice as likely to leave as lower skilled immigrants.
Weaker income growth further increases onward migration, particularly among immigrants with graduate degrees. This aligns with broader structural weaknesses: low productivity growth and too few firms scaling globally.
Evidence from post-secondary education institutions that foreign multinationals tend to recruit from reinforces the point. University of Waterloo data shows that the highest performing students are the most likely to leave Canada after graduation3. Among Canadian born students, exit rates at the top of the skill distribution are roughly double those at the bottom. For international students, top performers are twice as likely to leave as Canadian-born top performers. This is not due to poor domestic compensation; top graduates earn well by Canadian standards. They leave because compensation and upward mobility for their skills are simply higher elsewhere.
At this stage, the issue is less about migration policy than innovation performance. The Council of Canadian Academies’ State of Science, Technology and Innovation in Canada 2025 finds that Canada performs strongly in education and research but lags in business R&D, technology adoption, firm scale up, and commercialization. Canada generates ideas and talent but struggles to translate them into globally competitive firms. As a result, the economic returns to Canadian innovation are frequently realized abroad. Though this is not universal across sectors. In areas where domestic industries are comparatively less mobile but highly innovative, such as healthcare, Canada has success in attracting either highly sought after international talent or attracting back Canadian talent4.
Talent loss compounds these weaknesses. High skill exits reduce managerial capacity, entrepreneurship, and knowledge spillovers. Over time, this helps explain why sustaining Canada’s living standards has a growing reliance on population growth rather than productivity growth.
This is not a repeat of the highly visible “brain drain” of the 1990s. The flows are quieter, more selective, and harder to measure—but potentially more damaging. Canada is not hollowing out; it is spilling out at the top.
What’s sucking up Canada’s top talent?
1. Canada's struggles to grow small businesses and the missing middle
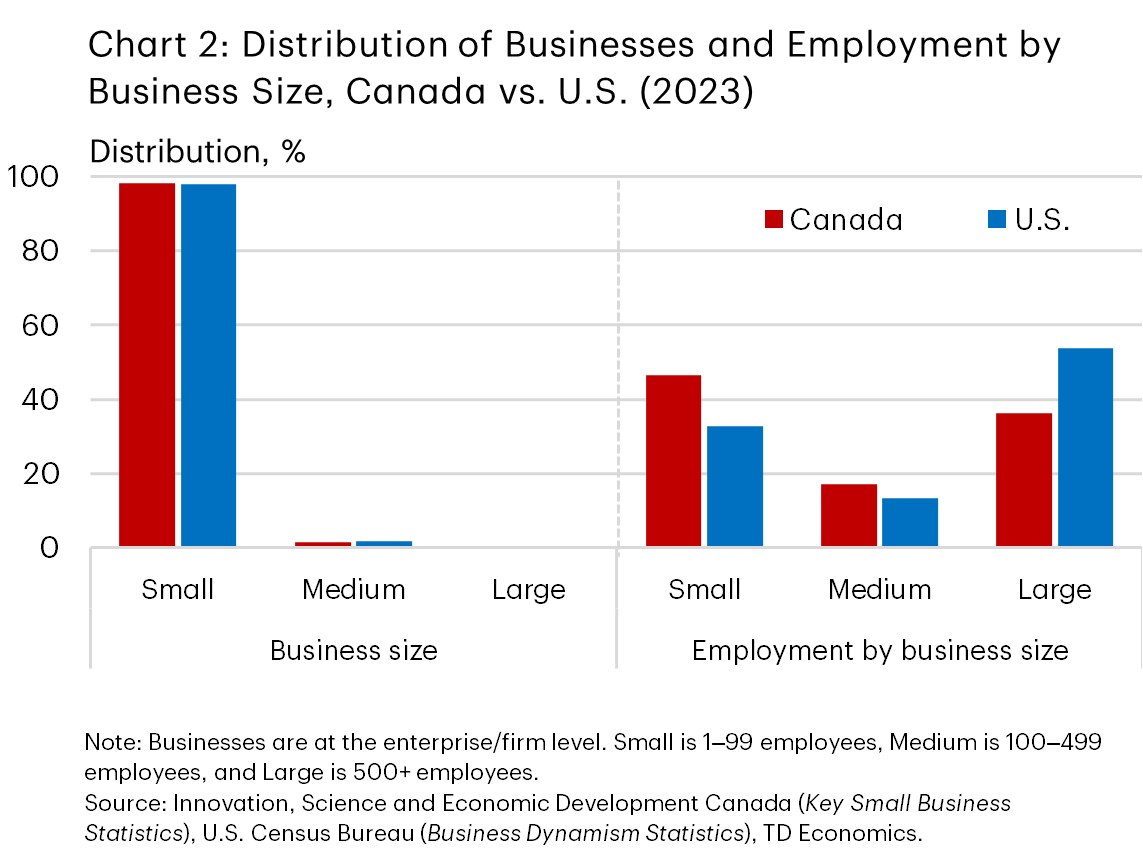
The core challenge is not attraction but anchoring. Canada educates world class talent and selects skilled immigrants effectively. It lacks scale and consistency to incent the creation of larger globally competitive businesses. We’re not talking about firms of the scale of U.S. tech behemoths, but Canada has a unique problem of the “missing middle” that would help retain talent at home. The structure of businesses in Canada are actually similar relative to the U.S., with approximately 98% of business being small, less than 2% being medium-sized enterprises, and a small fraction of large enterprises. Where the difference lies is in the employment share. Canada relies more on small enterprises for the majority of employment – over 1 million firms account for more than 5.8 million employees, or 47% of total employment. In the U.S., this share is lower at 33%. For medium and large-sized enterprises, Canada’s employment shares are 17% and 36%, respectively, versus 13% and 54% in the U.S. (Chart 2)
This aligns with longstanding concerns about business dynamism in Canada with relatively older small to medium enterprises that struggle to grow, either due to a lack of capital, compliance and regulatory challenges that grow with firm size, or, in the case of some small businesses, by choice. Hyperscalers and high-growth small and medium-sized enterprises (SMEs) are at the centre of more successful countries’ innovation and productivity agendas, notably the U.S., and without progress on that front, Canada risks losing much of its most sought-after talent, hobbling our own innovation economy.
2. Canada’s demotivating personal taxes
A key contributor to driving talent south is the giant American elephant in the room. With deep, liquid venture capital markets, economic and technological clusters in countless advanced industries, it is a magnet for high-skilled workers and entrepreneurs of every nationality looking to maximize their labour and capital returns. Evidence suggests that the median pre-tax wage for tech workers in America is 46% higher than its Canadian counterpart, not even factoring in the steep decline of the Canadian dollar over the last year5. Worse still, American technology firms tend to apportion a larger share of total compensation in equity, meaning the potential gain above and beyond what Canadian firms offer are that much higher. That compensation gap, along with the growth potential on offer in the U.S., is and will be an ongoing challenge to Canada in retaining top talent.
But Canada’s personal tax system does itself no favours from a competitiveness perspective. Not only do Canada’s top marginal tax rates tend to be higher than even the highest tax U.S. states, income thresholds are also far lower.
The top marginal tax rates in Canada are above 50% in Ontario (53.53%), Quebec (53.3%), and BC (53.5%), with Alberta coming in just slightly below at 48%. Meanwhile, even in the highest tax jurisdictions of California and New York City (which is one of several municipalities with a local income tax), the top marginal tax rate sits lower at 50.3%, and 52%, respectively. In high-growth Florida and Texas, state income taxes don’t exist, meaning individuals only pay the highest federal income tax rate at 37%. Incidentally, the gap in top marginal rates between US states plays out in precisely the same fashion from a skilled labour perspective. California has seen a net population outflow of nearly 300,000 since 2020 to Texas and Florida. New York has meanwhile lost 217,000 to these two states. Recent years have also seen high-profile firms moving their headquarters to Texas on the back of the state’s lighter-touch approach to regulation and ability to take advantage of skilled labour flows, including Oracle, Tesla, Dell, Chevron, and X/SpaceX. There is little doubt that these flows also have a strong cost-of-living dimension to them, with California and New York benefiting from cluster effects of marquee industries located there, even with high marginal tax rates.
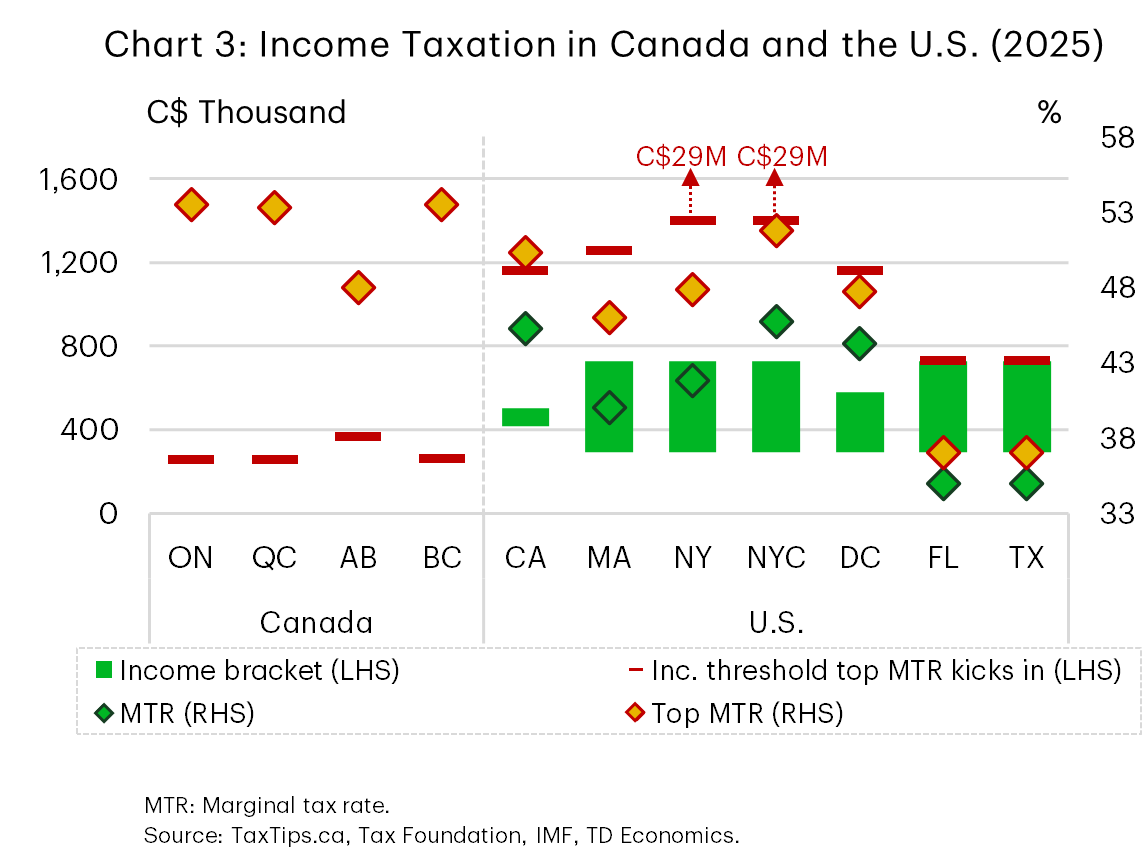
Incidentally, this is where Canada’s taxes become highly demotivating, because high marginal rates in high-tax U.S. states tend to hit at commensurately high levels of income. In contrast, Canada’s highest marginal rate binds at the highest federal income threshold of $218,460, adjusted for purchasing power parity, for the 2025 tax year. In California, the highest tax rate doesn’t kick in until $1,000,000, while in New York City (which also charges a municipal income tax), the highest threshold of 51.78% doesn’t kick-in until $25,000,000 in income. Were we to compare Canada’s and the U.S.’ tax rates at Ontario’s top income threshold, the marginal tax rate in California and New York City fall to about 45% (Chart 3). Even if we were to adjust that for average expenditures for high health care premiums in the U.S. (particularly those with employer-sponsored coverage), the gap in the after-tax take is simply too large to ignore, particularly over an entire career for recent graduates.
Canada’s system also struggles with inflation indexing income tax thresholds, exemptions, and credits.
Federal income tax thresholds, for example, are tied to annual increases in the consumer price index. However, provincial income thresholds are a mixed bag. Manitoba follows suit from the federal government. Nova Scotia and PEI do not index at all. Ontario indexes its bottom three thresholds, but not its top two at $150,000 and $220,000 and has not done so since their inception in 2014. Every year, a growing share of Ontarians creep into higher brackets, a de facto tax increase that seems invisible to all but the most astute taxpayers. In the 2014 tax year, just 4.4% of taxable returns reached the $150,000 threshold in the province. A decade later, that share has nearly doubled to 8.4%, as of the 2023 tax year.
While this specific bracket creep primarily impacts higher-income earners, non-indexation also impacts lower-income families through the benefits and exemptions delivered through the tax system. The most widely cited of these is the federal childcare expense deduction. The deduction was increased to $7,000 in the 1998 federal budget and to $8,000 in the 2015 budget. Had the deduction been linked to the CPI after 1998, it would be nearly $12,600 today. Other areas include the CPP basic exemption, which has been $3,500 since 1996 despite annual increases in the yearly maximum pensionable earnings, GIS income exemptions, and tax credits, including the first-time homebuyers tax credit, education and tuition credits and the pension income credit6. These all act as slow, “invisible” tax increases on families.
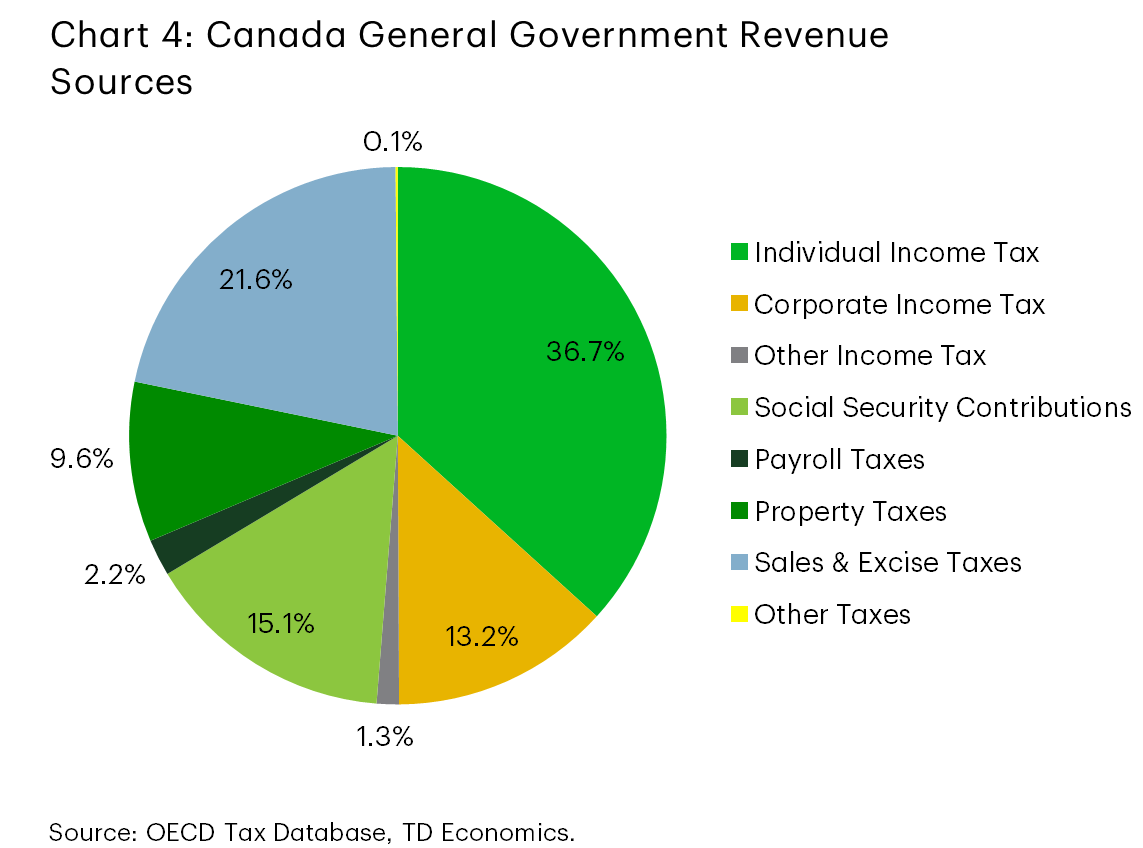
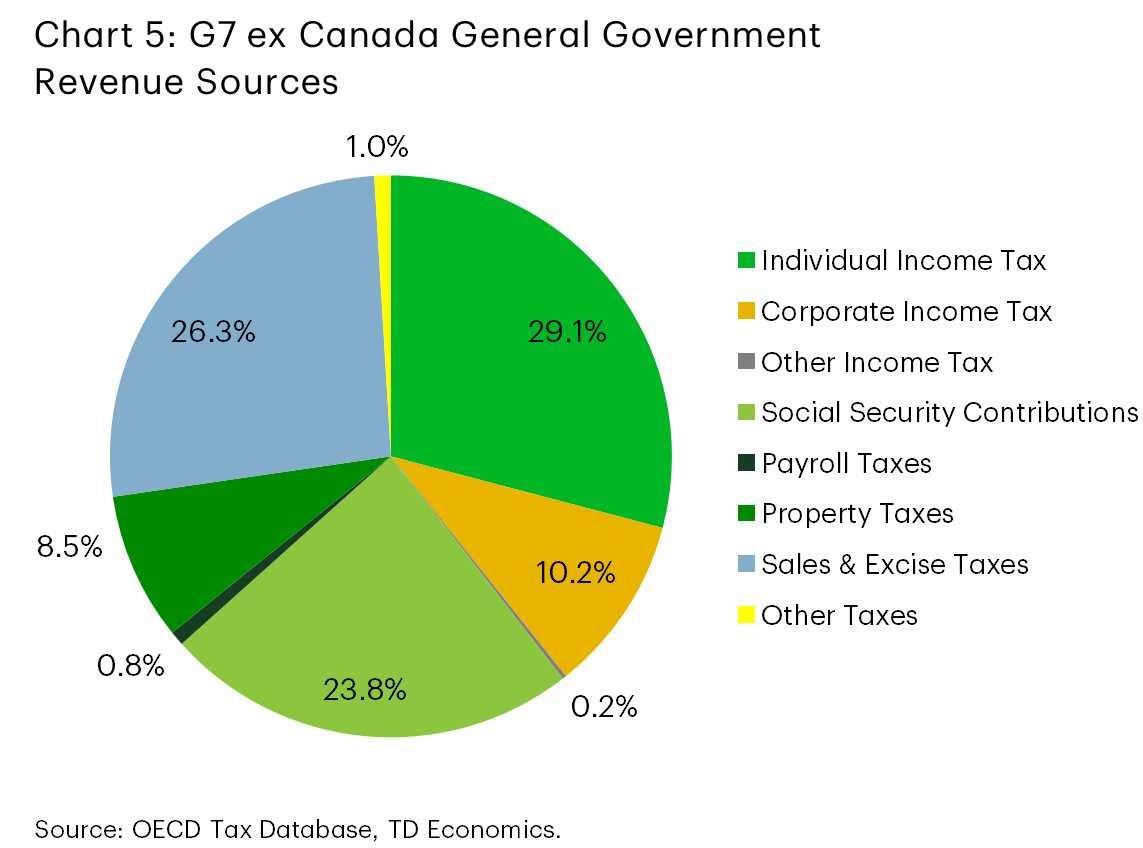
Of course, the average Canadian is unlikely to conduct detailed analysis of average and marginal tax rates on earnings over time. But they are certainly feeling it when a rise in earnings still contributes to the longstanding feeling of “not getting ahead’ or worsening affordability. While anxiety about the cost of living tends to focus on sticker prices of everyday goods and services, the parts are greater than the whole – how much is left at the end of the month (or year) matters. Indeed, Canada draws far greater of general government revenues from individual income taxes relative to its G7 counterparts, so some rebalancing needs to be considered (Charts 4 and 5).
3. Canada’s labyrinthine business taxes
While elevated personal marginal rates primarily distort labour supply decisions for salaried employees, the Canadian tax regime’s impact on entrepreneurs and business owners is far more nuanced. Canada’s complex corporate tax architecture paradoxically imposes high statutory rates relative to the U.S., while providing ample deferral opportunities. This complexity incentivizes tax-driven financial engineering rather than productive investment, allowing sophisticated owners to navigate the labyrinthine corporate tax system through strategic tax planning.
One might easily pass this off as something that should be tied off, but policymakers are caught in a bind. Aggressive tax planning almost certainly creates horizontal equity considerations given T4 workers earning equivalent incomes have no way to avoid their high marginal rates. But these strategies may be one of the few factors that prevent or limit entrepreneurial brain drain.
This bears out in the data for both high-earning workers and business owners. Research by Milligan and Smart (2014) showed that the elasticity of taxable income (ETI) is large for the highest earners – upwards of 0.69 for the top 1% and a massive 1.45 for the top 0.1%. The ETI measures the mechanical and behavioural response in taxable income to a hypothetical change in the marginal tax rate. An ETI as high as 1.45 suggests additional increases in the marginal tax rate would yield less revenue than simply maintaining the status quo. The ETI does not speak to the actual behavioural response – whether that comes in the form of tax planning or simply leaving for another jurisdiction, but it does reinforce the challenge faced by policymakers in trying to raise tax revenue when the top is as mobile as it is.
A prime example of how business owners can defer taxes is detailed by Wolfson, Brooks and Veall. Wealthy and high-income Canadians use Canadian-Controlled Private Corporations (CCPCs) to change the timing and character of their taxable income. The key advantage of these tax planning techniques is not usually permanent tax avoidance, but tax deferral—keeping funds inside the corporation for years or decades, allowing compounding at lower effective tax rates. Wolfson–Brooks–Veall show that retained earnings in CCPCs are highly concentrated among top income individuals, meaning that much economic income does not appear on personal tax returns in the year it is earned. This creates a gap between economic income and reported personal income at the top, exacerbated by the clustering of firms around the small business deduction.
From a competitiveness perspective, policymakers could notionally broaden out Canada’s tax base by using revenue gained by addressing tax planning strategies to lower the personal tax rates and make a dent in the distortionary impact of these high marginal rates creating less need for tax planning in the first place.
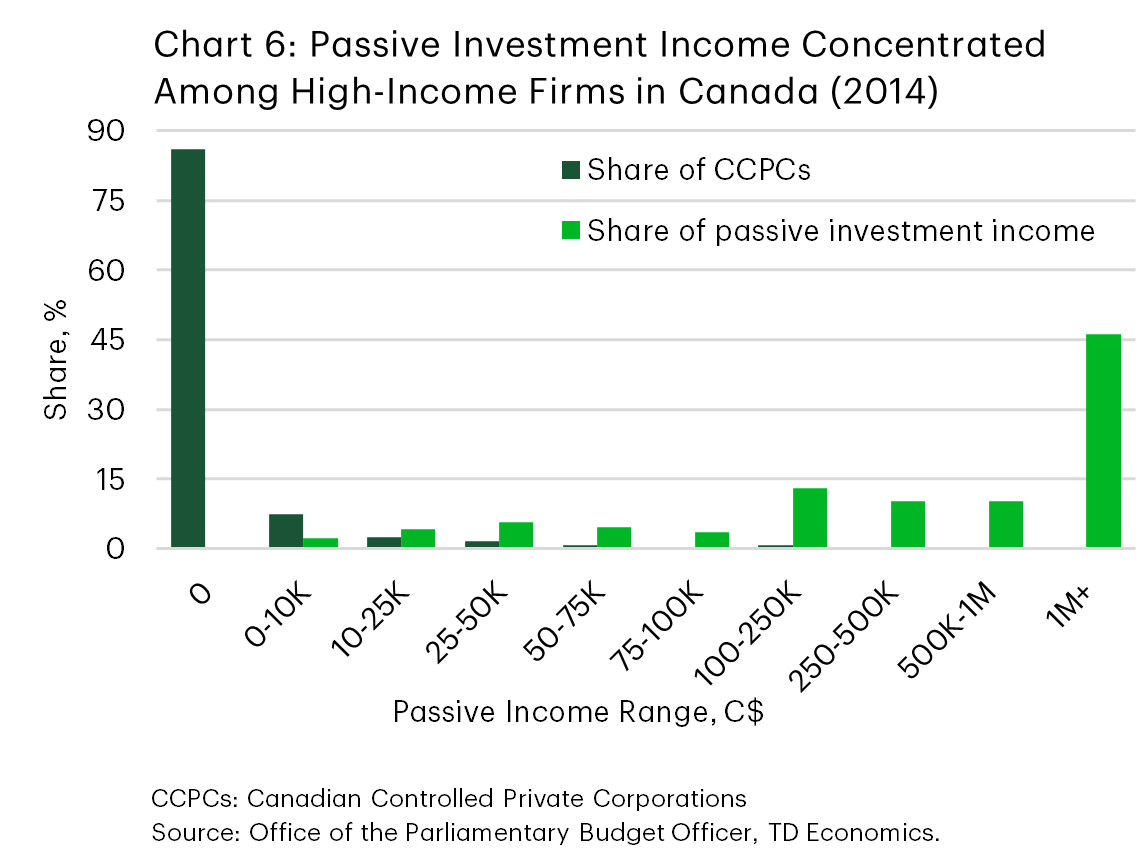
The federal government has made efforts to address some of these loopholes. The 2018 federal budget, for example, reduced the small business deduction for each dollar of passive investment income above $50,000 in order to prevent CCPCs from acting as unlimited RRSPs for business owners. Prior to this change, the top 1.4% of CCPCs earning at least $100,000 in annual passive investment income accounted for nearly 80% of all passive investment income earned in 2014 (Chart 6).
In addition, the budget also introduced TOSI, or tax on split income, to prevent income sprinkling of business income on family members who may or may not have contributed to the business – though the post-2018 regime still allows for some sprinkling.
However, several highly contentious methods remain, including surplus stripping: a method by which one beneficial owner transfers share ownership of one CCPC to a second CCPC in order to convert dividends into capital gains and access the lower capital gains inclusion rate. Many CCPCs also use the capital dividend account to funnel after-tax capital gains and purchase life insurance, using the lower-taxed retained earnings to pay premiums, allowing heirs to receive inheritance tax-free through the insurance payout upon the death of the owner.
Proponents argue that these tools are necessary to stem brain drain, as many entrepreneurs and business owners could otherwise shift businesses south. However, these tax planning strategies are costly and time consuming, and ultimately demonstrate the negative incentive structure. Simply reducing personal income tax rates might alleviate the need for business owners to be as aggressive.
There is serious question, however, about how much tax revenue could be raised by addressing aggressive tax planning strategies. Estimates for how much revenue was reclaimed by TOSI and the new passive income investment rule in 2018 are unavailable from the Department of Finance or others, but given the overall trajectory of corporate tax revenue, it is unlikely to have made a major dent. Still, the fact that tax planning strategies are a thriving business is a strong indicator that the tax system simply is not fit-for-purpose. Realigning the incentive structure to better reward labour outcomes could have a tangible impact on many of the issues discussed above.
A rock and a hard place
So where does this leave us? The drivers of the leakage of top talent are structural across numerous policy areas. The tax system alone cannot do all the heavy lifting to address this issue, but it does compound these pressures by imposing very high marginal tax rates at relatively low income thresholds, intensifying behavioural responses among top earners and encouraging either aggressive tax planning or physical relocation. The prevalence of income shifting through CCPCs is not a solution but a symptom of a system that is misaligned with competitiveness and growth.
The core policy implication is that we must focus on anchoring talent in Canada which excels at producing it. That requires improving the domestic returns to skill through stronger innovation performance, deeper capital markets, and firms capable of scaling globally. At the same time, realigning the personal tax system – such as by reducing distortions at the top – could meaningfully improve incentives while simplifying compliance.
But while the implication is clear, the specific tactics that will succeed in achieving that goal are not. Consider the C.D. Howe’s recent report recommending wholesale changes to rebalance personal, corporate, and sales taxes. The recommendations include lowering the general CIT rate to the small business rate to rid small businesses of their disincentive to grow, lower personal taxes at the higher-end to reduce the disincentive to work, raise the basic exemption to protect lower-income families, all while raising sales taxes to neutralize the revenue impact and reduce or eliminate tax expenditures. These are all policy changes that the economics and tax policy communities would extend full support towards given that the package represents a less distortionary, revenue-neutral view of what exists today. Yet it is a non-starter. Tax distortions are a challenging policy priority to sell to Canadians. Grand and complete tax policy overhaul is required, whereas policymakers tend to venture cautiously and selectively in execution. For instance, if the price of entry is raising sales taxes, any government would be challenged in building the political capital to execute without significant offsets in other areas of income taxes and carve-outs for lower income families. Yet, without progress on these fronts, Canada risks continuing to function as a feeder economy: producing world class talent, but exporting the economic returns elsewhere.
End Notes
- https://www150.statcan.gc.ca/n1/pub/36-28-0001/2025007/article/00006-eng.htm
- https://forcitizenship.ca/wp-content/uploads/2025/11/The-Leaky-Bucket-2025-Nov.-17.pdf
- https://clef.uwaterloo.ca/wp-content/uploads/2024/09/CLEF-074-2024.pdf
- https://torontolife.com/city/toronto-general-was-just-named-the-second-best-hospital-in-the-world/
- https://dais.ca/reports/mind-the-gap-compensation-disparity-between-canadian-and-american-technology-workers/
- https://cdhowe.org/publication/double-pain-how-inflation-increases-tax-burdens/
Disclaimer
This report is provided by TD Economics. It is for informational and educational purposes only as of the date of writing, and may not be appropriate for other purposes. The views and opinions expressed may change at any time based on market or other conditions and may not come to pass. This material is not intended to be relied upon as investment advice or recommendations, does not constitute a solicitation to buy or sell securities and should not be considered specific legal, investment or tax advice. The report does not provide material information about the business and affairs of TD Bank Group and the members of TD Economics are not spokespersons for TD Bank Group with respect to its business and affairs. The information contained in this report has been drawn from sources believed to be reliable, but is not guaranteed to be accurate or complete. This report contains economic analysis and views, including about future economic and financial markets performance. These are based on certain assumptions and other factors, and are subject to inherent risks and uncertainties. The actual outcome may be materially different. The Toronto-Dominion Bank and its affiliates and related entities that comprise the TD Bank Group are not liable for any errors or omissions in the information, analysis or views contained in this report, or for any loss or damage suffered.
Download
Share: