Canada’s Price-Taker Problem
Beata Caranci, Senior Vice President & Chief Economist
Andrew Hencic, Director & Senior Economist | 416-944-5307
Date Published: June 15, 2026
- Category:
- Canada Government Finance & Policy
Highlights
- Although Canada boasts the lowest net debt-to-GDP ratio among G-7 peers, it’s a small fish in a sea of global savings.
- Being highly susceptible to importing international financial conditions, the better debt position may not fully shield Canada from a negative turn in market sentiment targeted at countries whose fiscal houses are in more disrepair.
- Specifically, elevated and rising U.S. borrowing needs will dominate the supply of high-quality public debt issuance for years to come, increasing the competition (and cost) for other sovereign and high-quality corporate debt.
- Global savings are currently ample to soak up large public sector borrowing needs, but this condition should not be relied upon as time progresses.
The pandemic didn’t just kick off a borrowing binge, but also a period of sustained deficits. A massive stock of global sovereign debt that will need to be rolled over in the coming years. The price at which it can be done (i.e., the interest rate that investors will demand) will determine the scope governments will have for other initiatives (infrastructure, healthcare, defense, climate transition, education, housing). For a country like Canada that touts a solid fiscal reputation, it would be reasonable to expect its debt financing costs to reflect this status. However, Canada doesn’t operate in a vacuum. As a small fish competing in a sea of global savings, it imports financial conditions from the whale next door (the U.S.). Developments there go a long way in determining the financing costs north of the 49th parallel. In fact, U.S. financial conditions tend to reverberate around the world, and small open economies are particularly susceptible to its impacts, let alone one with tight economic ties. This argues that Canada needs to be more vigilant in ensuring stronger domestic fiscal conditions relative to peers to limit price-taking dynamics on future debt issuances. This will also help mitigate unintended consequences. The more that governments draw on international savings to fund their debt, the greater the risk of crowding out international investor dollars required by their domestic corporations competing in a similar high-grade credit space.
Reasons for Concern
While not a bastion of fiscal health, Canada stacks up relatively well against its G-7 peers. According to IMF figures, the overall net debt-to-GDP ratio of Canada’s federal and provincial governments ranks at the bottom of the G-7. Critics of this net debt measure rightfully point out that it’s flattered by the country’s large stockpile of financial asset holdings (including CPP and QPP assets) which are netted off against gross debt. However, these assets are included for good reason when comparing fiscal sustainability.
International accounting conventions do not include future social security liabilities on the balance sheet, under the presumption that governments can change benefits and taxes as needed to cover them. In practice, the liabilities will presumably need to be covered, and all G-7 nations face them. Canada, unlike most countries, has the associated assets to fund them in the future. So yes, the net figure is flattered by the assets, not because they can be liquidated to cover government obligations (they can’t), but because they will be used to service future liabilities that are not yet present on the balance sheet.
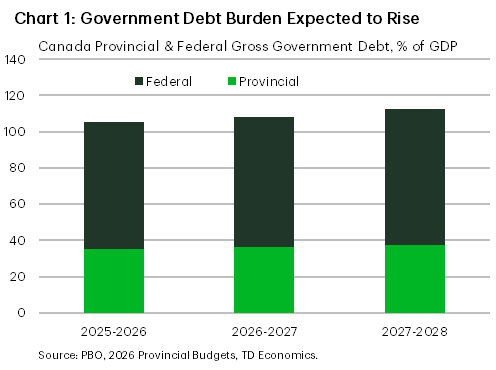
On a gross basis, the general government debt-to-GDP still enjoys an advantage against the U.S., Italy, France, and Japan, but continues to hover well above its pre-pandemic level. Moreover, updated budget projections suggest Canada’s general government gross debt-to-GDP is expected to rise modestly over the coming years amid sustained budget deficits (Chart 1). Importantly, these plans rely on Canada remaining on an uninterrupted economic expansion.
Likewise, the share of overall government spending relative to the economy is holding at multi-decade highs. In fairness, public and geopolitical pressure on governments is rising for large capital outlays — be it infrastructure, economic supports to offset U.S. tariffs, social and healthcare systems from an ageing population, or a new push to build out defense capacity. All advanced countries are facing political pressures that require skillful navigation in a sea of public demands. This journey will carry significant risks, particularly since it will be met with stormy business cycles along the way that will compromise government finances relative to current projections. For instance, during recessions between 1980 and 2015, Canada’s federal debt relative to GDP rose by an average of 3.6 percentage points.
Nowhere is this risk more evident than in the U.S., where the Congressional Budget Office (CBO) projects the (gross) federal debt-to-GDP ratio is slated to rise 1.8 percentage points by 2028 (to 123%) and by 13 percentage points (to 136%) by 20331 amid a continual economic expansion. The task ahead of them is daunting. Deficits ranging from five and six percent of GDP are expected to persist over the next decade. That’s because 73% of government expenses go to fund interest costs, social security, and medical support by 20362. If defense spending is included, the share jumps to 82%.
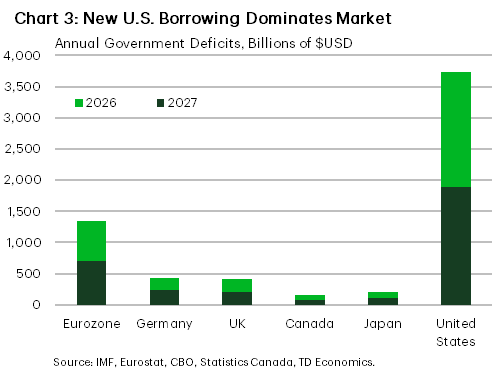
The volume of existing U.S. obligations requiring rollover, combined with the necessary new issuance amid historic deficits, are gargantuan relative to those of Canadian and other sovereigns (Chart 3). Moreover, because U.S. deficits are projected to be sustained in the coming years, a larger slice of the global savings pie will be in demand.
Them versus Us
The overwhelming influence of the U.S. means that it would be a mistake for Canadians to dismiss this as a “them” problem and not an “us” problem for three reasons.
First, all advanced-country governments will be competing for a limited pool of savings amid slowing economic growth prospects as the full force of aging demographics leaves its mark. Bending debt-to-GDP ratios in any significant manner will already be difficult. A convenient measure of debt sustainability is to compare the nominal GDP growth rate forecast against the effective interest rate on the country’s obligations (Table 1). When nominal output growth is higher than interest rate costs, the public debt-to-GDP ratio can decline even in the presence of moderate deficits.
Table 1: Economic Growth and Interest Rate Differentials
| Average Interest Rate (i) | Nominal GDP Growth (g) | i-g | ||||
| Canada | US* | Canada** | U.S.** | Canada** | U.S.** | |
| 2026 | 2.6 | 3.4 | 4.5 | 5.0 | -1.9 | -1.6 |
| 2027 | 2.6 | 3.4 | 3.4 | 4.5 | -0.8 | -1.1 |
| 2028 | 2.6 | 3.5 | 3.8 | 4.3 | -1.2 | -0.8 |
The recent energy shock has provided Canada a boost on this front. Nominal growth is expected to average nearly 4% over the coming three years, ahead of the average expected interest rate on federal government debt. For the U.S., expectations are for longer-term interest rates to fall this year, helping mitigate the future interest burden, while strong nominal growth expectations work to limit the risk from the growing debt burden. This underpins the forecast that, if all goes well on the economic front, Canada’s debt burden can stabilize despite projected deficits, while the U.S. will have a measure of offset for sustained deficits. However, it’s important to remember that these projections are riddled with risks. If growth falls below expectations without a corresponding fall in interest costs, total debt can rise. We have witnessed multiple supply shocks in recent years that create these exact negative circumstances. So, while borrowers can hedge against interest rate risk, macroeconomic shocks cause substantial variation in growth and revenues. The small wedge between growth and interest cost leaves minimal wiggle room. For instance, Canadian and U.S. nominal GDP growth in the 30 years between 1989 and 2019 varied, on average, by 2.7 and 1.6 percentage points, respectively. The implication is that perfectly normal wiggles in nominal GDP growth (even accounting for the prior year’s growth rate) can result in either country needing to raise more funds than expected.
 Second, a favorable growth-to-interest rate differential can be offset by planned deficit spending. Current CBO projections have the U.S. gross federal debt-to-GDP ratio rising only three percentage points despite deficits continually exceeding 5% of GDP. In Canada, weaker GDP growth means that modest federal deficit projections – starting from 1.9% of GDP and shrinking thereafter – leave the Office of the Parliamentary Budget Officer (PBO) expecting the federal gross debt-to-GDP ratio to rise by nine percentage points by 2030-20315.
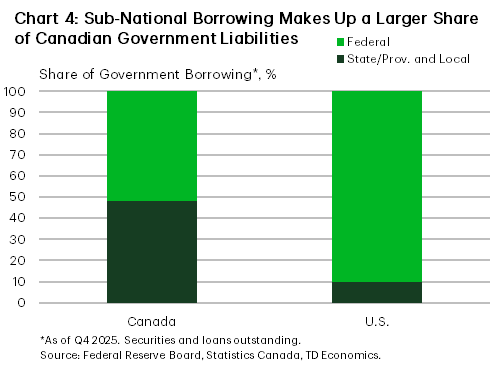
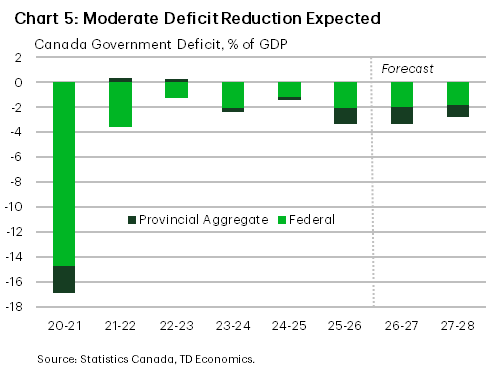
Moreover, in Canada, the Federal government is just one entity issuing sovereign debt. Unlike the U.S., regional governments in Canada make up about half of the country’s government borrowings (Chart 4) and have a high need for debt. Two provinces (B.C. and Nova Scotia) have had their credit ratings downgraded in the past year, and only Saskatchewan boasts credit ratings in the top two notches (AA+ or above) from ratings agencies. This divergence in credit quality suggests weaker-rated provinces could face higher borrowing costs over time. This amplifies the trickle-down risk that as federal borrowing costs rise, so too will those at the provincial and local level, pressuring public finances. This risk is enhanced given that only moderate deficit reduction is expected in the next two years (Chart 5).
Lastly, the ability to attract investor dollars isn’t isolated to the push-and-pull forces between sovereign borrowers. Growing U.S. government borrowing has historically been associated with a reduction in investor demand for corporate debt – especially within the same space of credit quality6. In addition, researchers found that U.S. financial intermediaries adjust portfolio composition away from corporate debt purchases when government debt issuance increases. Estimates from the NBER put the effect of a one percentage point increase in government debt-to-assets ratio leading to a fall of four-to-twelve basis points in the corporate loan-to-asset ratios of financial intermediaries7. In turn, this impacts the real economy.
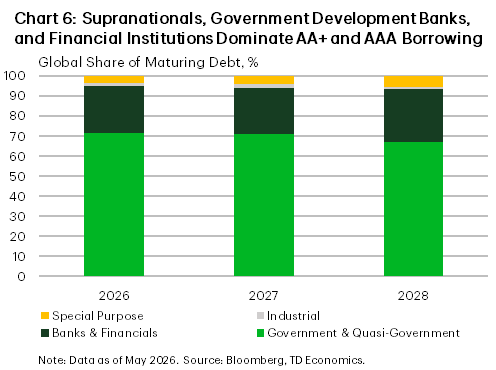
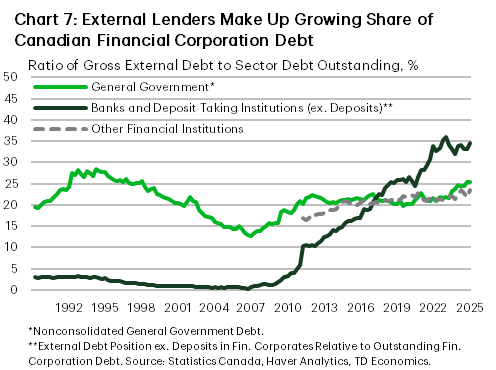
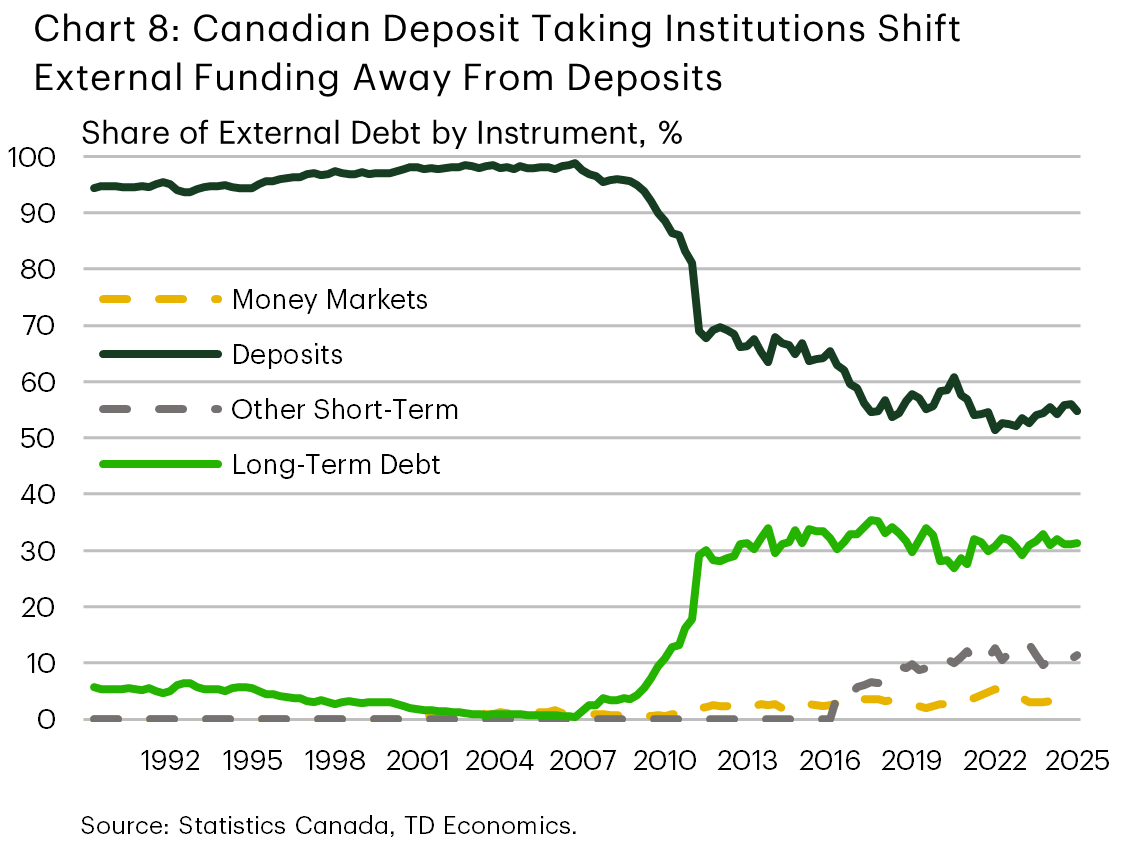
The issuers most directly competing for investors in the highest credit quality space (those holding one of the top two private credit ratings) tend to be governments or quasi-governmental agencies and financial services firms (Chart 6). In Canada, it has notably been its financial firms that have increased their reliance on foreign debt funding since the Global Financial Crisis (Chart 7,8).
Global Savings Glut Getting Thinner
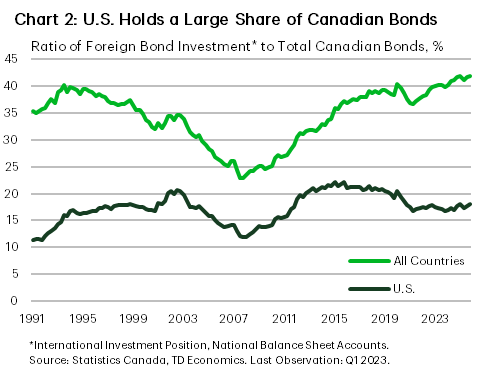
The extent to which borrowing costs adjust across the various Canadian entities ultimately depends on the amount of savings that will be looking for an investment home. Borrowers will be tapping both domestic and international sources. Although Canada is traditionally more reliant than the U.S. on domestic savings to fund investment, the marginal buyer sets the price, and one quarter of Canada’s current government debt is in competition with other sovereign yielding instruments of similar debt ratings (Chart 6).
For the U.S., current account deficits are expected to run well into the future, meaning the supply of savings from abroad will remain a crucial source of funding8,9. On this front, the past two decades have been marked by a global savings glut that helped anchor interest rates lower to attract sufficient investment. Some may recall a watershed speech by former Federal Reserve Chair, Ben Bernanke, (2005) discussing the savings glut created by the economic rise of developing nations led by China, combined with oil-producing countries in the Middle East and North Africa. The supply of savings was far greater than what could be absorbed by domestic investment opportunities. This mismatch was subsequently coined the global saving glut (GSG), necessitating a fall in world interest rates.
Today the global economy is moving away from this extreme situation of excess. China’s economy is slowing materially due to an aging population and other structural economic changes related to their financial and property sectors. Long gone are the double-digit economic growth rates after it entered the World Trade Organization amid early 21st century globalization. Instead, China’s economic growth is expected to trend towards 3.3% by 2030. In turn, this slows the pace of global savings creation.
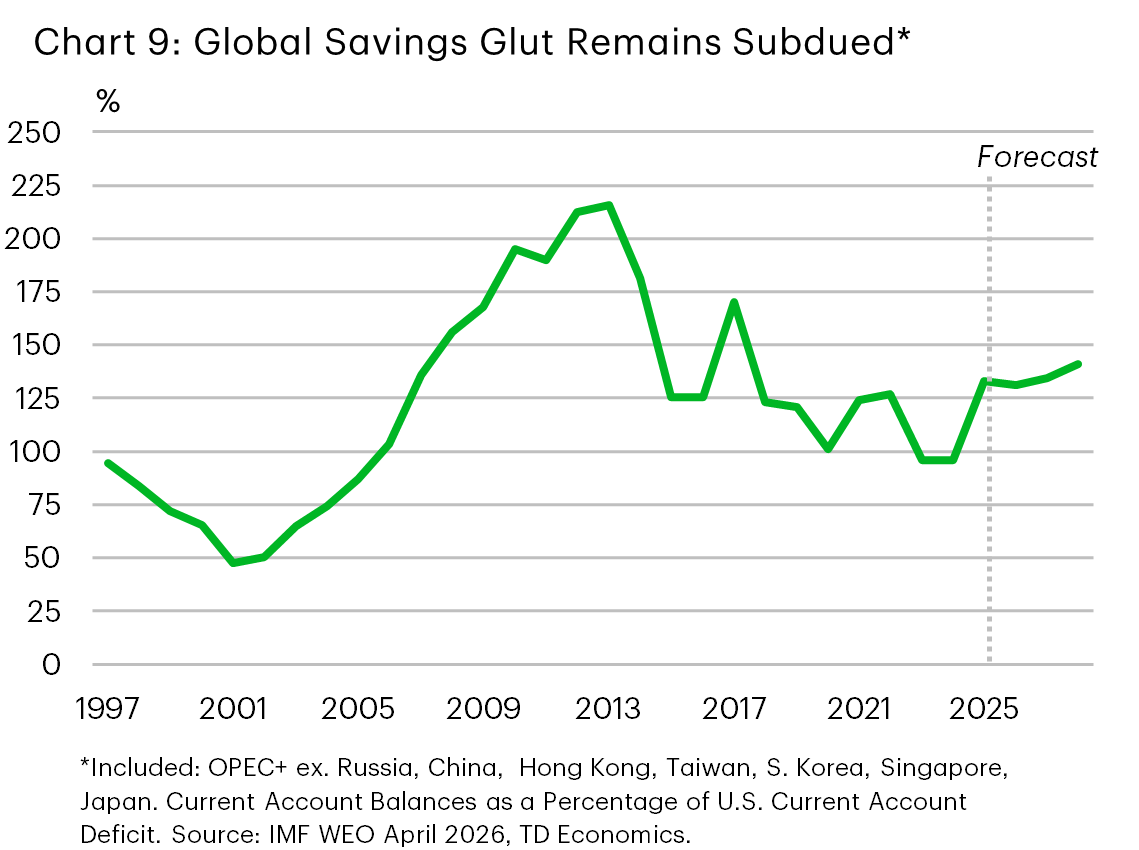
At the same time, investment outlays (on defense, the AI buildout and public infrastructure) are rising at a feverish pace, demanding more in savings than the investment cycle that preceded it. Recall the notion of secular stagnation? One view held that the dearth of investment was due to the rise of the digital economy that required less capital, leading to slower employment and output growth. Today, the opposite holds. AI hyperscalers and supply chain security initiatives have lit a fire under U.S. investment despite a high-interest rate environment. While these shifts reduce fragility in the supply chain system and should help to bring down the risk of future large economic disruptions, reallocation of production could offset some of the potential productivity gains from AI – reducing available savings. Moreover, even absent productivity losses, the shift of production to countries with lower savings rates could thin out the global savings pool. Ultimately, the coming years will see a normalization in the flow of savings (Chart 9). The amount should still be sufficient to meet U.S. needs, but the marginal cost of capital is likely to rise for them, Canada and others.
Conclusion
Canada has no control on the trajectory of U.S. fiscal finances and investment demands, but it does directly absorb the market implications. Governments should be cautious in resting on the laurels of currently having lower debt ratios than peer countries and be mindful that economic cycles don’t follow straight lines. Downside surprises on growth raise the specter of greater deficit borrowing and an even faster growing debt burden, particularly under intensifying demand for more supportive government policies on everything from affordable housing to social safety nets, to military spending, to supply chain resilience, and to clean energy alternatives. This will be occurring against a backdrop of large and growing U.S. deficits that risk pressuring up global interest rates, leaving smaller borrowers to compete in that space by either cutting back on spending plans or paying a higher rate to attract investor funds. In the competition for foreign investor dollars, high demands among governments also risk crowding out the needs of its private sector, ultimately impinging on competitiveness and economic growth.
End Notes
- CBO (Feb. 2026) “The Budget and Economic Outlook 2026 to 2036” https://www.cbo.gov/publication/61882
- CBO (Feb. 2026) “The Budget and Economic Outlook 2026 to 2036” https://www.cbo.gov/publication/61882
- Rey, H., (2015) “International Channels of Transmission of Monetary Policy and the Mundellian Trilemma”, Mundell Fleming Lecture. Link: https://www.imf.org/external/np/res/seminars/2014/arc/pdf/Rey.pdf
- Beaton, K., B. Deroches, (2011) “Financial Spillovers Across Countries: The Case of Canada and the United States”, Bank of Canada Discussion Paper 2011-1. Link: https://publications.gc.ca/collections/collection_2011/banque-bank-canada/FB3-4-2011-1-eng.pdf
- PBO (June 2026) “Economic and Fiscal Outlook – June 2026)” - https://www.pbo-dpb.ca/en/publications/RP-2627-002-S--economic-fiscal-outlook-june-2026--perspectives-economiques-financieres-juin-2026
- Graham, J., M. Leary, M. Roberts (2014) “How Does Government Borrowing Affect Corporate Financing and Investment?” NBER Working Paper 20581
- Graham, J., M. Leary, M. Roberts (2014) “How Does Government Borrowing Affect Corporate Financing and Investment?” NBER Working Paper 20581
- Bernanke, Ben S., (2005) “The Global Saving Glut and the U.S. Current Account Deficit” Federal Reserve Governor’s remarks at the Sandridge Lecture, Virginia Association of Economists, Richmond, VA. March 10: https://www.federalreserve.gov/boarddocs/speeches/2005/200503102/
- Barsky, R., M. Easton (2021) “The Global Saving Glut and the Fall in U.S. Real Interest Rates: A 15-year Retrospective” Federal Reserve Bank of Chicago: Economic Perspectives, No. 1, March 2021: https://www.chicagofed.org/publications/economic-perspectives/2021/1
Disclaimer
This report is provided by TD Economics. It is for informational and educational purposes only as of the date of writing, and may not be appropriate for other purposes. The views and opinions expressed may change at any time based on market or other conditions and may not come to pass. This material is not intended to be relied upon as investment advice or recommendations, does not constitute a solicitation to buy or sell securities and should not be considered specific legal, investment or tax advice. The report does not provide material information about the business and affairs of TD Bank Group and the members of TD Economics are not spokespersons for TD Bank Group with respect to its business and affairs. The information contained in this report has been drawn from sources believed to be reliable, but is not guaranteed to be accurate or complete. This report contains economic analysis and views, including about future economic and financial markets performance. These are based on certain assumptions and other factors, and are subject to inherent risks and uncertainties. The actual outcome may be materially different. The Toronto-Dominion Bank and its affiliates and related entities that comprise the TD Bank Group are not liable for any errors or omissions in the information, analysis or views contained in this report, or for any loss or damage suffered.
Download
Share: