2024 Canadian Oil Production
A Short-Lived Boom
Marc Ercolao, Economist
Date Published: March 7, 2024
- Category:
- Canada
- Financial Markets
- Commodities & Industry
Highlights
- After a relatively weak year for Canada’s oil producers, output growth in 2024 could amount to a significant 300–500k/barrels per day — putting the nation in the running to be the largest source of global oil supply growth.
- The Trans Mountain Pipeline is the biggest factor, with Alberta’s oil producers ramping up late last year in anticipation for it’s start up.
- In addition, the restart of the Terra Nova oil field in Newfoundland and Labrador (N.L.) should add a decent tally to national oil production growth.
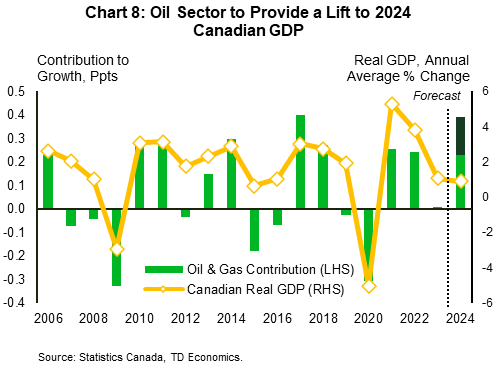
- Oil sector output could contribute 0.2–0.4 percentage points (ppts) to total Canadian GDP, offering an important buffer as the broader Canadian economy gears down this year.
- Global oil supply growth estimates vary based on differing agency projections, but Canadian oil could account for 25–67% of incremental supply in 2024. However, production growth will moderate in 2025.

Canadian oil production has always punched above its weight on the global scale. At last count, Canada ranked fourth across nations for total oil output, only trailing the global heavyweights of the U.S., Saudi Arabia, and Russia (Chart 1). While the gap between Canada and the world’s top producers is still comparatively large, the year ahead is shaping up to be a promising one for Canada’s energy sector. In annual terms, Canada has the potential to be the largest source of crude supply growth to the global market. In this sense, Canadian oil will continue to gobble up global market share (currently around 6% of total production), especially as U.S. production growth slows and OPEC+’s voluntary production cuts remain in place until at least June this year.
The expected sharp rise in oil output this year is a result of various factors. Lower production in 2023 due to wildfires, general maintenance at major oilsands facilities, and macroeconomic headwinds provide a favourable starting point for this year’s growth. Further, the long-awaited Trans Mountain Pipeline (TMP) expansion is virtually complete, adding nearly 600k barrels per day (bpd) in takeaway capacity, while Newfoundland & Labrador’s (N.L.) Terra Nova oil field has finally resumed production. Adding to this, a healthy commodities backdrop is spurring robust capital expenditure intentions for 2024 in order to support increasing industry output. Past this year however, production growth will moderate.
Canadian Oil Production by the Numbers

According to the most recent updates from the Canadian Energy Regulator (CER), Canadian oil output currently stands at around 4.9 million/bpd. Full data for 2023 is not yet available, but national production likely edged ahead by only around 50 thousand/bpd last year, or about 1%.
In 2024, we estimate that Canadian oil production could advance by 6–10%, roughly equivalent to 300–500k/bpd. The band is fairly wide to incorporate lingering uncertainties, but even on the low end, this would match average annual growth in the booming years between 2010–2015. On the high-end, it would take annual oil production growth to its highest level, outpacing the 370k/bpd growth in 2018 (Chart 2). At this level of growth, Canadian production would total between 5.2–5.4 million/bpd, a record-high.
This is significant for a few key reasons. Firstly, growth in this range would likely edge out U.S. oil production estimates for the year ahead. After U.S. production surged by almost 1 million/bpd in 2023, the Energy Information Administration (EIA) is now forecasting U.S. growth for the year ahead to slow to a more modest 170k/bpd. This is happening at the same time that the U.S. is importing record quantities of Canadian oil. Canada currently accounts for 60% of U.S. crude imports and this boost in demand should provide a tailwind for the Canadian economy, while also building up Canada’s share of U.S. crude oil imports. Second, a large chunk of the growth will be supported by the completion of the Trans Mountain Pipeline (TMP) expansion (details in the next section). This new export conduit will allow Canadian oil to more efficiently reach the U.S. and new international markets, tighten the discount for Canadian crude prices, and provide a boost to resource revenues.
Sources of Supply Growth
Trans Mountain Pipeline
After numerous delays and significant cost over-runs, TMP is set to be operational this year, likely next quarter. Its expansion, which is in the final stages of construction, will boost the pipeline’s capacity to 890k/bpd from the current 300k/bpd. In anticipation of the pipeline’s start-up, Alberta’s oil producers have recently ramped up production. In both November and December of 2023, oil production in Alberta reached nearly 4.2 million/bpd, pulling up the 2023 average to 3.82 million/bpd.
Flatlining production near December’s levels translates to 2024 annual growth of around 300k/bpd, or 8% year-on-year (y/y), just in Alberta alone (Chart 3). This is not an unreasonable assumption given the pipeline’s capacity to support additional barrels and the stated intentions of major producers to increase output this year.
Canadian oil prices, benchmarked by Western Canada Select (WCS), have been depressed for many years due to pipeline shortages and refinery and transportation costs. The discount to West Texas Intermediate (WTI) has hovered between $18–20 over the past several years to reflect these hurdles (Chart 4), but that spread should narrow as a result of the TMP completion. Looking forward, WCS prices could conservatively close the spread by $3–4/bbl later this year, which will incentivize production and support industry profitability.


The Terra Nova Assist
Newfoundland and Labrador accounts for roughly 5% of total Canadian oil output, with production in the province averaging around 250k/bpd since the year 2000. Over the past three years, the province’s fortunes have dwindled due to a combination of scheduled maintenance at major offshore facilities and the sidelining of the Terra Nova offshore oilfield since 2019. The restart of the latter at the end of 2023 will be the kicker in 2024, with Terra Nova now slated to make a meaningful impact on oil production in the province and the nation as a whole.
From 2002 (when Terra Nova became operational) to its shutdown in 2019, the oil field produced around 50k/bpd. It will take some time for Terra Nova to produce at full capacity, but the makeover is forecast to extend the vessel’s life by 10 years and produce an additional 70 million barrels. This year, Terra Nova could add around 30k/bpd in production, in line with 2015–2019 levels.
Industry Capital Expenditures to Remain Elevated
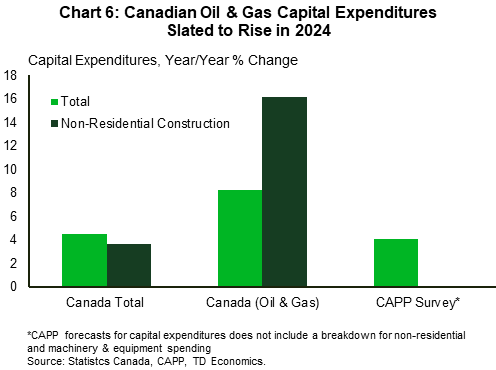
Strong commodity markets and an upswing in energy production is prompting oil and gas producers to boost capital spending for the coming year. The Canadian Association for Petroleum Products (CAPP) released their 2024 capital expenditure forecasts for the upstream oil and natural gas sector, pegging growth at just over 4%, after an almost 10% gain the year prior. Of this, Alberta’s oil sands investment levels are poised to reach $13.3 billion, up from the 2023 projection of $11.5 billion from last year’s forecast.


Statistics Canada’s updated survey on capex intentions reveals that for the oil and gas industry as a whole, planned capital expenditures are expected to grow by 8.2%, following a 12% increase in outlays last year. The majority of this growth comes through the non-residential construction channel as producers continue to expand operations and build facilities to support ongoing projects and increased production (Chart 6). The oil & gas sector’s capex growth plans outpace the all-industry average. In Alberta and Saskatchewan, which account for over 90% of Canada’s oil production, capital expenditure intentions in the oil and gas sector are pegged at a 7% in 2024.
The backdrop for oil markets continues to support production and capital plans for Canada’s producers. WTI prices have been building upside since trading at around $70/barrel at the beginning of the year. A mix of geopolitical tensions, strong demand, and general OPEC+ compliance toward supply cuts have allowed oil to move back to around $80/barrel levels. We believe this price accurately reflects supply-demand fundamentals and aligns with our forecast of an $80/barrel average in 2024, up a couple bucks from last year’s average.
Contextualizing Canadian 2024 Supply Growth

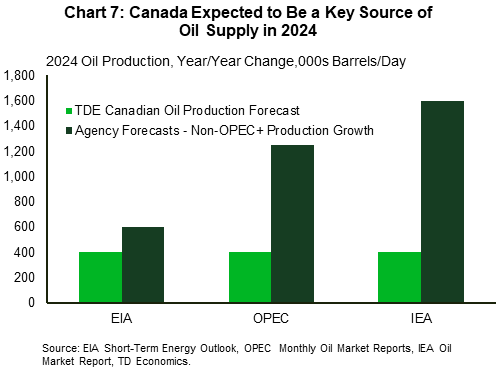
Total global oil supply growth is notoriously difficult to pin down, especially in the early stages of the year. We can put a band around supply estimates by looking at the most recent 2024 projections of the three major oil watching agencies–the Energy Information Administration (EIA), the International Energy Agency (IEA), and the Organization of the Petroleum Exporting Countries (OPEC). First and foremost, all three agencies expect world oil supply growth this year to be dominantly driven by non-OPEC+ sources, and mainly from Canada, U.S., Brazil, and Guyana. Amongst the three agencies, IEA projections for 2024 non-OPEC+ oil supply growth lead the pack at 1.6 million/bpd, while the EIA is forecasting a more conservative 600k/bpd. OPEC estimates fall in the middle.
Using the middle ground of the 300–500k/bpd estimate for Canadian oil production growth, Canadian oil could capture between 25% and 67% of incremental global supply this year (Chart 7). The likes of U.S., Brazil and Guyana could add around 200k/bpd each, less than what is expected out of Canada. To further put this figure in perspective, growth in Canadian oil output would outpace total production of African OPEC members Congo, Gabon and Equatorial Guinea.
Longer-Term Prospects Aren’t As Rosy
This year’s blend of factors that will push Canada to attain global swing-producer status will fade into 2025. Even though the TMP expansion adds significant pipeline capacity, the runway back toward capacity constraints has shortened, due in large part to the expansion’s lengthy delays. Canada has long suffered from insufficient pipeline capacity, a problem that would re-emerge if Western oil production continued at its expected 2024 pace of growth.This pace would push exportable volumes up against new total pipeline capacity potentially by the end of 2025/early-2026. Should this occur, downward price pressures on Canadian oil would re-emerge, and as such, we see Western producers being more diligent about production levels next year. To add, no major pipeline or offshore projects are in the Canadian cards for the foreseeable future, effectively limiting growth to incremental production from current producers plus any efficiency gains. We see Canadian oil production growth slowing to around 2% in 2025, equivalent to around 100k/bpd, less than the historical average of 150k/bpd.
Past this, production prospects, including future investment decisions, are clouded by the proposed Federal emissions cap on the upstream production sector, along with a suite of policies aimed at curbing downstream emissions and demand, such as the Clean Fuel Regulations.
On the flip side, some of this risk could be mitigated by the evolution the sector’s marquee carbon capture project, in which investment hinges on whether tools such as carbon contracts-for-difference come into form.
Bottom Line

Canadian oil is back in the spotlight for 2024. The boost in expected output is made possible by the Trans Mountain Pipeline expansion, the completion of maintenance at major facilities, continued sector investment and a still-supportive commodities backdrop. Production this year will carry positive impacts for Canadian real GDP, aiding a 2024 soft landing scenario. On an industry-level basis, the oil and gas sector accounts for 4% of total GDP. With annual production growth pegged between 6–10%, this translates to 0.2–0.4 ppts added to total GDP. This is potentially impactful as Canada enters a cyclical slowdown, where we expect growth to register under 1.0% (Chart 8).
Barring any unforeseen circumstances, Canada could be the largest source of increased oil supply across the globe in 2024. Canada should be able to capitalize on higher prices paid for our oil as well as the forthcoming ability to get Western oil reaching international markets.
That being said, this year’s pace of growth is unlikely to be sustained in the years following. Such levels of growth in 2025 and onwards could reintroduce pipeline capacity constraints, while future production and investment in the sector depends on future emissions caps and the rising price for carbon. As the production impulse from this year’s major factors begins to fade, we see oil production growth in 2025 pulling back to below-average levels.
Disclaimer
This report is provided by TD Economics. It is for informational and educational purposes only as of the date of writing, and may not be appropriate for other purposes. The views and opinions expressed may change at any time based on market or other conditions and may not come to pass. This material is not intended to be relied upon as investment advice or recommendations, does not constitute a solicitation to buy or sell securities and should not be considered specific legal, investment or tax advice. The report does not provide material information about the business and affairs of TD Bank Group and the members of TD Economics are not spokespersons for TD Bank Group with respect to its business and affairs. The information contained in this report has been drawn from sources believed to be reliable, but is not guaranteed to be accurate or complete. This report contains economic analysis and views, including about future economic and financial markets performance. These are based on certain assumptions and other factors, and are subject to inherent risks and uncertainties. The actual outcome may be materially different. The Toronto-Dominion Bank and its affiliates and related entities that comprise the TD Bank Group are not liable for any errors or omissions in the information, analysis or views contained in this report, or for any loss or damage suffered.
Download
Share: