Oil Market Update:
The Sweet and the Sour
Marc Ercolao, Economist
Date Published: October 12, 2023
- Category:
- Canada
- Consumer
- Commodities & Industry
Highlights
- Oil prices have undergone bouts of volatility this year as various supply and demand drivers contended against one another. The path forward for oil prices is highly uncertain, with the bull and bear cases being equally as compelling.
- The bull case for higher oil prices over the near-term include continued OPEC+ production discipline, declining U.S. and global inventories, geopolitical risks, and still-moderate inflation-adjusted oil prices.
- On the flip side, the bear case for lower oil prices include pressure on global demand, a hawkish Federal Reserve (Fed)and a broadly strong USD, and speculative positioning in oil contracts by money managers.
- Given the balance of risks, our forecasts land somewhere in the middle. We project oil prices to average US$84 per barrel (bbl) in the fourth quarter this year and an average annual price of $80/bbl in 2024.
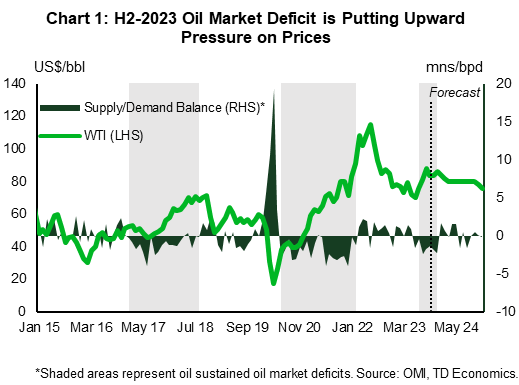
Crude oil prices have gone on a wild ride this year. Global demand concerns induced by ongoing recessionary fears continue to butt heads with projections of a tightly-supplied oil market, which is now firmly in deficit territory. On top of this, markets are continuously assessing potential supply risks from geopolitical tensions. After falling to as low as $66 per barrel (bbl) earlier this year, WTI climbed to a 13-month high of $95/bbl in September. Prices pared some of those gains in early October and have now settled around $84/bbl after the attack by Hamas on Israel this past weekend.
The million-dollar question is: where do prices go from here? Our view is that WTI prices will average $84/bbl through the rest of the year and $80/bbl in 2024. However, amid the high degree of uncertainty, it is prudent to examine the upside and downside risks. Let’s start with the bull case.
The Bull Case
OPEC-Engineered Supply Constraints
Saudi Arabia and other OPEC+ members have clearly demonstrated their willingness to keep a floor under oil prices. OPEC+ began making a splash in October 2022 when oil production quotas across member states were slashed by two million barrels per day (bpd) in response to heightened recession concerns. Since then, the group has implemented a string of further cuts, with Saudi Arabia and Russia most recently announcing an extension of their combined 1.3 million/bpd reduction through to year’s end. All said, this has fueled worries around a wider market deficit in the fourth quarter. The projected shortfall of close to 2 million/bpd is slightly deeper than the 1.5 million/bpd average historical deficit. By rough estimation, a quarterly average deficit of around 2 million/bpd equates to a $3 increase in average oil prices for a given quarter. The price rally from mid-year lows was generally expected as evidence of supply deficits in physical markets began to materialize (Chart 1). In its latest October meeting, OPEC+ left its oil output policy unchanged, but noted that they “will continue to closely assess market conditions”. OPEC+ has regained its position as a global swing producer and has the ability to tighten markets further via extended or new production cuts, which would put upward pressure on oil prices.
Dwindling Inventories
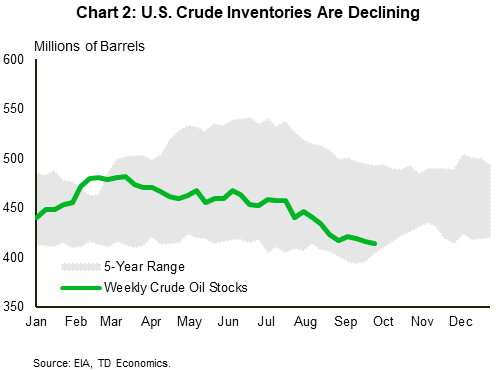
Crude oil inventories are beginning to roll over. U.S. oil stockpiles are now sitting close to five-year average lows, with continued draws threatening a break below this range (Chart 2). Data out of the EIA showed weekly U.S. crude stockpiles falling by 2.2 million barrels. This marks the third weekly drawdown of such a magnitude. This puts cumulative draws at over 50 million barrels since the beginning of April, which has driven current inventories close to levels last seen since 2018. This exacerbates concerns about tight global supplies over the remainder of the year, especially as crude stocks at the key Cushing, Oklahoma storage hub recently dropped to the lowest level since July 2022. Outside of the U.S., global oil inventories are also on the decline.
Elsewhere, inventories held by the U.S. Strategic Petroleum Reserve (SPR) dropped to a 40-year low after a series of emergency drawdowns commenced in 2020. The Department of Energy announced that it would prefer to buy crude oil to refill the SPR at a range of $67 to $72 a barrel – current prices are around 20% above that. Any attempt to replenish the depleted reserves would boost demand, keeping a floor under prices. More importantly, the U.S. no longer contains the same firepower to release barrels to the market to counteract against supply disruptions.
Geopolitical Risks
Crude oil markets are heavily reactive to developments on the geopolitical landscape. Oil prices initially jumped around $5/bbl as a direct result of the surprise attack by Hamas on Israel. The effect on oil prices appears relatively contained for now, as these regions are not major producers of oil. However, the risk of wider instability in the Middle East remains the biggest risk, notably with respect to the regionaly intertwined powers of Iran and Saudi Arabia. If Iranian intelligence is linked to the Hamas attack, supply and exports out of the region face signifcant downside risks. The conflict also likely dims the potential for a Saudi-Israel deal which reportedly is tied to rising Saudi oil production in early 2024. Recall that oil prices soared to more than $120/bbl in the wake of Russia’s invasion of Ukraine in February 2022. The near-term impact on supply and demand this time around is much different – likely negligible for now –but at a minimum, another major conflict means more geopolitical risk being priced into oil markets moving forward.
Oil Prices Are High, But Not That High
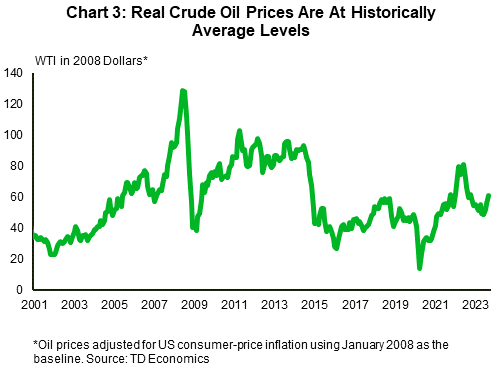
Even as fears around the $100/bbl percolate, when adjusted for inflation, current prices don’t look nearly as alarming. Chart 3 illustrates that when adjusted by the U.S. Consumer Price Index, today’s prices are around 50% less than the peak in 2008, and 20% lower than the 2011–2015 average real price. This suggests that the world economy is better positioned to tolerate $100 crude than in past run-ups. As the decade-long global energy transition runs its course, the world has become less oil dependent than in the past, making overall consumption less susceptible to higher prices.
The Bear Case
Demand Under Pressure
Showing surprising resilience, global oil demand is on pace to grow by a healthy 2.2 million/bpd in 2023, led by resurgent Chinese consumption earlier this year. The Western world also looks set to consume more crude oil in 2023 than it did last year. However, the prospects for a sharp pullback in oil demand growth remains high. China’s economic outlook continues to face major headwinds, and as consumers of 16% of the world’s oil, it will weigh on prices. However, it is worth noting that China is mulling new stimulus measures with a price tag of around one trillion yuan (roughly 0.8% of GDP). Timing, details, and implementation are unknown. Pushing forward with new stimulus should help offset some demand weakness in the Middle Kingdom, but it likely wouldn’t be enough to turn the tides on a global scale.
Stateside, crude oil consumption faces downside risk as manufacturing activity and consumer spending slows. In recent news, EIA data showed gasoline inventories rising by 7.5 million barrels over the last couple of weeks, flashing a warning around flagging consumer demand. Should lackluster oil demand growth collide with non-OPEC and U.S. supply growth and OPEC+ unwinding voluntary cuts, oil prices will be dragged down in the process.
A Hawkish Fed and Dollar Strength
By most metrics, the U.S. economy has consistently surprised to the upside for the better part of the last year. As a result, the Federal Reserve was forced to raise its policy rate to its current level of 5.50%. The Fed has communicated “higher-for-longer” interest rates as their current stance, as highlighted in their recent Summary of Economic Projections (SEP). This is also the consensus view of markets. As a result, U.S. yields have been driven to multi-year highs, dragging up the USD in the process. Since July of this year, all G10 currencies have depreciated against the dollar.
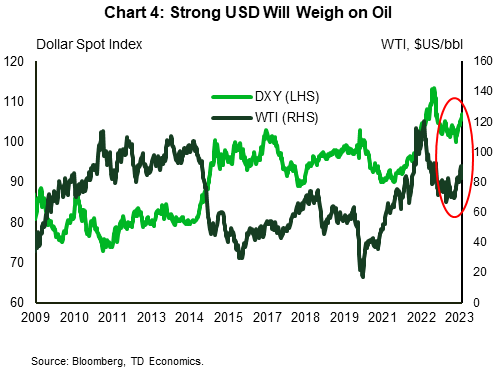
Historically, oil prices have tended to have an inverse relationship with the US dollar. Countries that import oil pay for it in USD, and when the USD falls, it becomes relatively more affordable to purchase, which in turn drives up crude prices. This correlation has flipped strongly positive over this year, whereby crude oil prices have moved in lockstep with the dollar (Chart 4). This relationship can be partially explained by the evolving fundamental landscape of oil prices, where supply concerns are driving disproportionally more of the upward move in oil, outstripping the USD price effects. However, as balancing supply and demand conditions next year clash with broad dollar strength, we can expect the historical properties of negative correlation to re-apply downward pressures on the price of oil.
Net Long Exposure
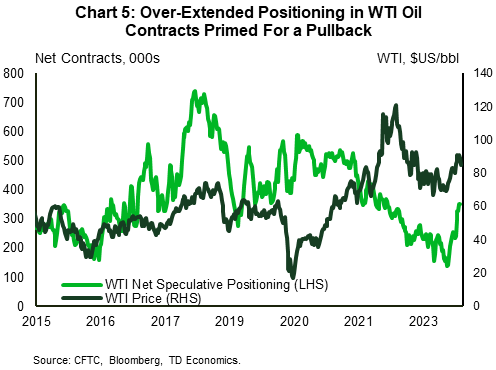
Nearer-term oil prices correlate well with net speculative positions in oil by money managers. Bullish positions (as measured by net commercial longs) have built up over the summer months. Before the crude price pullback that started at the end of September, U.S. speculators boosted their net long futures and options positions to the highest point since May 2022 (Chart 5). Commercial long positions have been higher in the past, so there could be room for some additional upside over the very near term. But as good news quickly gets priced into markets, the pendulum invariably swings back the other way, with prices following suit. Overall speculative positioning will ebb and flow, but increased sensitivities to the oil outlook now versus the past will make these positions more susceptible to reversal, one potential sign of downward moves in oil.
Bottom Line
Oil price volatility is here to stay but fundamentals will ultimately guide the path forward for crude prices. OPEC+ indeed has an incentive to keep oil prices elevated, but there is a limit to the upside on fears of demand destruction. On this note, supply constraints only look to be a major concern for the remainder of the year before markets slowly come into balance next year. We also expect global oil demand growth to slow, but not outright contract, as we anticipate major oil consuming countries will avoid a recessionary scenario. For now, we have not over-prescribed geopolitical risks to our forecast, but we will monitor them on an ongoing basis. As such, our near-term outlook for WTI oil prices falls somewhere in the middle of these balance of risks. We forecast oil prices to average $84/bbl in the fourth quarter of this year with an average annual price of $80/bbl in 2024.
Disclaimer
This report is provided by TD Economics. It is for informational and educational purposes only as of the date of writing, and may not be appropriate for other purposes. The views and opinions expressed may change at any time based on market or other conditions and may not come to pass. This material is not intended to be relied upon as investment advice or recommendations, does not constitute a solicitation to buy or sell securities and should not be considered specific legal, investment or tax advice. The report does not provide material information about the business and affairs of TD Bank Group and the members of TD Economics are not spokespersons for TD Bank Group with respect to its business and affairs. The information contained in this report has been drawn from sources believed to be reliable, but is not guaranteed to be accurate or complete. This report contains economic analysis and views, including about future economic and financial markets performance. These are based on certain assumptions and other factors, and are subject to inherent risks and uncertainties. The actual outcome may be materially different. The Toronto-Dominion Bank and its affiliates and related entities that comprise the TD Bank Group are not liable for any errors or omissions in the information, analysis or views contained in this report, or for any loss or damage suffered.
Download
Share: