Highlights
- The distributions of household economic accounts revealed widening income disparities not seen since 2015, with the wealth gap expanding due to financial asset gains accruing predominantly to the wealthiest.
- Relative to pre-pandemic levels, an average household across the income distribution saw gains in both income and wealth. However, average personal disposable income for middle-income families have not kept pace with rising prices. Additionally, these families have become more indebted.
- Middle income families have been key drivers of spending growth during the pandemic, and are now facing greater liquidity constraints. Forced to economize, their spending is likely to revert to historical norms, creating a drag on growth. Meanwhile, spending of the highest income earners will become a critical swing factor in determining the degree of economic resilience.
Statistics Canada’s latest data on the distributions of household economic accounts showed that the income gap has widened to levels not seen since 2015. The wealth gap has also expanded due to financial asset gains accruing predominantly to the wealthiest. The distribution matters for Canada’s bottom line. Consumer behavior is not uniform across income levels, and a change in income or wealth has a different impact on spending decisions in households of different incomes. Notably, the marginal propensity to consume out of income is lower at higher incomes. Conversely, for low-income households, a large share of income is already spent on necessities like food and shelter, so any income gains are more likely to be funneled directly into consumption.
Therefore, this distributional detail can help shed light on the direction of saving-spending behavior in the near future. Furthermore, the most significant rate increases in several decades has had a unique impact on families across the income distribution.
Wealth and Income Inequality worsened in 2023
We already knew that national household net worth—total assets minus liabilities—increased by over $700 billion, or 4.5%, year-on-year to $16.4 trillion in 2023, rebounding from a decline of nearly 6.5% in 2022. And disposable income rose by 5.5%, in line with the previous year’s growth rate. However, the distributional accounts revealed that these gains were not evenly shared across the incomes.
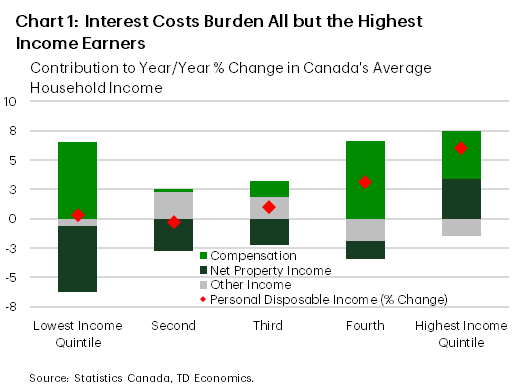
Income inequality worsened in 2023, with the largest disparity in disposable income shares between the highest and lowest income quintiles since 2015. Specifically, household income in the highest quintile averaged $197,909, up 6% from the previous year. In contrast, families in the bottom and second quintiles saw their incomes increase by only 0.3% to $31,518 and decrease by 0.3% to $59,178, respectively. Net property income was the most significant drag on average incomes across all but the highest income group, as rising interest payments overshadowed gains from investments (Chart 1).
The net worth, or wealth, picture is somewhat brighter, as all families were, on average, better off in 2023, achieving wealth gains of 1.8-2.8%1. Higher-income households benefited relatively more due to their larger holdings of financial assets, which were the main wealth drivers last year. However, real estate assets, which form a substantial portion of wealth for lower income quintiles, depreciated. This was exacerbated by a faster year-on-year increase in mortgage debt, used to finance these assets, compared to prior levels.
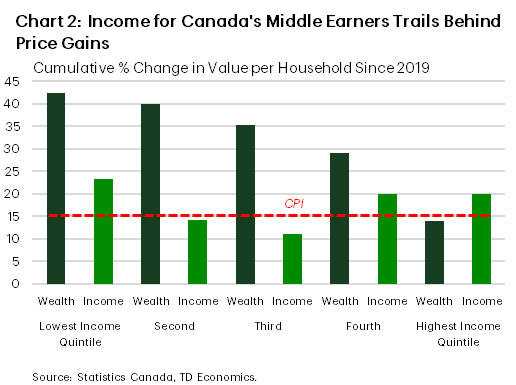
Relative to pre-pandemic levels, an average household across the income distribution saw gains in both income and wealth. However, when compared to inflation, not all these gains kept pace. Notably, average personal disposable income for the second- and third-income quintiles were lower than the cumulative increase in CPI, suggesting that their real income is now lower, on average (Chart 2). However, relative gains in wealth were greater for lower income households, even when adjusted for inflation. This is especially true for gains in real estate wealth, where gains ranged from 29% for the highest income quintile to 56% for the lowest income quintile. Also, according to the Bank of Canada research, real estate is the major contributor to the wealth effect in Canada2. So, cumulative gains in this asset have likely supported consumer spending.
Liquidity-constrained, Middle-Income Families Poised to Spend Less
Despite a sizeable deceleration, consumption across the income distribution remained relatively stable, growing within a very narrow range of 5.1-5.5% in 2024. This, however, was achieved by cutting back on discretionary items, such as furnishings & household equipment, recreation & culture, with lower income households cutting back the most. Meanwhile, inflation on necessities forced low- and middle-income households to rely on their savings to make ends meet. This will have direct implications on future spending as these families will have fewer liquid resources to tap into.
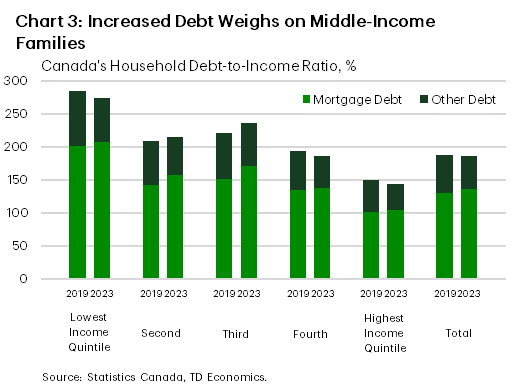
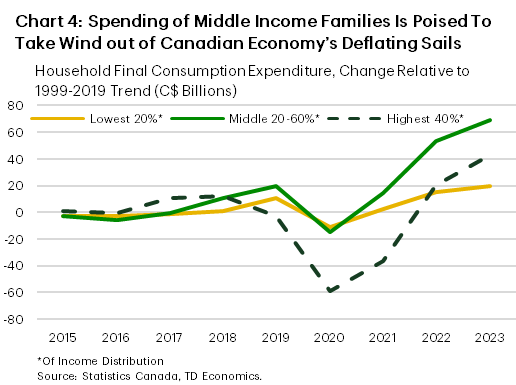
Middle-income households also became more indebted than before the pandemic. Relative to 2019, they had the largest increase in their debt-to-income ratio (Chart 3). As households continue renewing their mortgages, the higher cost of debt servicing could cause some families to fall behind on their debt payments or seek relief measures from financial institutions. The importance of these families in the economy cannot be overestimated. The share of this cohort in final consumption expenditures has increased from an average of 33% in 1999-2019 to 35.5% in 2023, when its spending growth stood at $69 billion (or 12.6%) above its own two-decade trend (Chart 4). As a result, this cohort of households were the biggest marginal contributor to above-trend spending recently. With lagging growth in real incomes and high debt burdens, these families are more likely to remain liquidity-constrained in the coming years and will be forced to make more economical choices. As a result, their contribution to spending is likely to fall back to historical averages. This will create a drag on spending.
What will keep the economy churning for now is spending by consumers at the upper end of the income distribution. They account for more than half of aggregate spending and may still have vestiges of pent-up demand in discretionary areas, as well as means to acquire these items.
Bottom line
The latest national accounts reveal that income and wealth disparities in Canada have widened in 2023, with the wealthiest benefiting the most from net property income gains. Meanwhile, relative to 2019, middle-income families have become more indebted as their earnings have not kept pace with inflation. Key drivers of the pandemic economy, these families now face financial constraints that necessitate more conservative spending habits. As they revert to historical spending averages, their reduced participation in the economy is likely to slow aggregate consumer spending. On the other hand, the top 40% of the highest income earners who account for more than half of aggregate spending and possess greater liquid resources, will become a critical swing factor in determining the degree of economic resilience.
End Notes
- The Distributions of Household Economic Accounts may change once the new (2023) Survey of Financial Security (SFS) is incorporated. https://www23.statcan.gc.ca/imdb/p2SV.pl?Function=getSurvey&SDDS=2620
- Pichette, L. “Are Wealth Effects Important for Canada?” https://www.bankofcanada.ca/wp-content/uploads/2010/06/pichettee.pdf.
Disclaimer
This report is provided by TD Economics. It is for informational and educational purposes only as of the date of writing, and may not be appropriate for other purposes. The views and opinions expressed may change at any time based on market or other conditions and may not come to pass. This material is not intended to be relied upon as investment advice or recommendations, does not constitute a solicitation to buy or sell securities and should not be considered specific legal, investment or tax advice. The report does not provide material information about the business and affairs of TD Bank Group and the members of TD Economics are not spokespersons for TD Bank Group with respect to its business and affairs. The information contained in this report has been drawn from sources believed to be reliable, but is not guaranteed to be accurate or complete. This report contains economic analysis and views, including about future economic and financial markets performance. These are based on certain assumptions and other factors, and are subject to inherent risks and uncertainties. The actual outcome may be materially different. The Toronto-Dominion Bank and its affiliates and related entities that comprise the TD Bank Group are not liable for any errors or omissions in the information, analysis or views contained in this report, or for any loss or damage suffered.
Download
Share: