Market Insights:
I Feel the Need, the Need for Speed
Beata Caranci, SVP & Chief Economist | 416-982-8067
James Orlando, CFA, Director & Senior Economist | 416-413-3180
Date Published: July 28, 2022
- Category:
- Canada
- Financial Markets
Highlights
- Investors are buckling up for a bumpy ride, evidenced by a deep inversion in the Treasury yield curve and ongoing USD strength.
- The current economic shock is disproportionately impacting the U.S.’s global peers, but the Canadian dollar has stood its ground.
- Narrowing the field to only “commodity currencies” still reveals outperformance by the CAD this year. Risk-off sentiment is weighing down the loonie, leaving scope for about 5% to the upside depending on how the next few months play out.
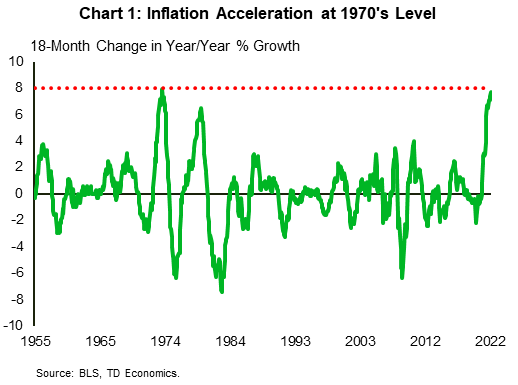
The engine may have sputtered before takeoff, but the Federal Reserve is unambiguously feeling the need for speed. The shock of four-decade high in inflation (9.1% year-on-year) is exceeded only by its swiftest 18-month acceleration since 1974 (Chart 1). The Federal Reserve is now matching speed for speed, with a policy rate that is likely to crest above 3% in less than a year. This speed of tightening hasn’t happened since former Fed Chair Paul Volcker aimed to break the back of inflation in the late 1970s. Although that economic cycle ended with a crash landing, it was successful in pulling down inflation. Today’s volatile and plummeting global equities have all the markings of risk-off investor jitters. And a deeply inverted Treasury yield curve (10Y-2Y) is a manifestation of recession fears. With few places to hide, the U.S. dollar has offered refuge.
Greenback: In good times and in bad
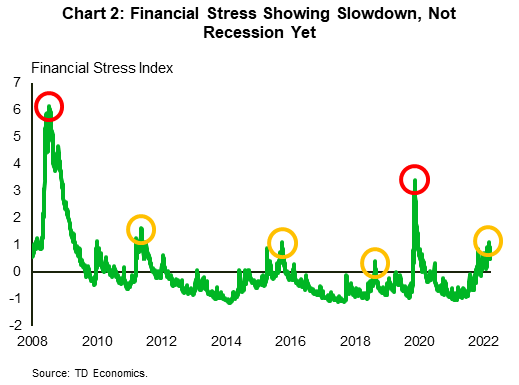
Over the last year, the broad trade-weighted U.S. dollar has appreciated by an impressive 12%. The initial rise reflected U.S. economic outperformance relative to peer countries. However, this dynamic shifted over the last six months, from capitalizing on a position of strength to capitalizing on a position of weakness. Over that time, financial conditions tightened to a level on par with the 2011 European Sovereign Debt Crisis and the 2015 Oil Shock (Chart 2). Investors have sold risky assets and sought shelter in the safety of the greenback. Already, the USD’s advance is close to the 14.6% average appreciation over the last three U.S. recessions, even though the degree of financial stress is still at lower levels.
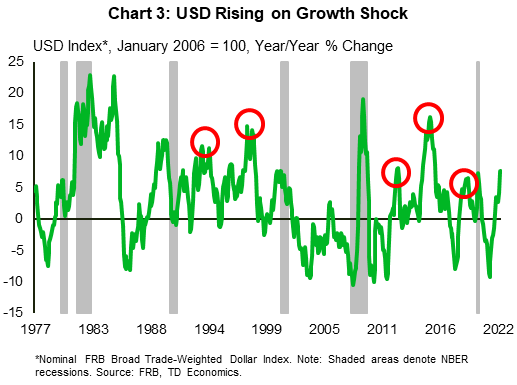
So what is the greenback telling us? Its track record in signaling economic recession is spotty. Sure, it has appreciated before four the last five recessions. The pandemic experience is excluded from the analysis since that recession was deliberately manufactured to mitigate a health crisis. However, the USD has also sent many false signals. There have been five cases since 1990 where the USD has advanced by a similar amount in the absence of a recession (Chart 3). These false positives occurred alongside desynchronized global growth trends, where U.S. economic outperformance was the primary driver of USD appreciation. Recent instances include the 2018 U.S./China Trade War, the 2015 Oil Price Shock, and the 2011 European Debt Crisis. None of these shocks led to a U.S. recession. Like today, the greenback is capturing an economic and financial decoupling.
Take Europe, where the euro has plummeted approximately 17% from its 2021 peak against the greenback to near parity. Most of that has occurred since Russia invaded Ukraine. Europe’s energy dependence on Russia has left it shouldering more economic and financial risks relative to Americans. The rise in European natural gas prices over the last year is approximately four times that of the U.S. equivalent. Furthermore, the United States has been a net-energy exporter since 2019. The cash inflow from the rise in energy prices is boosting corporate earnings and acting as an economic hedge to rising prices.
In the UK, the story is similar. Gas prices and another bout of political instability have put the British pound on its back foot, depreciating by 13% y/y. However, the Japanese yen is the worst performing major currency with a 20% fall from grace in the past year. Commodity import dependence has been an ongoing concern for Japan, but the negative yen sentiment also captures a central bank that is determined to stay on the sidelines while the Federal Reserve moves rates higher with conviction.
Shining a new light on the loonie
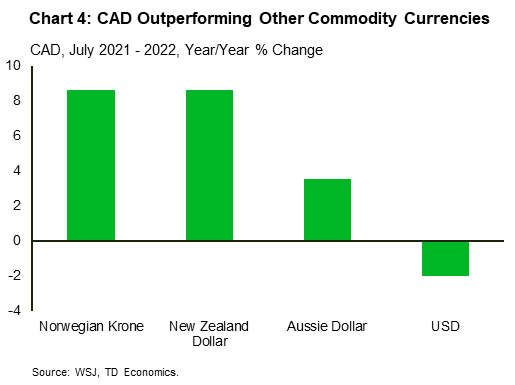
With WTI oil oscillating around $100 a barrel for several months and with the Canadian dollar’s reputation as a commodity currency, many clients have questioned why CAD consistently trades within a 76-79 U.S. cent range. Historically, such a commodity shock would have sent the currency cross towards parity. Not anymore. The U.S.’s emergence as an energy powerhouse combined with limitations on Canadian energy investment has muted the link between the currency and oil prices. However, the link is not completely gone. Against other currencies, the CAD has been a standout – up over 4% in the last year and 17% over the last six years. Narrowing the field to compare valuations against other “commodity currencies”, the CAD has outperformed this year (Chart 4). Of course, an aggressive interest rate cycle on pace with the U.S. is also maintaining a valuation preference to peer countries.
We don’t think the CAD is done yet. The loonie is being dragged down by risk-off sentiment that favors the USD. This leaves about 5% to the upside for CAD, although the next few months will be key in determining how much of that gap can be closed. In Canada, rising rates have already sharply impacted the residential real estate sector, evidenced by an ongoing slide in sales and prices. The risk this imparts to the consumer profile is enhanced by higher household indebtedness relative to its American counterparts. However, Canada also holds several advantages, such as a more robust job market, a mortgage qualification rule that required an interest rate stress test and a consumer with higher savings. The economy has sustained outperformance to the U.S. in the first half of this year, and the jury is out if it will continue to do so. This outcome would be supportive of the CAD closing the gap towards an 80 U.S. cent target.
Yield curve signal flashing yellow
Flight to safety trades always occur when recession risks are elevated, so a strong USD makes sense. But of all the indicators to watch, we place emphasis on the slope of the U.S. Treasury yield curve. The Federal Reserve has been communicating a high tolerance for “growth sacrifice” to re-anchor inflation expectations towards its 2% target. As a result, money markets are priced for the policy rate to get to 3.5% by year-end. That’s a full percent above the Federal Reserve’s median estimate of the neutral rate. This aggressive pricing has caused the spread between 10-year and 2-year yields to invert decisively into negative territory. In other words, investors think the Fed will go too far with the policy rate and have to eventually reverse course. An inverted yield curve is an effective recession warning signal, preceding every recession since 1980. It’s also less prone to false signals, unlike currency swings. From our point of view, the warning bell has been rung.
Historically, once the yield curve inverts, the lead time before recession ranges from one to two years. At the risk of using the words, “this time could be different”, if a recession does unfold, this cycle might produce a compressed timeline relative to history due to the speed of rate hikes and the impact of high inflation on household confidence and purchasing power. In such an event, we would expect further near-term upside for the USD as investors continue to sell risky assets. And don’t forget, currencies should be judged on relative value. If the U.S. tips into recession, we believe it would still fare better than its European counterparts where the challenges continue to mount.
Disclaimer
This report is provided by TD Economics. It is for informational and educational purposes only as of the date of writing, and may not be appropriate for other purposes. The views and opinions expressed may change at any time based on market or other conditions and may not come to pass. This material is not intended to be relied upon as investment advice or recommendations, does not constitute a solicitation to buy or sell securities and should not be considered specific legal, investment or tax advice. The report does not provide material information about the business and affairs of TD Bank Group and the members of TD Economics are not spokespersons for TD Bank Group with respect to its business and affairs. The information contained in this report has been drawn from sources believed to be reliable, but is not guaranteed to be accurate or complete. This report contains economic analysis and views, including about future economic and financial markets performance. These are based on certain assumptions and other factors, and are subject to inherent risks and uncertainties. The actual outcome may be materially different. The Toronto-Dominion Bank and its affiliates and related entities that comprise the TD Bank Group are not liable for any errors or omissions in the information, analysis or views contained in this report, or for any loss or damage suffered.