U.S. Leads in Intellectual Property Products Investment, While Canada Lags
Leslie Preston, Senior Economist | 416-983-7053
Date Published: October 17, 2019
- Category:
- Canada
- Business Investment
Highlights
- The U.S. has long been a leader in investment in intellectual property products (IPP), which continues to show resilience even as the rest of business investment hits a pothole in 2019.
- Drilling down into the industry mix reveals that a few key sectors punch above their weight on IPP investment, including manufacturers of computer and electronic products, chemicals and the information sector.
- The U.S. tech sector seems to play key role in its IPP global leadership position. Although related categories account for only 5% of value added in the private sector, they account for 25% of all IPP spending in recent years.
- Canada has persistently lagged the U.S. in IPP investment, but the situation has been worsening. The U.S.’s dominance in the tech sector does not tell the whole story. Canada lags in most sectors, placing future productivity and a higher standard of living at risk.

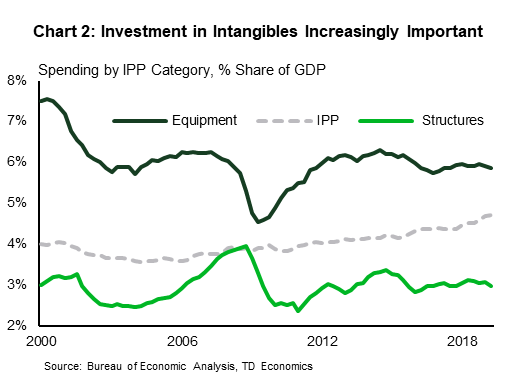
Business investment in the U.S. has been completely uninspiring despite significant corporate tax cuts taking effect in 2018. Any goodwill on that front has faced a strong headwind from slower global growth and greater uncertainty within the business climate. However, there is one area that has defied the odds. The U.S. has long been a leader among its G7 peers when it comes to investment in intellectual property products (IPP), while Canada stands out as a laggard (Chart 1). Since the U.S. corporate tax cuts came into effect, U.S. IPP investment has seen the most growth in real terms. However, tax initiatives may have acted more as a support to an existing trend, rather than as the catalyst for stronger growth. Spending on IPP has been growing as a share of the economy long before tax reform came into effect (Chart 2).
As economic activity increasingly shifts towards services and an expanding digital economy, investment in these knowledge-based intangibles have become increasingly important to the outlook. In fact, roughly five years ago, the World Economic Forum added “innovation capability” as a new measure that goes into determining a country’s competitiveness ranking. The U.S. ranking has risen from sixth place in 2013 to second in the latest ranking. Canada’s ranking has improved a bit, but a 16th placement pales in comparison to its major competitors. To a foreign investor, this paints a picture of a country’s innovation attractiveness and competitive edge. The U.S. continues to press hard in this area, evidence by the recent Japan-U.S. trade agreement and an ongoing hot-button issue within China negotiations. Canada risks falling further behind in IPP leadership with the passage of time, offering a sense of urgency.
What are intellectual property products?
Like its peers, the U.S. Bureau of Economic Analysis (BEA) defines investment as fixed assets used to produce goods and services for at least a year. This could include buildings, software or even a TV show. Intellectual property products are basically intangible assets and include software, research and development (R&D), mineral exploration and entertainment literary and artistic originals.
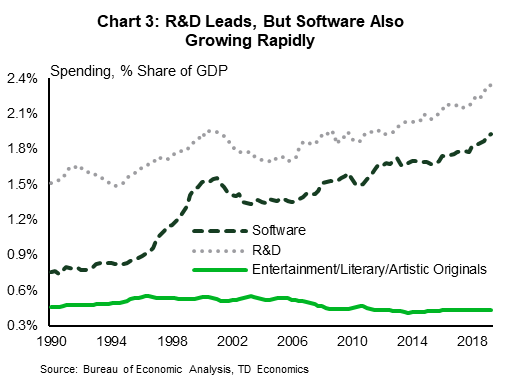
Spending on R&D has long been the biggest area of IPP in the U.S., although software has been gaining ground (Chart 3). Since the full-expensing portion of the Tax Cuts and Jobs Act (TCJA) took effect in the fourth quarter of 2017, spending on software has grown 19% in real terms, four times the pace of growth in the overall economy, while spending on R&D has grown 12.4% in real terms. Both categories have seen spending accelerate.
As described in more detail in the text box on page 6, aspects of the TCJA did make investing in R&D a bit more attractive for many companies. But, it is difficult to fully attribute the acceleration in R&D spending pre-and post-tax cut. Spending on software and entertainment literary and artistic originals has also accelerated. Software would have benefited from the temporary 100% expensing provision of the tax changes. However, so did a few other types of equipment where spending growth has decelerated since the tax cuts. It is likely that the acceleration in software spending is at least in part related to the increased adoption of cloud computing solutions in recent years.
As a rough way to see how growth and investment fared in the wake of the tax cuts, we compare forecasts for growth and investment immediately prior to them being finalized (September 2017 forecasts), to how they fared over the next several quarters. Growth did indeed outperform expectations in 2018 and 2019, and business investment also did better than expected. Of the three main components of business investment, IPP has seen the greatest outperformance versus forecasts back in September 2017. Whereas equipment spending did slightly worse in 2018, even though one would have expected to see a boost from the tax cuts. On the whole, it is difficult to tell how much of IPP’s outperformance over the past couple of years is due to the tax cut, and how much is due to the economy’s increasing shift towards intangible activities. But, at the very least we can say that the tax cuts would have reinforced an emerging trend, by offering a tailwind.
Specific Sectors Lead on Intangibles
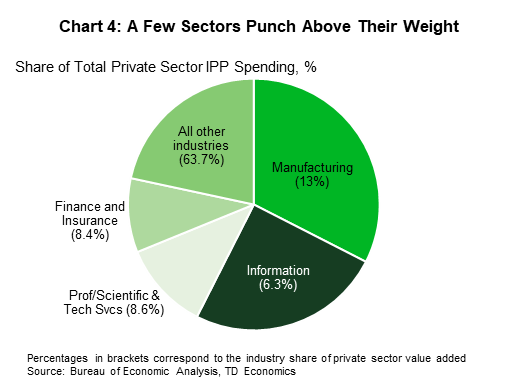
Within the U.S., we can dig deeper into identifying the sectors that dominate intangible investment. Not surprisingly, two stand out. The manufacturing and information sectors account for one-third and one-quarter of private sector spending on IPP, respectively (Chart 4). This is far greater than their weight in economic output (shown in brackets in the chart). All sectors broken out in the chart punch above their weight in terms of spending on IPP. But, it’s worth noting that all U.S. sectors have seen decent growth in spending on intangibles in recent years. Data is only available on an annual basis and ends in 2017, so it is difficult to say much about trends since the TCJA.

The manufacturing sector is obviously quite broad. Drilling down shows that only a few industries within it account for most of the spending on intangibles. Of those, 61% was undertaken by manufacturers of computer and electronic products (32%) and chemicals (29%), which includes the pharmaceutical sector. Other big spenders include miscellaneous durables manufacturing (which is a broad catch-all that includes items like medical equipment and supplies, to toys, jewelry and sporting goods) (Chart 5).
As one would expect, the information sector is the other heavy-hitter on IPP investment, even though its economic weight is less than half the size of manufacturing. This sector is also quite broad and includes four main industries:
- publishing (including software)
- motion picture and sound recording
- broadcasting and telecommunications
- data processing, internet publishing, hosting and related services industries

This fourth category has been the most rapidly growing industry within the information sector and, not surprisingly, has made the largest contribution to growth in IPP spending over the past five years (Chart 6). But, as is generally the case across the U.S., all industries saw healthy growth in IPP spending in 2018 despite dominance within a particular area.
When you zoom out and look at which industries are leaders in spending on IPP, industries that could be classified as belonging to the “tech sector” stand out as a recurring theme . There is no strict definition of the “tech” sector when it comes to economic data, but we grouped together industries from both goods and services sectors that could broadly be characterized as the tech sector. This group includes: the computers and electronics manufacturing, data processing, internet publishing, hosting and related services and publishing (which strictly speaking is more than just software, so it is an approximation). Together, these “tech” industries account for roughly 25% of nominal private sector IPP spending. However, they only account for 5% of private sector value added output. Looking at it in growth terms, these “tech” sectors have contributed about 30% of the growth in IPP (in nominal terms) over the last three years. The U.S.’s leading tech sector is contributing to the outperformance in intangible investment.
How Does Canada Stack up?
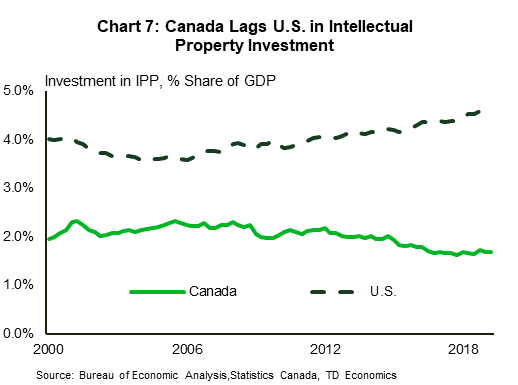
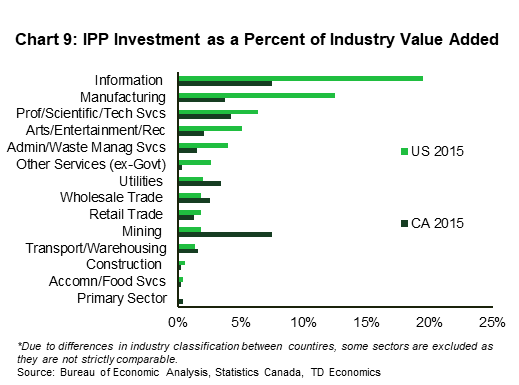
Unfortunately, Canada does not stack up well. The U.S. invests significantly more as a share of their economy in all categories (Chart 7). In addition, Canada has not made the same strides as the U.S. over the past couple of years (Chart 8). Given the U.S.’s sizeable tech sector and the importance of its IPP spending to the overall performance, one might think that accounts for a big chunk of the difference. However, the U.S. leads Canada in IPP investment as a share of GDP in nearly all industries (Chart 9).
Due to different structures of their economies, the IPP categories broken out by Canadian and American statistical agencies are not strictly comparable. The U.S. and Canada’s “other” category is quite different. The relative importance of the resource sector in Canada means investment in mineral exploration and evaluation has its own category, while the U.S. instead has entertainment, literary and artistic originals. In addition, accounting for intangibles has always been challenging, and with the rapidly changing technologies it is difficult for statistical agencies to keep up and standardize the methodology across countries. For example, the U.S. BEA has opted to capitalize spending on cloud computing software, whereas Statistics Canada has not. This may account for part of the discrepancy in the performance between the two countries within the software category, but it is not the whole story. The gap has persisted well before cloud computing became prevalent.
The U.S. blows Canada out of the water in the information and manufacturing sectors. There is more detail by industry in manufacturing, and again, we see that the U.S. invests more on IPP across manufacturing industries, with computers and electronics and chemical products leading the way (Chart 10). Previous research has shown that weak R&D spending by Canadian businesses is related to the decline in manufacturing’s share of the economy since 2001. Whereas even though manufacturing has declined as a share of the U.S. economy, it does have a greater specialization in higher technology and R&D intensive industries than is the case for Canada (Fraser Institute, 2019). Data limitations on the Canadian side mean that we can’t drill down further into the information sector.

Some have raised the issue that IPP spending may be under counted in Canada. While it is very difficult to tell whether individual companies answer surveys accurately, Statistics Canada does survey at the establishment level, not at head offices, so Canadian subsidiaries spending on items like software should still be counted. Additionally, Statistics Canada’s trade in services surveys requests information related to the provision of these types of services within multinational enterprises, which should also help to avoid the issue of all spending getting booked at a U.S. parent. This data is not publicly available, so we cannot get a sense of the size of the flows. However, in the case of R&D, it is possible that in a cross-border enterprise, the Canadian subsidiaries benefits from R&D that is done south of the border.

Canada’s underperformance on IPP investment is bad news for its lagging innovation performance at the international level. Spending on software and R&D are key ingredients to Canada’s innovation capability, and innovation plays a role in promoting productivity growth, and therefore Canada’s standard of living. Work done by the Advisory Council on Economic Growth to support Federal government policies on innovation1 have pointed out that “innovation is crucial to addressing the core challenge of maintaining living standards and growing our economic output as the population ages and labour-force growth slows.” The Council identified a few “bottlenecks” to a better innovation performance in Canada: gap between invention and commercialization, struggle to scale up successful start-ups and SMEs and no burning platform for corporate adoption of innovation. The lack of scaling up has meant that where Canada has 18 global industry leaders in 1990, in 2015 it had just five.
These findings are echoed by work elsewhere, which states that Canada’s innovation gaps point to things like poor private sector expenditures on R&D, and a lack of success of start-up firms in converting technological opportunities into successful outputs (in part measured by Canada’s underperformance at patent activity). There is evidence that Canadian start-up firms face barriers accessing venture capital financing at the “growth phase” of new businesses (sometimes called “patient capital”) rather than at the start-up phase2. Research by the Institute for Research on Public Policy (IRPP)3 also cites that Canada lacks pools of long-term patient capital willing to invest in supporting the growth of digital firms. Canada’s innovation challenges appear to be well identified, and governments have been working on strategies to support innovation, but it is unclear, as yet, if these will bear fruit. And, one thing has become clear in the fast paced digital economy: it’s never in the interest of being in ‘catch-up’ mode.
The Bottom Line
It is well established that investment is key to productivity growth, which in turn is becoming increasingly important as an aging population causes a parallel slowdown in the labor force. In other words, the rotation to investment and productivity becomes a larger driver of sustaining economic growth (see our Perspective on the issue). Moreover, as the economy becomes increasingly knowledge-based and investment is increasingly intangible, i.e. “clicks over bricks”. The U.S. has long been a leader on IPP spending relative to its G7 peers, helped in part by the knowledge-based sectors outlined above. For its part, Canada has long lagged the U.S. in intellectual property product investment, and the situation has been worsening. While the U.S.’s leading tech sector maybe part of the story, it is not the whole book. Canada lags the U.S. in most sectors and across all types of IPP investment. As economic growth becomes increasingly driven by knowledge-based sectors, Canada’s lagging performance in this area is concerning for our long-term economic growth and competitiveness.
Box 1: Treatment of R&D Spending by The Tax Cuts and Jobs Act
- Research and Development spending has had a tax credit in the US since 1981. It is officially called the Research Experimentation Credit.
- The modification of the corporate tax rate increased the value of the R&E tax credit that corporate and noncorporate taxpayers may claim when electing to claim a reduced credit. Consider the example in the table below where the taxpayer’s net R&D credit is increased because the amount of credit it “adds back” is less.
- In addition, due other amendments, including the elimination of the Alternative Minimum Tax (it also amended Sec. 38(c)(6) to treat a corporation as having zero tentative minimum tax), this removed a hurdle to claiming the credit.
- Noncorporate taxpayers also have additional ability to use the credit due to changes around the AMT.
| Corporate Tax Rates | 35% rate | 21% rate |
| R&D credit | $ 100,000 | $ 100,000 |
| Addback (or reduction under section 280C(c)(3) | -$ 35,000 | -$ 21,000 |
| Net credit | $ 65,000 | $ 79,000 |
| Source: KPMG. What's News in Tax, March 12, 2018. "Tax Reform: and the Winner Is…. R&D". | ||
End Notes
- "Unlocking Innovation to Drive Scale and Growth” Advisory Council on Economic Growth. February 6, 2017 https://www.budget.gc.ca/aceg-ccce/pdf/innovation-2-eng.pdf
- Fraser Institute (January 2019) " Innovation in Canada: An Assessment of Recent Experience"_ https://www.fraserinstitute.org/studies/innovation-in-canada-an-assessment-of-recent-experience
- IRPP Insight (February 2019) "A Digital Strategy for Canada: The Current Challenge" https://irpp.org/wp-content/uploads/2019/01/A-Digital-Strategy-for-Canada.pdf
Disclaimer
This report is provided by TD Economics. It is for informational and educational purposes only as of the date of writing, and may not be appropriate for other purposes. The views and opinions expressed may change at any time based on market or other conditions and may not come to pass. This material is not intended to be relied upon as investment advice or recommendations, does not constitute a solicitation to buy or sell securities and should not be considered specific legal, investment or tax advice. The report does not provide material information about the business and affairs of TD Bank Group and the members of TD Economics are not spokespersons for TD Bank Group with respect to its business and affairs. The information contained in this report has been drawn from sources believed to be reliable, but is not guaranteed to be accurate or complete. This report contains economic analysis and views, including about future economic and financial markets performance. These are based on certain assumptions and other factors, and are subject to inherent risks and uncertainties. The actual outcome may be materially different. The Toronto-Dominion Bank and its affiliates and related entities that comprise the TD Bank Group are not liable for any errors or omissions in the information, analysis or views contained in this report, or for any loss or damage suffered.
Download
Share: