Inflation’s Toll on Canadian Families:
The Fire is Hottest in the Middle
James Marple, Associate Vice President | 416-982-2557
Rannella Billy-Ochieng’, Senior Economist
Date Published: August 18, 2022
- Category:
- Canada
- Financial Markets
- Consumer
Highlights
- Inflation finally receded in July as gasoline prices eased, but an elevated reading of 7.6% leaves Canadian households still feeling the burn of higher prices.
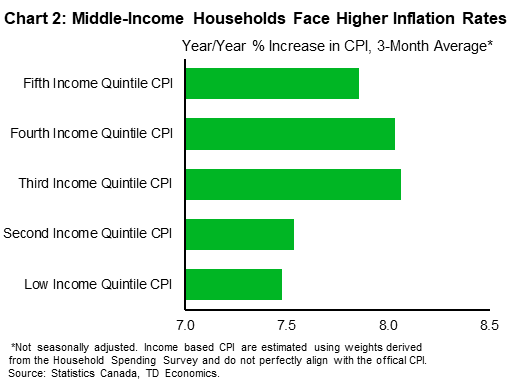
- Middle-income households’ spending on transportation and food puts them closest to the line of fire. Their inflation rate averaged 8.1% year-on-year (y/y) over the three months ending in July 2022, higher than the corresponding headline rate of 7.8% y/y over those months.
- Rising costs will push families to alter spending, but this is easier for households with a larger share of discretionary spending.
The longer inflation remains elevated, the more it threatens to obstruct the welfare of all Canadians.
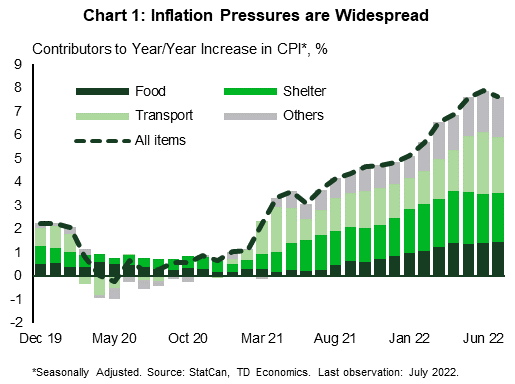
Canadian households are feeling the heat as inflation scorches through the economy. The Consumer Price Index (CPI) was up 7.6% year-on-year (y/y) in July, head and shoulders above the Bank of Canada’s 2% target. July’s inflation report reflected a modest slowing from the prior month (8.1%) due to a pull-back in gasoline prices, but it was also the seventh consecutive month with a reading above 5%.
With broad based price pressures, the vast majority of Canadians are facing elevated inflation (Chart 1). However, digging into the consumption baskets of households across the income spectrum, middle-income families have it the worst.
Transportation and food prices are leading actors behind elevated inflation. Together they account for roughly half of the growth in prices over the last year, punching well above their weight in the consumer basket. A higher share of spending on food and transportation relative to other income groups explains much of the faster inflation rate faced by middle-income households.
Estimates of inflation by income group likely understate the price pressures felt at the low end of the income spectrum, as they do not adjust for changes in consumption in response to higher prices. With a higher share of spending on necessities relative to high income counterparts, households at the low end of the income are more vulnerable to elevated inflation.
Transportation Inflation Has Hit the Middle Hardest
Inflation is taking a toll on all Canadians, but different consumption patterns leave some more exposed than others. Middle-income households faced the highest rate of inflation, which averaged 8.1% (y/y) over the three months ending July 2022 (Chart 2). According to the Survey of Household Spending (taken in 2019), these families typically spend almost a fifth of their budget on transportation (19.4%) – the highest among income groups.
While we do not have more recent spending data by income group that would allow us to say for certain how consumption changed during the pandemic, these exposures have likely increased. With health concerns amplified, people took to their cars and eschewed public transit. At the same time, disrupted supply chain crippled the auto sector’s ability to produce vehicles, sending vehicle prices skyward.
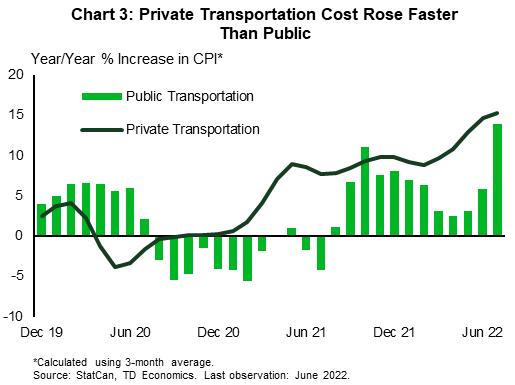
Even more pressing, gas prices have soared over the past year. After July’s retreat, they are up 35.6%. Higher costs for fuel and autos accounted for more than 30% of the increase in year-over-year inflation in July. These price pressures have made private transportation comparatively more expensive than public transit (Chart 3), concentrating the pain on middle-income households.
Higher Food Prices Hit Low Income Households Hardest
Higher transport costs also show up on dinner tables, which in combination with droughts and the war in Ukraine have led to a surge in food prices. Food inflation has shown little signs of slowing, accelerating to 9.2% (y/y) in July. Families in the bottom two income quintile typically spend more on food than other groups. As a result of rising prices, one in five Canadians expect to obtain food/meals from a community organization.1 Middle income households’ food expenditure share is almost as much as lower income households, also leaving them vulnerable.
Shelter Inflation Has Hit Homeowners but Pressures are Shifting to Renters
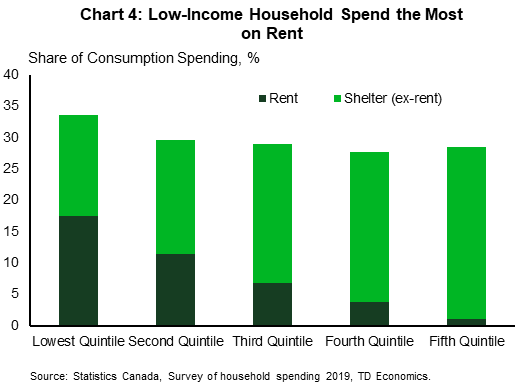
Canadians are paying more to keep a roof over their head. Shelter costs are the largest expense for most families in Canada. Low-income households typically spend disproportionately more on shelter than other income groups and noticeably more on renting (Chart 4).
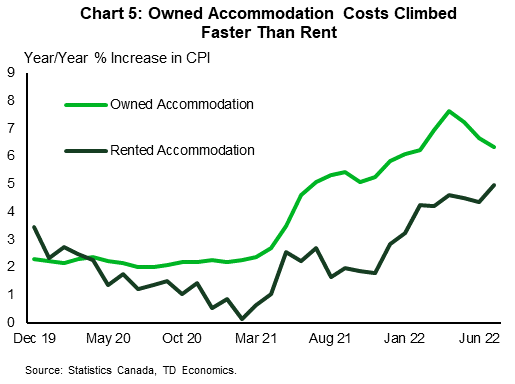
Shelter inflation over the past two years, however, has been faster for owned residences (Chart 5), which hits higher-income households harder. This may be changing however. Tighter monetary policy has led to a rapid cooling in housing markets across Canada. Although higher mortgage rates provide an offset, owned accommodation CPI eased to 6.3% in July (from 6.7% in June), while rental inflation accelerated to 4.9% (from 4.3% in June). The pickup in rent inflation relative to homeowner inflation will put more of the inflation burden on low-income households.
Higher Income Households Have a Greater Ability to Modify Consumption
The discussion above is based on a static analysis of household consumption based on a survey taken prior to the pandemic. Spending patterns shifted during the pandemic, especially in lockdown periods, with households increasing spending on shelter and household operations and decreasing spending on transportation, clothing and recreation. However, spending patterns over the past year appear to be shifting back to pre-pandemic norms.
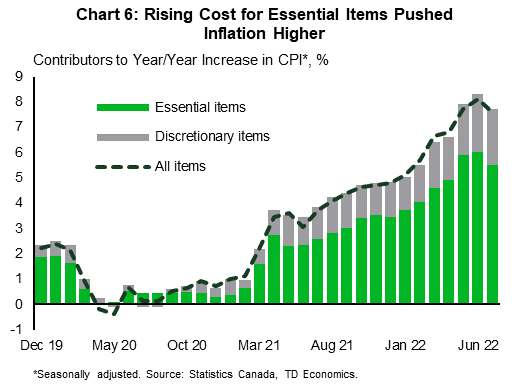
What is more, households can shift their spending away from items that are rising the fastest, though some shifts are more difficult than others.2 The larger the share of discretionary spending, the more control households have on the rate of inflation they face.
Unfortunately, more than 70% of the price growth over the past year has been in essential items that are harder to cut back on (Chart 6). As these critical items become more expensive, prioritizing them could mean that households with less means will have to trim spending elsewhere. This is corroborated by the Bank of Canada’s most recent Survey of Consumer Expectations, which showed that more than half of low-income respondents plan to cut spending over the next year in response to higher inflation.2
Bottom Line
Elevated inflation is hurting everyone, but, given their relatively higher share of spending on food and transportation, middle-income households are likely facing the highest inflation rates. Fortunately, there are signs that this is moving in the right direction. Energy prices have declined in recent months and global supply shortages appear to be easing. As these items retrace, the disproportionate impact on middle-income families should dissipate. The sooner that the inflationary temperature can be brought to normal the better Canadians of all walks of life will be.
Disclaimer
This report is provided by TD Economics. It is for informational and educational purposes only as of the date of writing, and may not be appropriate for other purposes. The views and opinions expressed may change at any time based on market or other conditions and may not come to pass. This material is not intended to be relied upon as investment advice or recommendations, does not constitute a solicitation to buy or sell securities and should not be considered specific legal, investment or tax advice. The report does not provide material information about the business and affairs of TD Bank Group and the members of TD Economics are not spokespersons for TD Bank Group with respect to its business and affairs. The information contained in this report has been drawn from sources believed to be reliable, but is not guaranteed to be accurate or complete. This report contains economic analysis and views, including about future economic and financial markets performance. These are based on certain assumptions and other factors, and are subject to inherent risks and uncertainties. The actual outcome may be materially different. The Toronto-Dominion Bank and its affiliates and related entities that comprise the TD Bank Group are not liable for any errors or omissions in the information, analysis or views contained in this report, or for any loss or damage suffered.
Download
Share this: