Taking Stock of Canada’s Housing Inventory
Rishi Sondhi, Economist | 416-983-8806
Date Published: February 9, 2023
- Category:
- Canada
- Real Estate
- Provincial & Local Analysis
Highlights
- During the current downturn in housing markets, Canadian new listings have dropped 19% on a peak-to-trough basis, with broad-based declines across provinces. This decline in supply has saved home prices from an even steeper drop.
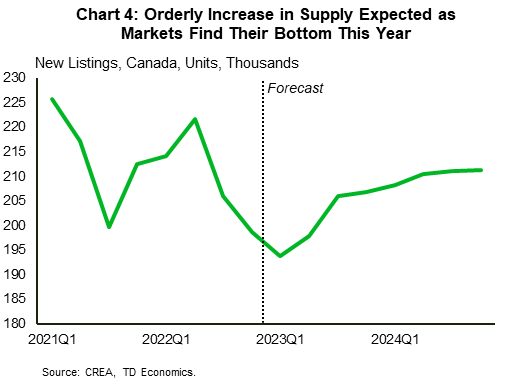
- After some near-term weakness, our forecast anticipates new listings climbing through much of 2023 and in 2024. However, rising demand should keep markets balanced and underpin positive growth in home prices, particularly in the second half.
- There is some risk that supply grows more forcefully than anticipated as homeowners face the headwinds of record high debt servicing costs and economic weakness.
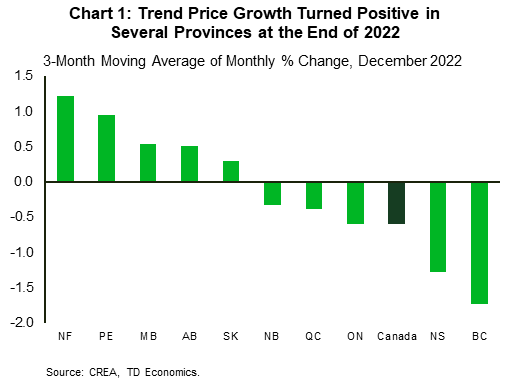
Across nearly all of Canada, the pace of decline in average home prices is easing. On a three-month moving average basis, price growth was positive in half of all provinces in December (Chart 1), including the Prairie provinces and parts of the Atlantic. This marks quite a turnaround from earlier this year.
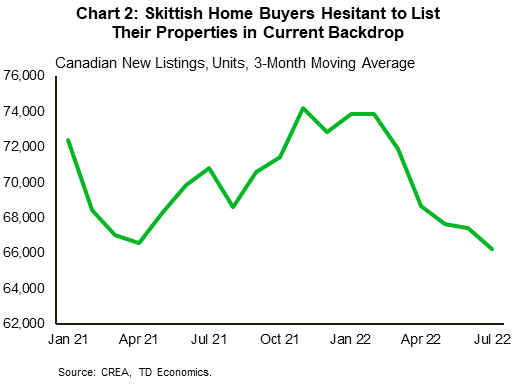
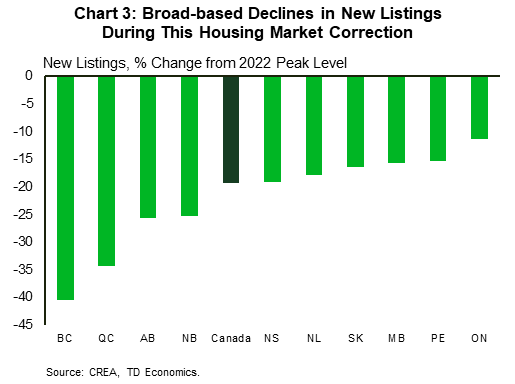
An improving trend in home sales is an integral part of this story. However, an equally important development is that resale supply has been restrained, with the still-weak demand backdrop keeping potential sellers on the sidelines. Since the Canadian housing market began its correction in February, Canadian new listings have fallen, alongside the downturns in both home sales and prices (Chart 2). In terms of magnitude, they were 11% below their 10-year average at the end of last year, weighed down by particularly steep declines in B.C. and Quebec (Chart 3).
Our forecast sees listings falling again in the first quarter amid subdued sales and falling prices. Thereafter, we expect resale supply to climb as the market finds its bottom. According to our latest forecast released in December, listings are expected to increase by 7% over the 2023Q2 to 2023Q4 period, before slowing to a more modest 2% growth pace in 2024 (Chart 4). It should be noted that since we finalized our last housing forecast, a plunge in listings was revealed in the month of December. As such, the data potentially sets up for an even steeper climb than our projection anticipates.
This risk aside, combining our current view on supply with our sales forecast yields a Canadian sales-to-new-listings ratio (a key measure of market balance) that steadily climbs but remains in “balanced” territory through this year and much of next. This supports our call for positive price growth to resume more forcefully in the second half of this year.
Our baseline view represents something of an “orderly” increase in resale supply. We assume that the economy essentially stalls over the next two years, while the national unemployment rate rises by around 1.5 percentage points, to 6.5%. This would represent about half of the increase in the unemployment rate suffered during an average historical recession in Canada, not to mention a peak level that would remain relatively low. Thus, homeowners should face less risk of job loss, limiting the potential for forced selling.
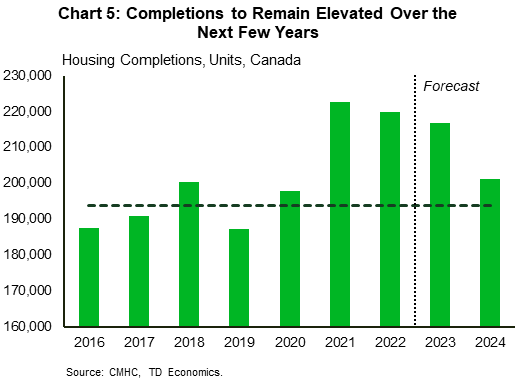
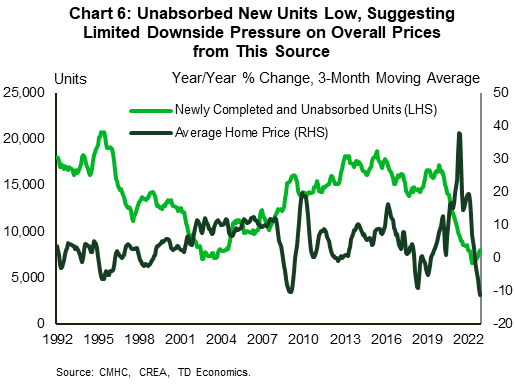
There are, of course, risks to this view. Housing starts have run at an extremely elevated pace since the onset of the pandemic, and many of the units started in past years should be completed in 2023. In fact, we expect completions to total around 215k units this year, down only slightly from 2022’s robust pace and well above the typical rate (Chart 5). Importantly, there are some indications that the market has been able soak up new units so far, even with completions running at multi-decade highs in both 2021 and 2022. This is evidenced by the currently low level of units that have been completed and unabsorbed (Chart 6). Note that even with it ticking up recently, this indicator remains well below its long-term average, suggesting some runway before concerns of oversupply truly mount.
Within the universe of homes slated for completion this year, there is a subset which appear to be facing some troubles. Evidence indicates that some buyers are struggling to close on the pre-construction units they purchased years ago, as higher rates and lower appraisal values for their units have made securing the financing required to close the deal more difficult to come by. These buyers may be forced to list their units on the assignment market, which is where a would-be owner sells their property before they take possession.
Assignment sales have been reported to account for around 10% of the overall pre-construction market1, so not normally a huge share. However, the broader point is that homeowners could buckle under the weight of record high debt servicing costs and economic weakness, pressuring new supply significantly higher (and prices lower) than what we’ve built into our baseline. On this front, we estimate that a 1% increase in listings is associated with a cumulative 0.3% decline in average home prices for the three quarters following the bump in supply.
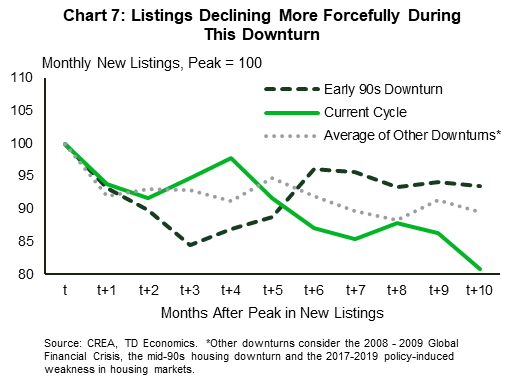
A counterpoint against a surge in forced selling is that historically, listings have nearly always tended to fall during housing downturns and even periods of broader economic weakness. This is even with the unemployment rate rising, as skittish homeowners (many of whom still have their jobs) are hesitant to list their homes amid an uncertain backdrop. The downtrend in listings recorded so far during the current downturn hues quite closely to that observed during 2017-2019 (when macroprudential policies weighed on the market) but is modestly less severe compared to the drop in listings during the 2008-09 Global Financial Crisis (Chart 7).
U.S. listings trends during the Global Financial Crisis followed a very different pattern, with supply on the market surging even before the economy officially tipped into recession and remaining elevated for several quarters. The upheaval in the U.S. banking system at the time (that was not mirrored in Canada) underlines the risk that forced selling dynamics can still take hold.
The early 90s housing and economic downturn in Canada offers perhaps the best comparator to the current cycle, as economic growth weakened significantly and affordability was just as strained as it is now, thanks to double-digit mortgage rates. Back then, listings didn’t decline as much they had in other downturns. Rather, they oscillated around a relatively flat trendline.
Abstracting from the cyclical weights on supply, an important structural factor placing downward pressure on listings is the fact that the Canadian population is aging, and an aging population tends to move less. Also, we should be cognizant of the fact that construction timelines are lengthening, extending the time it takes to deliver new supply to the market.
The discussion above focuses on the short term. Ensuring the Canada’s population is well-supplied with the right type of housing will be a challenge over a longer-term horizon, especially with what should be robust population growth. We’ll need to break-ground on about 220k units annually just to keep up with underlying housing demand. During the post-Global Financial Crisis period before the pandemic struck, completions were struggling to keep up with population growth. However, the population growth slowdown due to the pandemic has helped supply catch up.
Ultimately, the notion that the Canadian market will only retrace a portion of pandemic-era price gains, coupled with the challenge of building enough new units to house a robustly growing population, should keep affordability pressures bubbling and support elevated and growing prices over a longer-term horizon.
End Notes
- Dingman, Shane, “Condo assignment sales fuelling Canadian market speculation”, The Globe and Mail, April 6, 2022, https://www.theglobeandmail.com/real-estate/article-condo-assignment-sales-fuelling-canadian-market-speculation/
Disclaimer
This report is provided by TD Economics. It is for informational and educational purposes only as of the date of writing, and may not be appropriate for other purposes. The views and opinions expressed may change at any time based on market or other conditions and may not come to pass. This material is not intended to be relied upon as investment advice or recommendations, does not constitute a solicitation to buy or sell securities and should not be considered specific legal, investment or tax advice. The report does not provide material information about the business and affairs of TD Bank Group and the members of TD Economics are not spokespersons for TD Bank Group with respect to its business and affairs. The information contained in this report has been drawn from sources believed to be reliable, but is not guaranteed to be accurate or complete. This report contains economic analysis and views, including about future economic and financial markets performance. These are based on certain assumptions and other factors, and are subject to inherent risks and uncertainties. The actual outcome may be materially different. The Toronto-Dominion Bank and its affiliates and related entities that comprise the TD Bank Group are not liable for any errors or omissions in the information, analysis or views contained in this report, or for any loss or damage suffered.
Download
Share: