Highlights
- The Strait of Hormuz disruption is more than an energy shock. The closure has blocked roughly one-third of the global seaborne fertilizer trade with nitrogen and phosphate supply the most exposed.
- Gulf-dependent fertilizer importers are being hit first, but rising prices are impacting food producers all over the world.
- North America may avoid the worst of the supply shock, but it remains exposed to global price spillovers. Existing inventories and low-farm-to-retail passthrough should limit the headline CPI impact, but a persistent fertilizer shock could still add upside pressure to food inflation.
The effective closure of the Strait of Hormuz marks one of the largest disruptions in global energy market history. Its impact raised energy prices instantly, with the transmission to the gas pump already passed onto consumers. However, energy was not the only product disrupted by the closure. The more persistent inflation risk lies in its impact on fertilizer supply. The Gulf conflict is directly impairing the global fertilizer trade, particularly nitrogen and phosphate inputs, raising the risk of delayed food price pressures.
The inflation impact will be uneven. North America is better positioned to absorb the shock, given domestic production capacity, existing inventories and limited farm-to-retail pass-through. The greater risks are concentrated in fertilizer import dependent emerging markets, where food carries a significant weight in household budgets and weakening currencies tend to amplify the shock. Even if shipping normalizes quickly, higher fertilizer costs could still weigh on planting decisions and food supply into 2027.
From Energy Shock to Fertilizer Constraint
In a typical energy shock, higher prices feed into fertilizer markets indirectly through fuel, shipping, and input costs. That was largely the pattern in 2022, when food inflation reflected an energy to farm-inputs transmission rather than a disruption to fertilizer supply itself.
The current episode is different. With shipping through the Strait significantly disrupted, the conflict in the Gulf has both raised input costs and directly impaired fertilizer supply chains, making both availability and cost a binding constraint. This matters because fertilizer shortages during the spring 2026 planting season will impact crop yields over the next year and push food prices higher, well into 2027, extending inflationary risk well beyond the near-term.
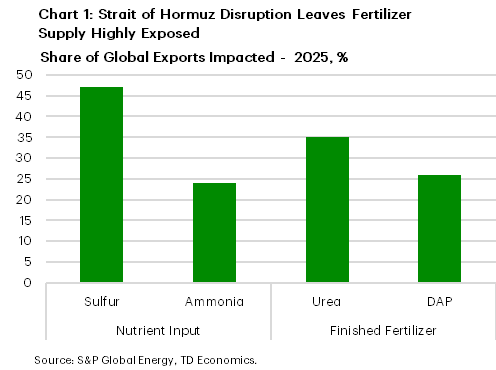
Roughly one third of global seaborne fertilizer trade transits the Strait of Hormuz, with exposure concentrated in nitrogen and phosphate products that are critical for staple crops such as corn, wheat, and rice (Chart 1).
The transmission mechanisms vary across fertilizer products. Urea serves as the most immediate channel, as it is a finished nitrogen fertilizer used directly by farmers and accounts for about two thirds of the Gulf fertilizer shipped by sea.1 Sulfur’s transmission is different. It is an upstream input into phosphate fertilizer, so a sulfur price shock can first raise fertilizer production costs and then feed into finished phosphate fertilizers such as diammonium phosphate (DAP). The risk is therefore two-fold: immediate pressure through urea and lagged pressure through sulfur to DAP.
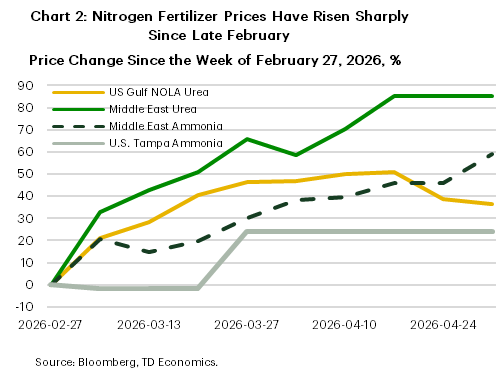
Market pricing reflects this reality. Since late February, urea prices in the Middle East have risen nearly 85% while North American prices are up roughly 40%, indicating spillovers into the broader nitrogen market (Chart 2). Stress is not limited to nitrogen. Around one fifth of traded DAP also transits the Strait, and World Bank benchmarks show phosphate prices beginning to rise as well. With prices increasing in both nitrogen and phosphate markets, farmers are already feeling the financial strain. Higher food prices are likely to follow.
Who Gets Hit First and How the Shock Spreads
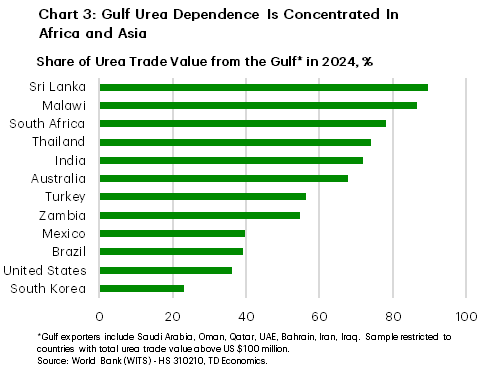
The first-round impact of the Hormuz crisis will fall on countries that rely directly on Gulf sourced fertilizer imports, particularly urea. Exposure is highest in Sri Lanka, Malawi, South Africa, Thailand and India (Chart 3). The risk is largest for countries with high fertilizer import dependence and limited foreign currency buffers. Sri Lanka is the clearest example. Higher fertilizer-import costs widen trade pressures, weaken currencies and makes replacement supply harder to afford when it is most needed.
A separate but reinforcing channel runs through phosphate. DAP imports are concentrated in a smaller group of countries, including Kenya, Tanzania, the United States, Pakistan and India, creating an additional layer of vulnerability, particularly for oilseed crops such as soybeans and canola that rely more heavily on phosphate inputs.
When fertilizer cargoes are delayed or repriced, buyers compete for replacement from non-Gulf producers like Russia, China or North America. This turns a regional disruption into a global price shock, raising prices even for countries with little direct exposure. Farmers can respond by reducing application rates or shifting acreage toward less nitrogen-intensive crops, but both choices carry a cost. Lower nitrogen use can weaken yields, while crop switching reduces output of fertilizer-intensive staples increasing food production risk.
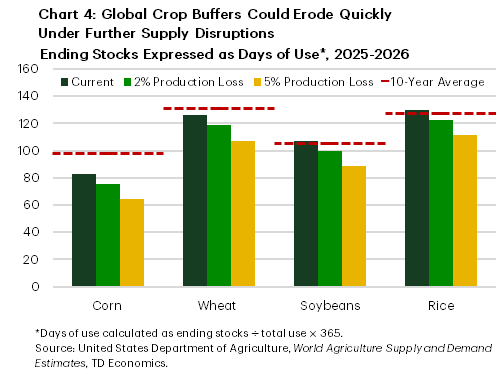
Our analysis shows how quickly the inventory cushion can narrow. We measure this cushion using “days of use,” which shows how long existing inventories could cover normal demand if no new supply were added. Across major crops, a 2-5% production shortfall would reduce the inventory buffers by roughly 10-20% (Chart 4). Corn inventory is the clearest pressure point, with global days of use at 83, already half a month below its 10-year average and further falling to roughly 75 to 64 days under adverse scenarios.
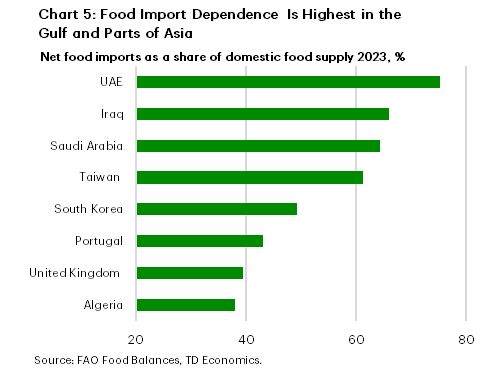
Thinner crop buffers matter most for countries that heavily rely on imported food. If fertilizer shortages cause production losses and global crop prices rise, these nations face additional risks because their limited domestic supply cannot easily cushion the impact. Gulf states face a compounded risk as they are heavily reliant on imported food through the same waterway disrupting fertilizer exports. The vulnerability extends beyond the Middle East, with Taiwan and South Korea also showing high food import dependence (Chart 5). A broad-based rise in food prices will extend well beyond the economies most directly exposed to the Gulf disruption.
The inflation burden is more significant in poor economies because food carries a much higher weight in household budgets. International Monetary Fund (IMF) estimates show food accounts for about 44% of household consumption in the poorest countries compared with 27% in emerging markets and 16% in advanced economies.2 As a result, a given increase in food prices has a much larger cost of living impact in the most vulnerable countries.
North America - Producer Advantages, But Not Immunity
North America appears less exposed to direct fertilizer disruptions. The United States and Mexico import roughly 30-40% of their urea from the Gulf, while Canada’s exposure is under 5%. Domestic nitrogen production and U.S. supply reduce the risk of a physical shortage, but not the risk of price spillovers. Phosphate exposure is more material for the United States at around 54%.3
Canada’s position is distinct. As the world’s largest potash exporter, it supplies a nutrient that supports drought resistance and overall plant health. Unlike nitrogen, which leaches from the soil and must be reapplied every season, potash accumulates in the soil, allowing farmers to draw on the prior season’s application if potassium levels are adequate. This provides some relief, and Saskatchewan benchmark potash prices have remained essentially flat since February 28.
Canada also entered 2026 with stronger crop inventories. As of March 2026, wheat stocks were up 12% year-over-year and canola stocks were up 27% year-over-year, while corn stocks were broadly stable. Still, the protection is incomplete. Soybeans are the main weak point, with stocks down nearly 46% year-over-year.4 Potash cannot substitute for nitrogen and phosphate, especially for crops like corn and canola that rely heavily on these inputs.
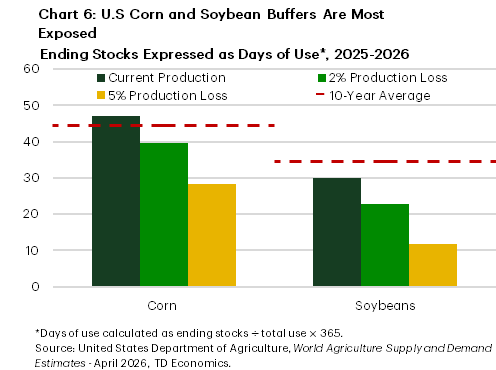
Current crop inventories also offer short-term stability, but the cushion is limited. U.S corn inventories cover roughly 47 days of use, modestly above their 10-year average while soybean inventories cover about 30 days, below their 10-year average (Chart 6). A modest, 2-5%, U.S. corn production shortfall would roughly reduce the inventory to about 40 to 30 days. For soybeans, the drawdown is sharper, reducing the inventory to about 23 to 12 days.
Fortunately, for North America, the pass-through to consumers is limited by the relatively small farm share of food costs. In the United States, farms account for just 12% of every dollar spent on food, with the remaining costs tied to processing, transportation, distribution and retail.5 Research by economists at the Kansas City Fed confirms that with a lag, row-crop price shocks (crops like corn, soybeans, wheat and canola, grown in rows and heavily dependent on fertilizer) exhibit modest pass through to CPI.6 In our estimates, a 2-5% production shortfall could add around 0.1-0.5 percentage points to food inflation in 2027. With food representing just under 14% of the CPI basket, the impact on headline inflation remains contained. The larger risk is concentrated in Asia and Africa, where food accounts for a much larger share of household spending and fertilizer import dependence is harder to absorb.
Bottom Line
A Strait of Hormuz disruption should not be viewed solely as an energy shock. Its bigger second-round risk is a fertilizer shock that raises farm input costs, pressures import-dependent economies and leaves food prices more vulnerable into 2027. Unlike energy prices, which can reverse once shipping normalizes, the fertilizer shock is already passing through the planting window. That damage cannot be fully reversed.
For North America, the direct inflation impact is modest. Existing inventories and domestic production advantages should contain the hit to consumer prices. The larger concern is in fertilizer import dependent economies, where higher input costs, weaker currency buffers, and larger food weights in household budgets exacerbate the pain.
End Notes
- https://unctad.org/publication/strait-hormuz-disruptions-implications-global-trade-and-development
- https://www.elibrary.imf.org/view/journals/001/2023/074/article-A001-en.xml
- Gulf exporters include Saudi Arabia and UAE for DAP in 2024. https://wits.worldbank.org/trade/country-byhs6product.aspx?lang=en#void, - HS 310530.
- https://www150.statcan.gc.ca/n1/daily-quotidien/260506/dq260506c-eng.htm
- https://www.ers.usda.gov/data-products/food-dollar/summary-findings
- https://www.kansascityfed.org/research/research-working-papers/the-passthrough-of-agricultural-commodity-prices-to-food-prices/
Disclaimer
This report is provided by TD Economics. It is for informational and educational purposes only as of the date of writing, and may not be appropriate for other purposes. The views and opinions expressed may change at any time based on market or other conditions and may not come to pass. This material is not intended to be relied upon as investment advice or recommendations, does not constitute a solicitation to buy or sell securities and should not be considered specific legal, investment or tax advice. The report does not provide material information about the business and affairs of TD Bank Group and the members of TD Economics are not spokespersons for TD Bank Group with respect to its business and affairs. The information contained in this report has been drawn from sources believed to be reliable, but is not guaranteed to be accurate or complete. This report contains economic analysis and views, including about future economic and financial markets performance. These are based on certain assumptions and other factors, and are subject to inherent risks and uncertainties. The actual outcome may be materially different. The Toronto-Dominion Bank and its affiliates and related entities that comprise the TD Bank Group are not liable for any errors or omissions in the information, analysis or views contained in this report, or for any loss or damage suffered.
Download
Share: