Highlights
- In recent months, food prices have become an increasingly important contributor to CPI inflation in Canada. Strong
demand has been colliding against notable constraints on the supply side. - Unsupportive weather has hit crop production and inventories globally. To make matters worse, Western Canada's crop
production was hard-hit by severe drought conditions this year. - Input costs are rising along the production chain. Most prominently, these include higher transportation and energy
costs. Rising wage costs due to tightening job markets could be the next shoe to drop. - Together, these factors indicate that retail food price inflation is likely to exhibit some persistence, with year/year food
price inflation potentially rising to the 5.5%-6.5% range in the near term.
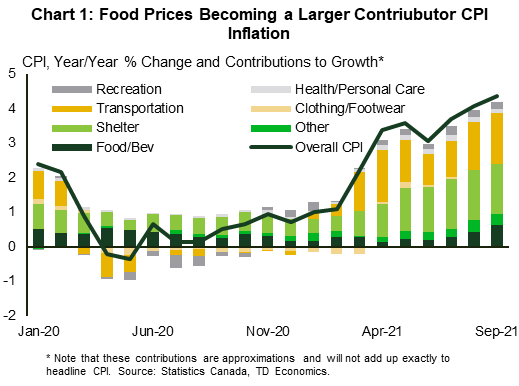
The rapid acceleration in Canada's CPI inflation rate since the spring was predominantly driven by the transportation, and shelter categories (Chart 1), as well as the broader energy category. Food inflation, in contrast, had been running below the 2% mark up until as recently as July. A few factors had been acting to keep overall food prices in check. These included Canada's position as a large producer and net exporter of raw and processed food, a decent crop season last year, and a rising Canadian dollar.
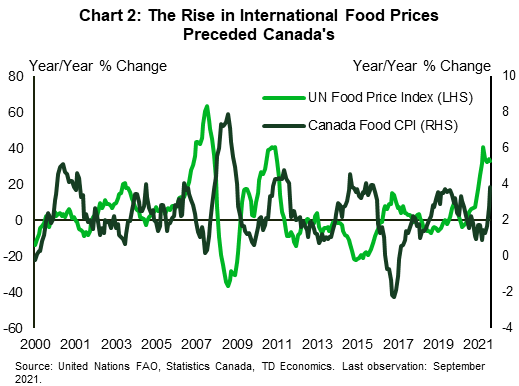
However, it appeared to be only a matter of time before food prices in Canada would play catch up, both to the average domestic inflation rate and to strongly rising international food prices (see Chart 2). And indeed, month/month food inflation popped 0.9% in September, the highest amongst the CPI basket categories. In annualized terms, the 3-month moving average stood at a sizeable 8.8%, compared to 6.1% for overall headline inflation (see Table 1 on Page 6). This points to significantly higher momentum in food prices.
Food price inflation typically garners special attention. It is especially important for many emerging markets, where food constitutes a larger share of the spending basket. In Canada, food accounts for 16.2% of the consumer basket – the second highest category weight following shelter. It also accounts for a slightly larger share of the consumption basket for the lower income groups.1 And with many components of the food basket being more essential than discretionary, a rise in prices in this category can add strain on lower income households.
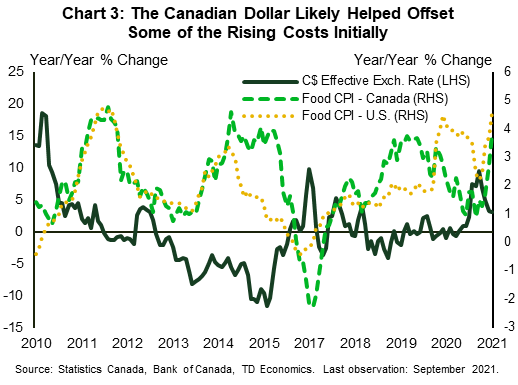
The overall backdrop suggests that these price pressures may have some lasting power at least into the early part of next year. Though subject to significant uncertainty, we suspect that food price inflation may rise from the current 3.9% y/y rate to the 5%-6% range in late 2021/early 2022, before moderating later next year. The risks are tilted to the upside. Part of this is a function of the lagged impacts of raw material, producer, and import prices on final consumer prices. In that vein, these leading indicators remain elevated. Weather conditions have been hitting crop inventories globally, instituting a floor below major crop prices. Other input prices, including energy, also remain high. Anecdotally, some producers (for instance, dairy) have explicitly announced plans to raise prices in the beginning of 2022.2 Finally, the Canadian dollar – where bouts of strength in recent months (Chart 3) have mitigated the impact of higher import and food commodity prices - is expected to modestly soften going forward, thus not providing the same dampening influence it had earlier.
Any signs of an improving supply backdrop would likely have a cooling effect on crop prices, but only gradually so with stocks-to-use ratios expected to take some time to revert back up. Still, given the unpredictability of weather conditions, the upside risks to prices are noteworthy. Another disappointing growing season in Canada and globally would likely have the effect of keeping prices elevated for longer or lifting them even further.
Price Increases Uneven Across the Food Basket
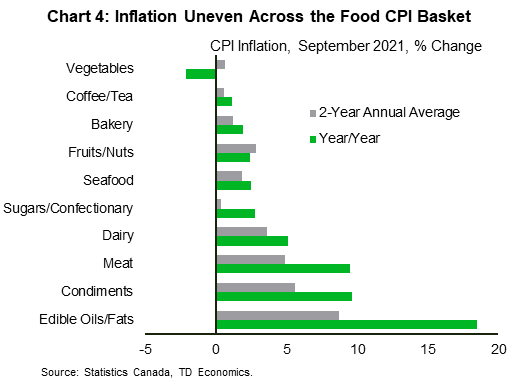
Underneath the overall food CPI measure lies some variation across the components (see Table 1 and Chart 4). The food CPI basket is composed of two overarching categories: food purchased at restaurants, and food purchased at stores. Both have risen, but the impact has been more noticeable in prices for food purchased from stores (4.2% y/y vs. 3.1%). This is perhaps not entirely surprising given that restaurants have only just begun recovering, in contrast to retail and grocery stores, which have seen solid demand since the onset of the pandemic.
Within the different food groups, meats, edible oils/fats, and dairy have seen notable spikes. For edible oils, this may be a result of continued strength in oilseed prices. Some dairy products, like butter, are set to experience further price increases in early 2022. At the other end of the spectrum, prices are below year-ago levels for vegetables. Somewhere in between, price inflation for bakery, fruits, and coffee/tea has remained consistent with historical trends. Similarly, seafood price pressures appear modest. These categories were not all subject to the same weather and production plant disruptions seen in the past year. However, bakery prices, in particular, may start to feel the pinch from surging wheat prices.
Food Demand Notably Resilient
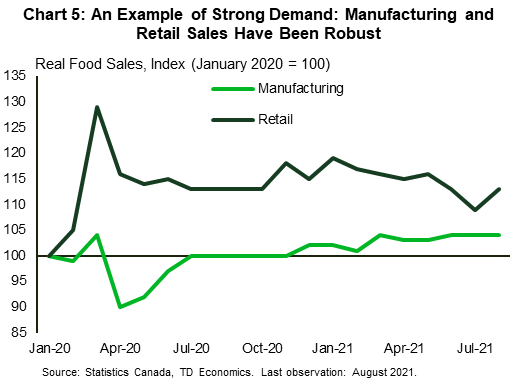
The demand side of the equation for food has been robust. Internationally, demand for key crops and livestock spiked during the pandemic, especially amid concerns of supply chain disruptions among some importers. China's imports stood out, having surged for wheat, oilseeds, pork, and corn. Part of this was driven by higher feed and pork demand as it continued to rebuild its hog herd after it was hard-hit by the African Swine Fever. Meanwhile in Canada, the demand picture surprised on the upside. Real retail and, to a lesser extent, manufacturing food sales surged and remained comfortably above pre-pandemic levels (Chart 5). At the same time, the reopening of Canadian provinces is breathing some life into its restaurant industry, for which activity is starting to rebound. Wrapping it all up, a sizeable household savings cushion (see our latest report), a strong recovery in employment, and resilient incomes are keeping the domestic demand story on a solid footing.
Raw Material Supplies Markedly Lower
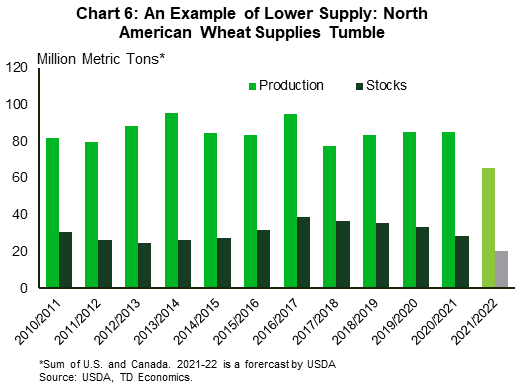
This resilient demand backdrop has been running against a constrained supply side. Agricultural prices are heavily dictated by supply forces. Crop prices markedly turned the corner after more than half a decade of relative stagnation. This was underpinned by a confluence of supply-side factors over the past two years that sent global and North American crop inventories lower (Chart 6). It started in the 2019-20 crop year, where delayed planting impacted U.S. oilseed and corn production and ending inventories. The La Nina weather phenomenon followed in 2020, impacting output in key regions. It still presents a risk to the upcoming planting season. And in Canada, Statistics Canada's crop output projections for the year have taken the spotlight. Wheat and canola production are both set to tumble more than 30%.
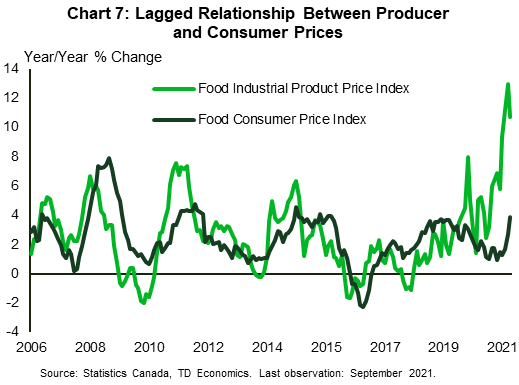
Putting things in context, global market conditions are still not as tight as they were in the mid-to-late 2000s, but they still represent a major departure from the more stable pre-pandemic environment. The result is a spike in global crop prices, and consequently, the raw materials price index (the price paid by manufacturers for raw food items). Higher raw material prices eventually find their way into higher producer prices (the price paid to manufacturers of food). The latter has a lagged impact on consumer prices at the retail store (Chart 7).
To make matters worse, with natural gas being a key input in the production process, global fertilizer prices have recently gone through the roof. Grappling with already-elevated input costs, this may persuade some producers to reduce production/yields or switch to crops less-reliant on fertilizer supply, which may further impact crop supplies.
On the flip side, livestock prices have not seen the same increases. Hog prices were elevated temporarily due to rising demand from China, but have since fallen off a cliff as China's hog inventory was rebuilt. Cattle prices were subdued or the bulk of the pandemic and have only recently started to show signs of life. Meat products still saw a steep rise in retail prices, likely driven by a combination of meat processing plant disruptions/maintenance3 and rising energy prices. Still, the outlook for meat demand remains resilient, considering the healthy income/savings backdrop. This should keep cattle and beef prices on an upward trajectory, though pork prices may remain subdued on cooling demand from China.
Broader Inflation and Supply Chain Disruptions Could be Adding Further Upward Pressure
Raw materials are a critical component of the food CPI picture, but they are complimented by other drivers. Most prominently, energy prices have accelerated this year, and are anticipated to remain elevated into Q1 of next year (forecasted to moderate only slightly). The energy-inflation pass-through can impact all facets of the CPI basket, including food. Along the production chain, farmers, manufacturers, wholesalers, and distributors are all witnessing higher costs.
In terms of supply chain disruptions, Canada has some reprieve. Canada is a net exporter of both raw and processed food, with a positive trade balance in both. Canada is also somewhat less exposed to the spike in natural gas prices seen in parts of Asia and Europe, and has access to domestic potash production capacity. However, producers are still likely feeling the impacts of port delays and rising shipping/input costs.
Barring some volatility at the onset of the pandemic, inventory/sales ratios for the food manufacturing industry have remained broadly consistent with pre-pandemic trends. However, unfilled orders for food manufacturing products have surged in recent months. Unfortunately, these are nominal levels, making it difficult to determine the true volumes effect. A volumes surge could potentially indicate a combination of high demand and a slow supply response.
Finally, with labour market imbalances and shortages expected to foster wage inflation (see our recent report), this may potentially add an extra layer to production and restaurant costs in the future.
Where To From Here?
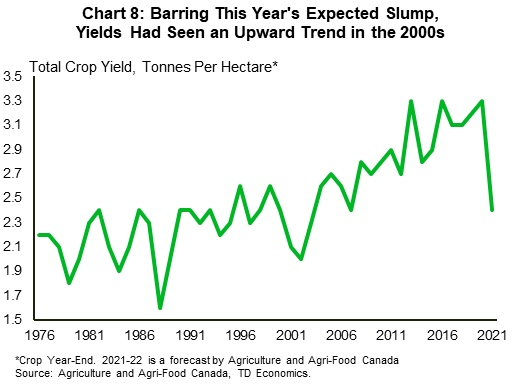
Against this supply-demand backdrop, food inflation will likely remain elevated (possibly as high as 5%-6%) in the near term (until at least the first quarter of 2022 and possibly later), especially amid markedly poor harvests in Western Canada and other global producers. The lagged impacts from producer and import prices also suggests that there may still be further room to go. It remains highly dependent on weather, but a potential return to more supportive growing conditions should help ease inflation later in 2022. Providing some respite are the agricultural sector's productivity and yields, which have risen significantly and consistently over the past several decades, both globally and in Canada (Chart 8) – barring this year's aberration. More broadly, a global tightening in monetary policy and a slowdown in China's industrial production may work to cool international demand in some areas, including shipping and energy, dampening the impact from input prices. Some prices, including those for shipping, natural gas, and coal, are starting to come off the boil. Finally, potential demand destruction may start to put a lid on price increases in some categories, especially ones where a large potential for substitution exists.
Still, the impacts on inventories in the past two years suggest that risks are tilted squarely to the upside should 2022 harvests disappoint again.
Bottom Line
Food inflation is becoming a bigger contributor to CPI inflation growth in Canada. A look at some of the drivers indicates that it may exhibit some persistence in the near term, before moderating later in 2022. Still, an easing in price conditions then remains highly predicated on improving weather and growing conditions in the new crop year.
Table 1 - Consumer Price Index Changes (September 2021)
| Category | Year/Year | 2-Year (Annualized) | Month/Month* | Month/Month 3 MMA (Annualized) |
| All-Items | 4.4 | 2.5 | 0.4 | 6.1 |
| Food | 3.9 | 2.8 | 0.9 | 8.8 |
| Meat | 9.5 | 4.9 | - | - |
| Seafood | 2.5 | 1.8 | - | - |
| Dairy | 5.1 | 3.6 | - | - |
| Bakery | 1.9 | 1.3 | - | - |
| Fruits/Nuts | 2.5 | 2.9 | - | - |
| Vegetables | -2.1 | 0.6 | - | - |
| Other | 5.3 | 2.6 | - | - |
| Sugar | 2.8 | 0.4 | - | - |
| Fats/Oil | 18.5 | 8.7 | - | - |
| Coffee/Tea | 1.1 | 0.6 | - | - |
| Condiments | 9.6 | 5.6 | - | - |
| Shelter | 4.8 | 3.3 | 0.3 | 4.3 |
| Household Operations/Furnishings | 1.5 | 0.9 | 0.2 | 3.6 |
| Clothing & Footwear | 0.2 | -1.9 | -0.4 | -1.6 |
| Transportation | 9.1 | 4.6 | 0.8 | 14.9 |
| Health and Personal Care | 3.0 | 2.3 | 0.3 | 2.5 |
| Recreation, Education, Reading | 2.1 | 0.4 | 0.4 | 3.9 |
End Notes
- As per data from the Survey of Household Spending. These differences are relatively modest but will be significantly higher after accounting for total expenditures (i.e. including taxes).
- See announcement from the Canadian Dairy Commission: https://cdc-ccl.ca/index.php/en/news/latest-news/latest-news-for-2021/farm-gate-milk-prices-to-be-increased/
-
Statistics Canada highlighted in the September CPI report that temporary maintenance was among a confluence of drivers causing the rise in meat prices.
Disclaimer
This report is provided by TD Economics. It is for informational and educational purposes only as of the date of writing, and may not be appropriate for other purposes. The views and opinions expressed may change at any time based on market or other conditions and may not come to pass. This material is not intended to be relied upon as investment advice or recommendations, does not constitute a solicitation to buy or sell securities and should not be considered specific legal, investment or tax advice. The report does not provide material information about the business and affairs of TD Bank Group and the members of TD Economics are not spokespersons for TD Bank Group with respect to its business and affairs. The information contained in this report has been drawn from sources believed to be reliable, but is not guaranteed to be accurate or complete. This report contains economic analysis and views, including about future economic and financial markets performance. These are based on certain assumptions and other factors, and are subject to inherent risks and uncertainties. The actual outcome may be materially different. The Toronto-Dominion Bank and its affiliates and related entities that comprise the TD Bank Group are not liable for any errors or omissions in the information, analysis or views contained in this report, or for any loss or damage suffered.
Download
Share this: