Highlights
- Despite turning in solid headline growth in recent years, Canada has lagged behind the U.S. and other advanced economies in terms of standard of living performance (or real GDP per capita).
- This underperformance accelerated after the 2014-15 oil price shock and has continued in the wake of the pandemic. What’s more, little turnaround appears to be on the horizon.
- There may be a tendency to pin the blame for Canada’s sagging per-capita showing on the country’s rapidly-growing population base given that it has inflated the denominator of the calculation. However, at the crux of the problem is insufficient growth in the numerator, which in turn is tied to longstanding productivity issues.
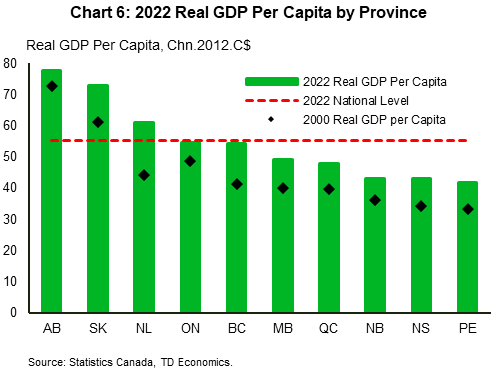
- Regionally, commodity-based economies (Alberta, Saskatchewan, and Newfoundland & Labrador) continue to record the highest per-capita GDP levels, but their status as leaders has come under some pressure over the past decade. Post-pandemic, only British Columbia and PEI have managed to recover back to 2019 GDP per capita levels.

By most metrics, Canadian economic growth carries a solid historical track record. Even in the face of the pandemic-induced downturn, supercharged immigration and robust population helped to fuel a swift recovery, with especially sizeable impacts recorded in both housing and consumption. The impetus infused by a rising number of households – both in terms of demand and labour supply – goes a long way in explaining the recent resiliency in Canada’s domestic economy, even during the Bank of Canada’s aggressive tightening campaign.
Economic growth does not necessarily equate to economic prosperity. While aggregate GDP is one thing, standard-of-living is another, and when Canada’s economic performance is adjusted for the rising population count, it reveals a picture that leaves much to be desired. This country’s lagging standing in per-capita GDP is not new, but it has been worsening since the pandemic.
Real GDP Per Capita – Looking Under the Hood
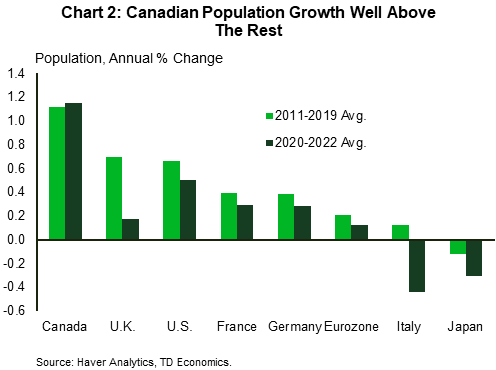
Chart 1 shows average historical growth performance, both within the G-7 as well as pre- and post-pandemic. In short, it puts Canada in a relatively favourable light. In the decade ahead of the pandemic, Canada matched the U.S. tit-for-tat in terms of average growth at just over 2% per year, above the 1.4% G-7 average. And in the post-pandemic years, the country managed to shake off among the deepest contractions in 2020 to record the second fastest average expansion. A key driver of the outperformance has been the country’s longstanding trend of strong population gains, which have easily outpaced those of other advanced economies (chart 2). The Canada-G7 gap on headcount has swelled further since 2020.
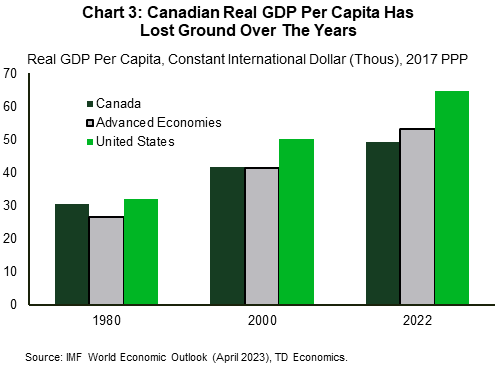
But when adjusting for the rising population, Canada’s real GDP per capita has been deteriorating for many years (chart 3). At the start of the 1980s, Canada enjoyed an edge against the average of advanced economies of almost US$4,000 while keeping fairly level with U.S. estimates. By 2000, this advantage had all but evaporated, and U.S. per capita GDP had pulled ahead of Canada’s to the tune of over US$8,000. Still, since the 2014-15 oil shock, Canada’s performance has gone from bad to worse. Canadian real GDP per capita has grown at a meagre rate of only +0.4% annually, paling in comparison to the advanced economy average of +1.4%.
So, Why The Sagging Performance In Real GDP per Capita?
At first glance, it may be easy to point the finger at rapid population growth as the solo driver of poor per-capita GDP given that it has inflated the denominator of the calculation. However, this is an oversimplification that masks the true story. Canadian headcount is currently running at a historic 3% y/y pace, but that is a very recent development. Indeed, average population growth since 2020 (1.2%) has only run a hair higher than its pre-2000 pace. In contrast, real GDP growth has been trending downwards since the 1980s. This implies that the real culprit is insufficient growth in the numerator (real GDP). In other words, Canada was able to sustain higher GDP growth rates in prior decades at population growth levels similar to today.
At the core of the issue is a sagging productivity showing that has been plaguing the Canadian economy for many years despite the well-intentioned moves of this countries’ policymakers to try and address it. When measured on a real GDP per hour worked basis, Canadian labour productivity has been trailing behind its peers, notably the U.S. Even in the face of the productivity woes, Canada has been able to sustain a higher level of output in recent years through both an unsustainable pace of job creation and in total hours worked.
The Culprits Behind Canada’s Lagging Productivity
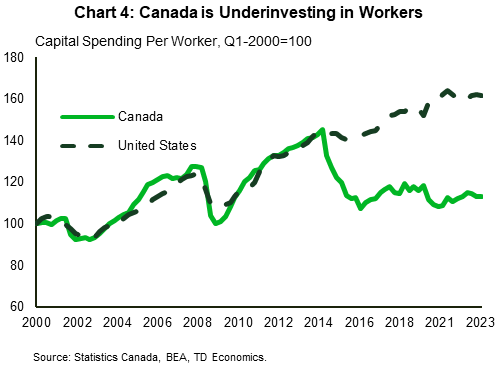
A number of factors are often blamed on Canada weak productivity showing. For one, investments in nonresidential structures, machinery & equipment, and intellectual property have been lackluster since 2015. The use of these inputs makes labour more effective, and a comparison to trends stateside shows significantly weaker capital intensity north of the border (chart 4).
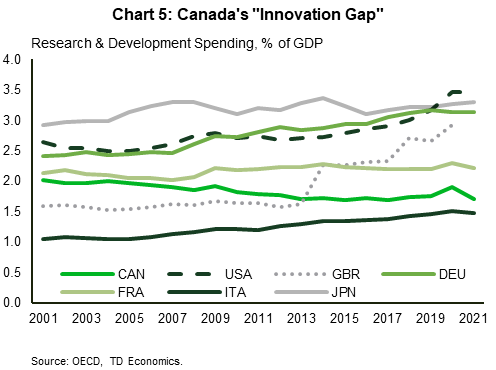
The problem can be also attributed to a decline in research & development (R&D) spending, which has led to an “innovation gap”. Over the last 20 years, Canadian R&D investment has been in perpetual decline, while all other G7 countries have seen increases to varying degrees. This issue is being compounded by already-low absolute levels of R&D investment as a per cent of GDP. As of 2021, Canadian R&D spending accounted for roughly 1.7% of GDP, half of the current U.S. share and lower than most other countries (chart 5).
Meanwhile, Canada’s relatively large concentration of small firms in output and employment is likely another contributor to the productivity gap. Firms of smaller scale tend to export and invest less than their larger counterparts. Inefficient regulatory and tax policies are other factors cited as inhibitors to Canadian productivity and innovation.
Capital Intensive Economies Are Better Off, But Slower to Recover
Regional trends in per-capita GDP are highlighted in charts 6 and 7. Alberta, Saskatchewan, and Newfoundland & Labrador continue to record the highest levels of GDP per capita among the provinces owing to the high capital intensity of their key oil sectors. However, their status as leaders has been under some pressure since the oil price shock of 2014-15 and subsequent shift away from new, large-scale resource investment.
Honing in on post-pandemic trends, British Columbia and Prince Edward Island are the only provinces that have managed to recover to their 2019 real GDP per capita levels. Nonetheless, these two provinces still sit below the national average (which, as noted earlier, has less than fully recovered from the pandemic).

No Improvements for the Foreseeable Future

Unfortunately for Canadians, little turnaround in Canadian living standards appears to be on the horizon. Real GDP per capita has already contracted over the last three quarters and our most recent forecast points to persistent contractions until the end of 2024 (chart 8). In the coming quarters, the economy is expected to suffer a cyclical slowdown as ambitious federal immigration targets continue to prop up population flows. Canada is also one of the few advanced countries that has not recovered its pre-pandemic level of per capita GDP. Longer-term, the OECD projects that Canada will rank dead last amongst OECD members in real GDP per capita growth out until 2060. This underscores that without fundamental changes to our approach to productivity and growth, Canada’s standard-of-living challenges will persist well into the future.
Bottom Line
It is becoming increasingly difficult to ignore Canada’s widening real GDP per capita gap versus other major economies. The issue has largely flown under the radar as the Canadian economy seemingly masked ongoing productivity issues with what appears to be unsustainable growth via adding more workers. The crux of the problem remains the same: a sagging performance in labour productivity.
Disclaimer
This report is provided by TD Economics. It is for informational and educational purposes only as of the date of writing, and may not be appropriate for other purposes. The views and opinions expressed may change at any time based on market or other conditions and may not come to pass. This material is not intended to be relied upon as investment advice or recommendations, does not constitute a solicitation to buy or sell securities and should not be considered specific legal, investment or tax advice. The report does not provide material information about the business and affairs of TD Bank Group and the members of TD Economics are not spokespersons for TD Bank Group with respect to its business and affairs. The information contained in this report has been drawn from sources believed to be reliable, but is not guaranteed to be accurate or complete. This report contains economic analysis and views, including about future economic and financial markets performance. These are based on certain assumptions and other factors, and are subject to inherent risks and uncertainties. The actual outcome may be materially different. The Toronto-Dominion Bank and its affiliates and related entities that comprise the TD Bank Group are not liable for any errors or omissions in the information, analysis or views contained in this report, or for any loss or damage suffered.
Download
Share: