2026 Ontario Fall Fiscal Update:
Wider Deficits Amid Targeted Stimulus
Rishi Sondhi, Economist | 416-983-8806
Date Published: October 29, 2026
- Category:
- Canada
- Government Finance & Policy
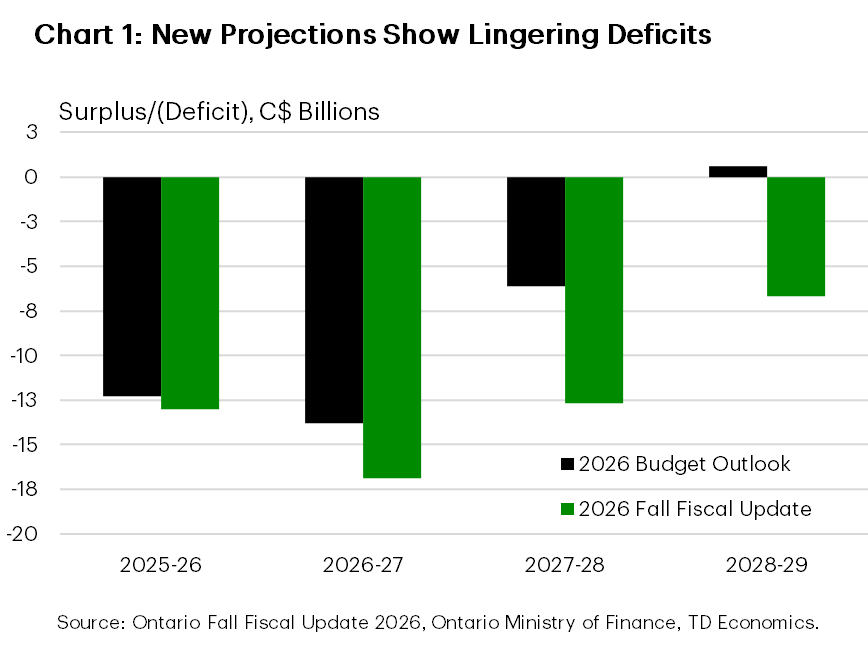
- In an eye-catching change to its expected fiscal path, the Ontario government is projecting nearly $17 billion more in cumulative red ink from FY 2026/27 – FY 2028/29 versus budget expectations. Compared to the spring budget, the return to balance has been pushed out a year further to FY 2029/30. Medium-term net debt-to-GDP projections and interest cost projections have also been upgraded.
- For this fiscal year, Ontario’s deficit is expected to be $16.9 billion, compared to $13.8 billion forecast in the spring. Higher program spending accounts for the deterioration, although as a share of GDP (1.3%), the shortfall is not too far off the long-run average.
- After this fiscal year, medium-term deteriorations are driven by downgraded revenue expectations. This reflects weaker personal income tax revenues amid a downgraded employment growth forecast.
- The government expects real GDP growth to accelerate through the projection horizon after a soft, 0.5% outturn in 2026. It's forecast at 1.5% in 2027, 1.8% in 2028 and 2% in 2029. Nominal GDP growth, which more directly influences the revenue base, is forecast at 3.7% in 2026, climbing by 0.1 ppt each year to reach 4% by 2029.
- The government's nominal GDP projections are about 0.6 ppts shy of ours in 2026 and 2027 (on average), signaling revenue upside for the government if we're more on the mark. This year in particular has the potential to show significant upside given a robust Q2 gain in nominal GDP (11% annualized).
- FY 2026/27 revenues are seen as growing 4.2%. This is below the long-run average, with healthy gains in personal income and corporate taxes offset by declines from government business enterprises and other non-tax revenues. Modest revenue growth is expected after this year, restrained by a soft economy and falling federal transfers.
- Ontario had previously announced more than $8 billion in business tax relief over five years by paralleling the federal Productivity Mega Deduction, allowing businesses to immediately expense a considerably broader range of capital investments. This policy took centre stage in the fiscal update.
- This so-called "Competitiveness Tax Cut" is estimated to lower Ontario's Marginal Effective Tax Rate (METR) by 6.1 ppts, according to the government. It is also assumed to add $6 billion to GDP, although the period over which this boost would occur is not specified.
- The government will also offer modest tax support to help lower the cost of research and development.
- The update also provided costing for the temporary relief on the full 13% HST on new homes enacted earlier this year. All told, it's expected to cost the government a cumulative $1.5 billion over the next three years.
- Base program spending growth is pegged at a modest 2.4% this fiscal year. Health care remains a key spending priority, with essentially no growth anticipated in other major categories. After this fiscal year, program spending growth is seen as averaging a modest 0.9% over the medium term. The budget also highlights previously announced joint federal-Ontario aid for the steel and auto sectors.
- Overall spending is seen as climbing 5% this fiscal year, owing to a $3.8 billion top-up to the contingency fund and a 12% jump in interest costs.
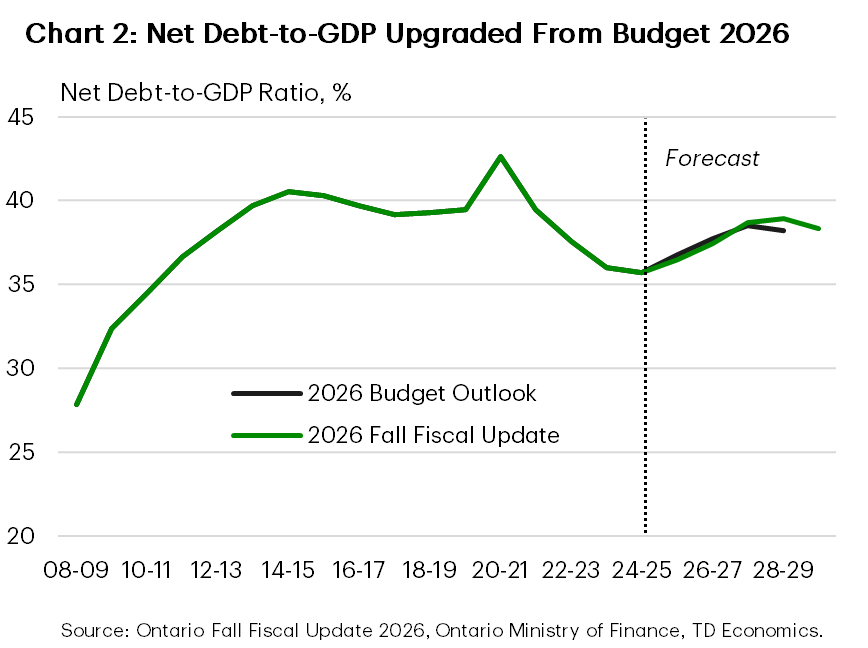
- The province’s net debt-to-GDP ratio is pegged at 37.4% in FY 2026/27, up from 36.5% the prior year and the middle of the pack compared to other provinces. It's seen as averaging 38.8% over the medium term, about 0.4 ppts higher than in the spring budget.
- Borrowing requirements are seen at $51.1 billion this fiscal year, down from $58.6 billion the year prior. Requirements are expected to fall to $45.4 billion by FY 2028/29 as deficits shrink and capital asset investment moderates. As a share of revenues, interest costs are seen at 6.7% this fiscal year (up from a recent low of 6% the year prior), rising to 7.5% by FY 2028/29. This is above spring budget forecasts, but well below the threatening levels observed in the mid-1990s to early 2000s. For reference, the ratio averaged about 13.5% over that earlier period.
Economic Forecasts
[ Percent change unless otherwise noted]
| Economic Forecasts | 2025 | 2026F | 2027F | 2028F | 2029F |
| Real GDP | 1.3 | 0.5 | 1.5 | 1.8 | 2.0 |
| Nominal GDP | 4.1 | 3.7 | 3.8 | 3.9 | 4.0 |
Bottom Line
- Ontario’s fall economic statement outlines a deterioration in the province’s fiscal trajectory. That said, the government's conservative nominal GDP growth forecasts offer room for revenue upside and a chunk of this year's upward revision to program spending reflects a hefty top-up to the contingency fund.
- The most noteworthy new measure is the Competitiveness Tax Cut, which, alongside the federal Productivity Mega Deduction, could stimulate investment in the province at the cost of forgone revenues. Otherwise, the fiscal update was relatively light on new measures, with the government touting its sizeable $30+ billion commitment to supporting the economy so far.
- Even with the anticipated deterioration, Ontario's debt burden and interest costs remain manageable thus far, particularly compared to the recent debt run-ups in other provinces. Part of this reflects the starting point, with Ontario's debt-to-GDP ratio coming in slightly lower than expected in FY 2025/26. However, achieving budget balance relies on holding go-forward program spending growth to rates not sustainably seen in nearly 15 years.
- Persistent deficits and an ambitious capital plan continue to pressure borrowing requirements. Net debt-to-GDP remains below the government's 40% guardrail, but the amount of fiscal room has narrowed relative to FY 2025/26, exposing finances to an unanticipated downside shock. At the same time, capital spending plans could stimulate near-term economic growth and have the potential to boost productivity over the long run.
Government of Ontario Fiscal Plan
[ C$ billions unless otherwise noted ]
| Fiscal Year | 2026 Fall Fiscal Update | ||||
| 25-26 | 26-27 | 27-28 | 28-29 | 29-30 | |
| Revenues | 223.3 | 232.6 | 238.2 | 247.9 | 257.8 |
| % Change | -0.7 | 4.2 | 2.4 | 4.1 | 4.0 |
| Expenditures | 236.3 | 247.3 | 247.3 | 250.8 | 253.8 |
| % Change | 4.5 | 4.7 | 0.0 | 1.4 | 1.2 |
| Program Spending | 220.9 | 229.9 | 228.4 | 230.3 | 232.8 |
| % Change | 4.7 | 4.1 | -0.7 | 0.8 | 1.1 |
| Interest Charges | 15.5 | 17.4 | 18.9 | 20.4 | 21.1 |
| % Change | 2.6 | 12.3 | 8.6 | 7.9 | 3.4 |
| Reserve | - | 2.2 | 3.6 | 3.8 | 3.8 |
| Budget Balance | -13.0 | -16.9 | -12.7 | -6.7 | 0.2 |
| % of GDP | -1.0 | -1.3 | -0.9 | -0.5 | 0.0 |
| Net Debt | 455.0 | 483.8 | 519.7 | 541.8 | 555.3 |
| % of GDP | 36.5 | 37.4 | 38.7 | 38.9 | 38.3 |
Disclaimer
This report is provided by TD Economics. It is for informational and educational purposes only as of the date of writing, and may not be appropriate for other purposes. The views and opinions expressed may change at any time based on market or other conditions and may not come to pass. This material is not intended to be relied upon as investment advice or recommendations, does not constitute a solicitation to buy or sell securities and should not be considered specific legal, investment or tax advice. The report does not provide material information about the business and affairs of TD Bank Group and the members of TD Economics are not spokespersons for TD Bank Group with respect to its business and affairs. The information contained in this report has been drawn from sources believed to be reliable, but is not guaranteed to be accurate or complete. This report contains economic analysis and views, including about future economic and financial markets performance. These are based on certain assumptions and other factors, and are subject to inherent risks and uncertainties. The actual outcome may be materially different. The Toronto-Dominion Bank and its affiliates and related entities that comprise the TD Bank Group are not liable for any errors or omissions in the information, analysis or views contained in this report, or for any loss or damage suffered.
Download
Share this: