

I thought President Trump threw us curve balls last year, but the start of 2026 came completely out of left field. The year opened with the removal of Venezuela’s president by force, to questioning Greenland’s sovereignty. Next came threats of higher tariffs on EU countries that supported Greenland. This was another reminder that tariffs are the primary coercive tool of this administration regardless of the existence of trade agreements.
Then Canada got hit with a 100% tariff threat on all goods after the administration learned of an agreement with China to defuse its trade relationship on EVs and agriculture. But it didn’t stop there. The threat of 50% tariffs on Canadian-made aircrafts followed in response to delays on certifying Gulfstream jets. And to make sure Canada wasn’t feeling singled out, South Korea was threatened with a 10-percentage point lift in tariffs for not moving fast enough on their trade commitments with the U.S.
So that was the first 4 weeks of the year!
This presentation will cut thru the noise and review what’s new and not in the U.S. and Canadian outlooks. The main takeaway is that the U.S. economy has been unflappable, with the forecast materially revised up. In contrast, there’s little change to Canada’s narrative.
Let’s get going, starting with how to sort out all the tariff threats, which falls into the “not-new-camp”.
Trump’s National Security Strategy: Clear Economic Priorities
- Western Hemisphere is the priority and immigration is a major national security concern
- Economic Security “is fundamental to national security” and includes the following emphases to “strengthen the American economy”:
- Balanced trade
- Securing access to critical supply chains and materials
- Reindustrialization – strategic use of tariffs and new tech
- Reviving Our Defense Industrial Base
- Energy Dominance
- Preserving and growing financial sector dominance – leveraging free market system and our leadership in digital finance and innovation
- Emphasis on tariffs as a tool = unlikely to have tariff certainty in this administration
- Removal of past references to “rules-based international order” or “international law”.
The first point to make is that the Trump administration gave us a clear road map of their strategy… and we shouldn’t question it.
This text box captures the main points published in the National Security Strategy (NSS) late last year. One analyst called this list “less of an announcement than an explanation “. The highlighted section at the bottom calls out a couple areas that double-down on using tariffs as a strategic tool, and the abandonment of text that was related to a “rules-based order”.
In the context of game theory, when one player is significantly dominant over the other player, then breaking the rule becomes the rule. For the U.S., economic and military dominance means that tariffs and other threats won’t leave their toolkit. The administration does not perceive reputational risk as material, relative to the payoffs of coercing trade deals or inward investment into the U.S. that aligns to its economic security strategy.
But, while we shouldn’t question this playbook, we still need to interpret it.
Tariff Instability To Remain A Theme in 2026
Boundaries do exist on how far you can push the rule breaking.
Case in point, last week’s Supreme Court decision was significant in setting limitations around use of IEEPA and executive power.
Importantly, however, the judgement was met with a cautious response globally, since it doesn’t alter the overarching intent and strategy of the Trump administration. Tariffs will remain a primary tool in redefining trade relationships, evidenced by the executive order citing alternative powers with sections 122 and 301 and section 232 remains a tool.
Even before the much-awaited decision, guardrails around the application of tariffs were becoming more evident.
This schematic shows that only one-third of Trump’s tariff threats have turned into actual outcomes, which is captured on the left side. A key distinction of what turns a threat into a reality is the existence of an executive order, but even this isn’t a guarantee.
For instance, tariffs were scheduled to rise on wood products from 25% to 50% on January 1st of this year. This was pushed out to 2027, with the administration citing a desire to have more time to reach productive negotiations with trade partners. This explanation, however, reveals an important limitation on rule breaking. The administration is sensitive to any tariff that immediately impacts household affordability ahead of mid-term elections. In this case, wood product tariffs would directly hit prices on bathroom vanities, cabinetry and similar items.
Applying the same logic, Trump’s threat of tariffs on all Canadian goods was not realistic but was meaningful in defining the limits of a trade agreement Canada can reach with China. On the other hand, the threat of 50% tariffs on Canadian made aircraft had more credibility because it was targeted and does not immediately feed downstream to consumers.
So threats that are further upstream on manufacturers and wholesalers should be taken more seriously than on final consumer goods, at least in the near term.
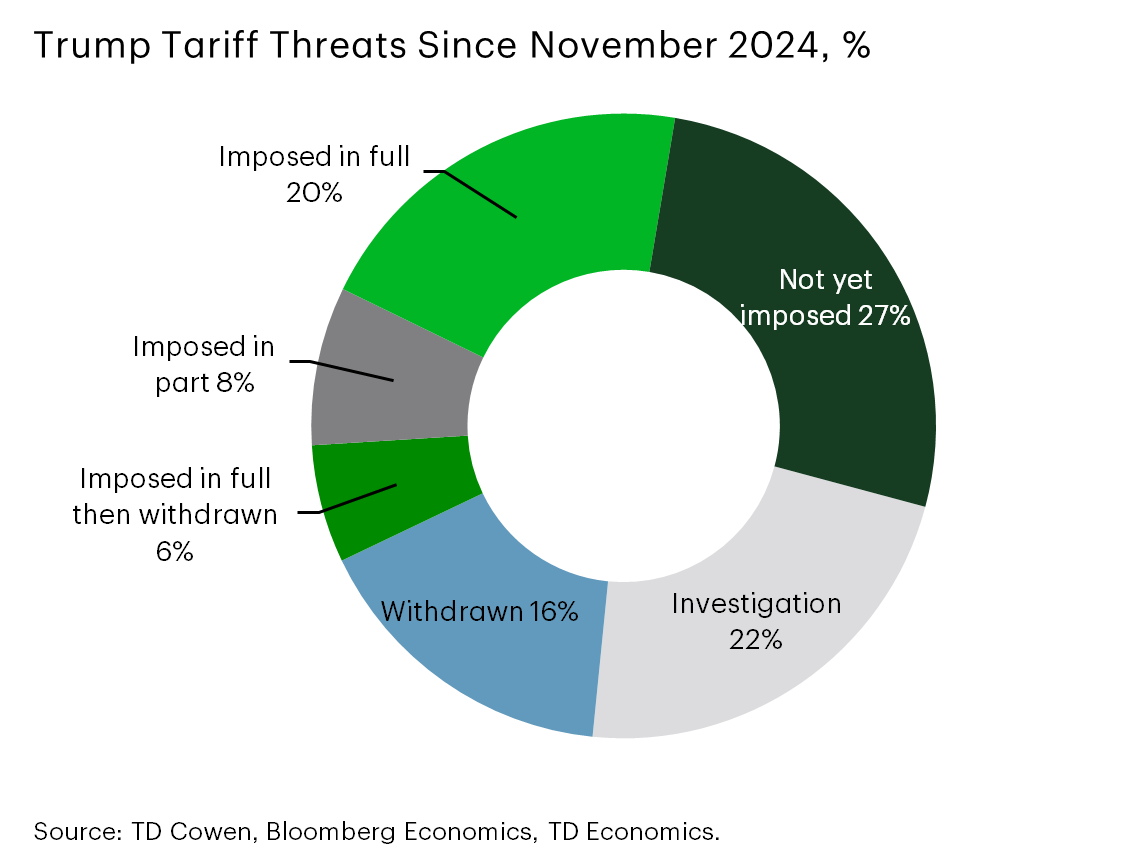
- Only about 35% of Trump’s tariff threats have been imposed
- Need executive order to turn a threat into action.
- Any direct threat to household affordability becomes a policy restraint.
Trump Getting More Sensitive to Impacts on Consumers
But even this approach is not a hard-and-fast rule.
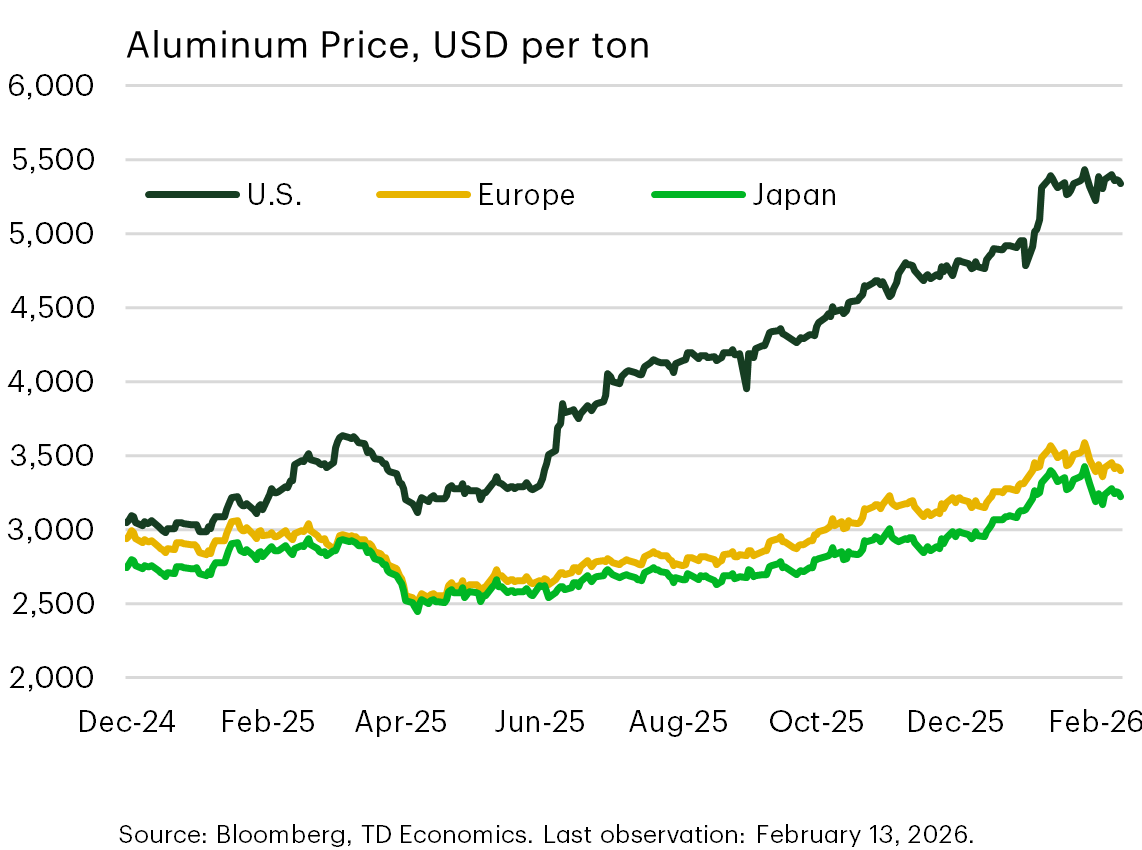
Recently, Trump commented that he was considering a reduction in tariffs on steel, aluminum and copper products. These all fall under section 232 tariffs that are as high as 50% and cover roughly 400 products due to successful lobbying efforts by domestic industry. This graph gives an example of how high raw U.S. aluminum prices are relative to international peers. This massive gap is truly anomalous because the global commodity market tends to be cohesive.
With the passage of time, it’s reasonable to expect companies to keep passing higher input costs to consumers, rather than absorb them, if they believe tariffs are part of the permanent landscape. And this is showing up in many consumer products, such as the aluminum cans in the packaging of food and drinks.
So here we have another example that rule-breaking has limits as the administration rethinks the blanket approach when consumer impacts are obvious. And this is an extension from action taken last year to remove tariffs on over 200 food products that were harming household affordability.
As an extra mention, Canadian producers and consumers stand to benefit from a rollback in U.S. policy because sourcing aluminum anywhere in North America has resulted in these high raw material prices, made worse by Canadian exporters facing another set of tariffs on the shipment of products into the U.S.
Tariff Pass-Through A Blemish on Inflation
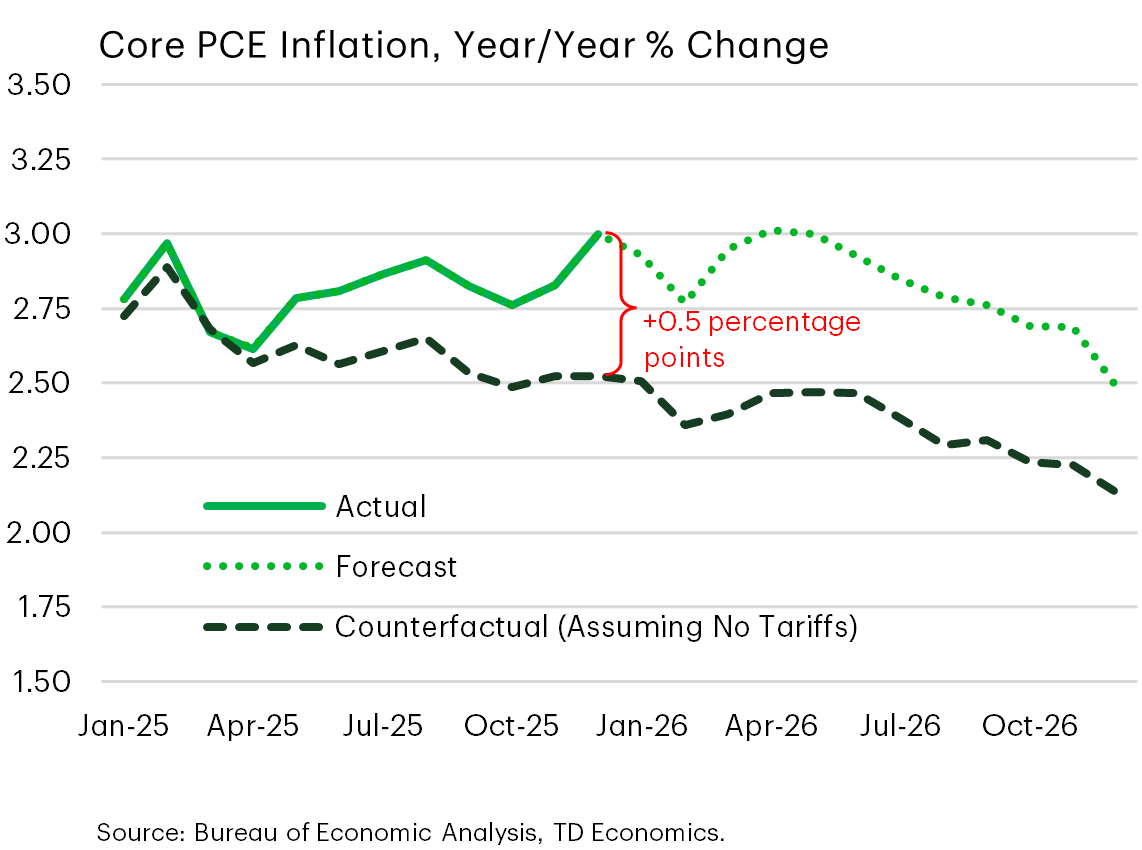
Here’s the big picture we estimate is playing out on household prices from all the tariffs imposed.
This is the PCE deflator, which is the Fed’s focus for inflation rather than the CPI metric often cited by media. I’m demonstrating the gap in inflation between “actual” and the “counterfactual” that would exist absent tariffs. To date, passthrough has been relatively small, but is showing signs of picking up, which is partly why sensitivity is rising within the Trump administration.
January CPI data came in slightly below market expectations, causing markets to breathe a sigh of relief. But this masked the fact that prices on goods were weighed down by a single category – used vehicle prices. Removing this effect saw the price for core goods rise more than any other month in a year. This is an example that with the passage of time, the risk becomes amplified that we will see more price adjustments by retailers.
U.S. Dollar Plummets Alongside Yield Curve Repricing
The other rule-breaking restraint, and an effective one, is the market reaction to policy announcements.
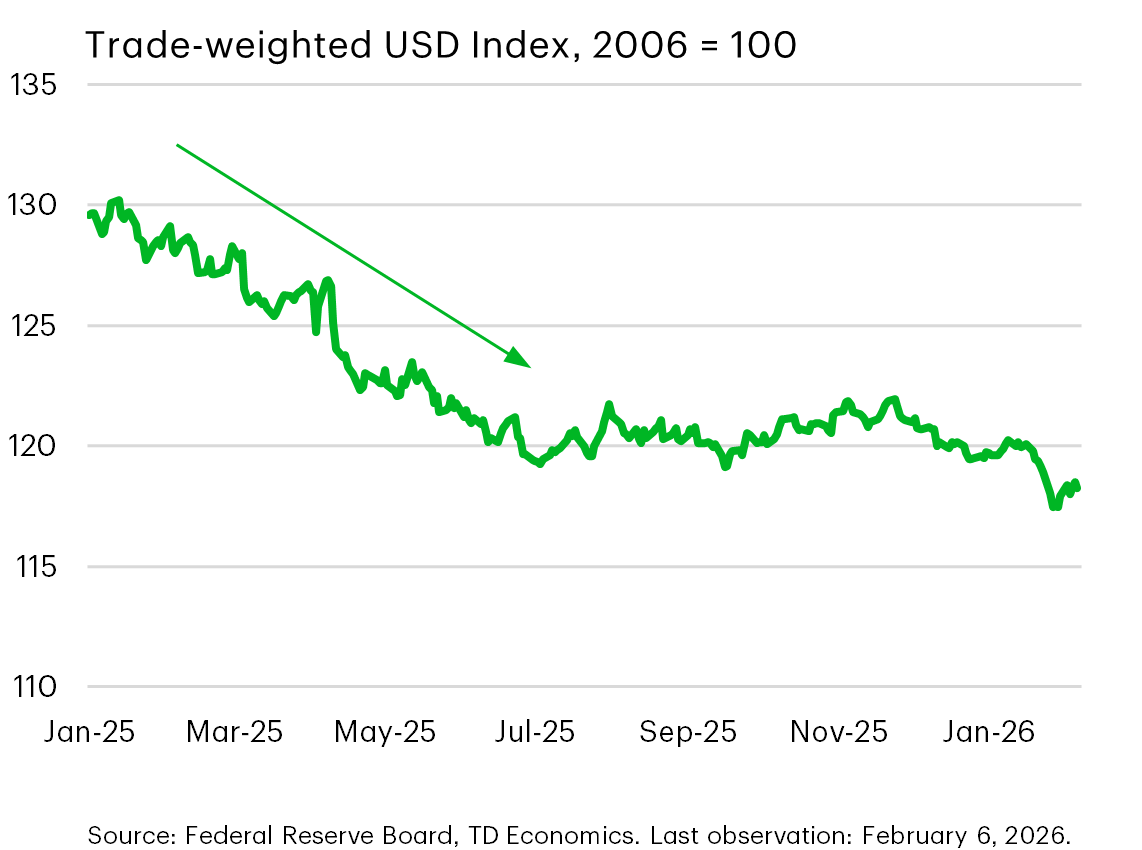
One of the most asked client questions is related to understanding the decline of the U.S. dollar, and how much further it has to go. Last year, the trade weighted dollar fell 8%, followed by an additional 1 percentage point depreciation in the early days of this year.
Most of the dollar’s repricing happened in the first half of the year, related to “Liberation Day” tariffs, budget deficit concerns and worries around Fed independence. These concerns remain but are now known elements and another big leg down in the currency would likely require another set of unexpected geopolitical or domestic dynamics to materialize.
So we can bucket the market drivers into three groups:
- The first is safe-haven shifts, as investors diversifying away from the greenback. Benefactors have been the Euro, the Swiss Franc, Norwegian Krone, and gold also falls into this category.
- The second relates to “Fundamentals”, such as expectations on inflation and narrowing interest rate gaps relative to peers.
- And the third reflects other currencies boosted by the commodity cycle (especially metals), such as the Australian and South African dollars.
Significant shifts in any of these three categories would predict more aggressive repricing.
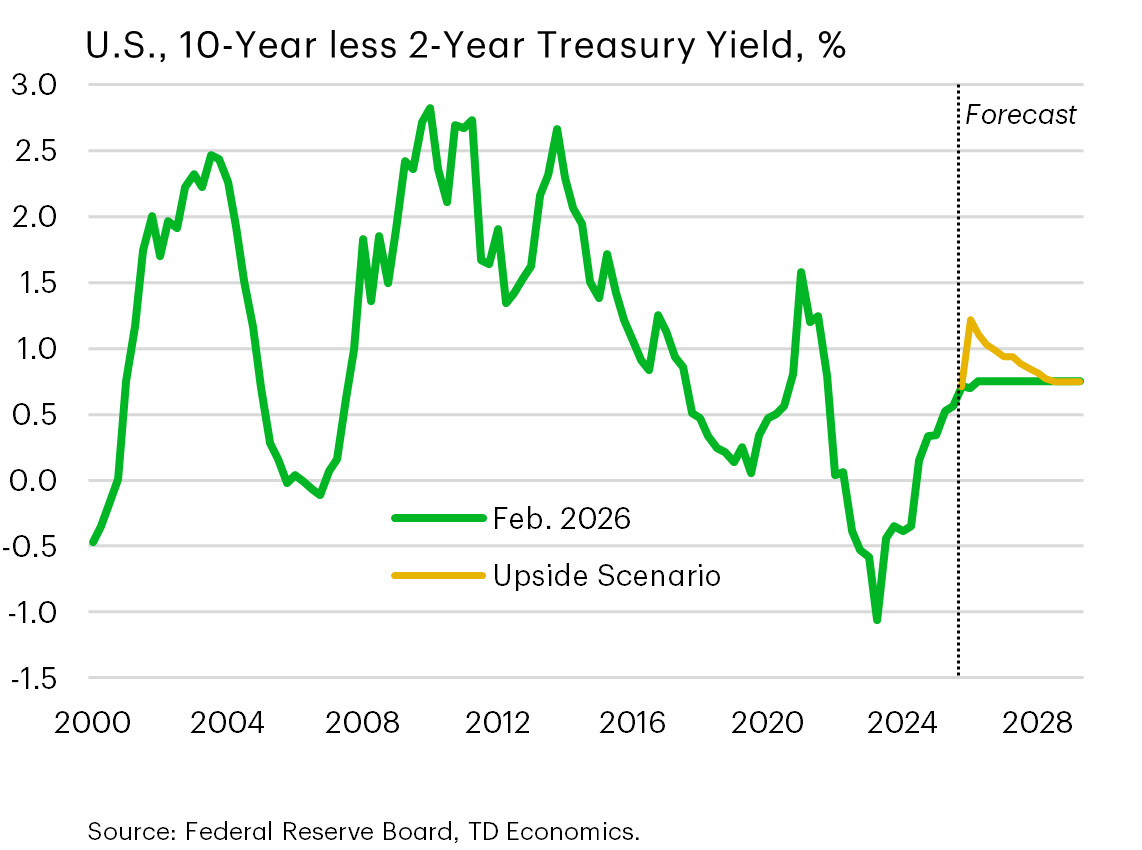
Returning to the notion that rule-breaking has boundaries, the administration welcomes some depreciation to improve export competitiveness but nothing that displays a loss of confidence or loss of market dominance, because it runs counter to their national security strategy. In addition, they must be mindful of the repricing along the yield curve, which has steepened alongside stubborn long-term yields.
The Upside Scenario in the 10-2 yield spread graph is based on how it behaved in the past during rate-cut cycles. There’s been a lot of market chatter on a higher risk premium at the long end of the curve. And when we see yield movements in isolation, they do look large. But when we pull back the historical lens, a term premium of 100 basis points would be considered normal in a rate-cut cycle, suggesting that even if there’s more spread widening, we shouldn’t naturally assume it’s related to a meaningful loss in investor confidence.
Context Matters on the U.S. Dollar
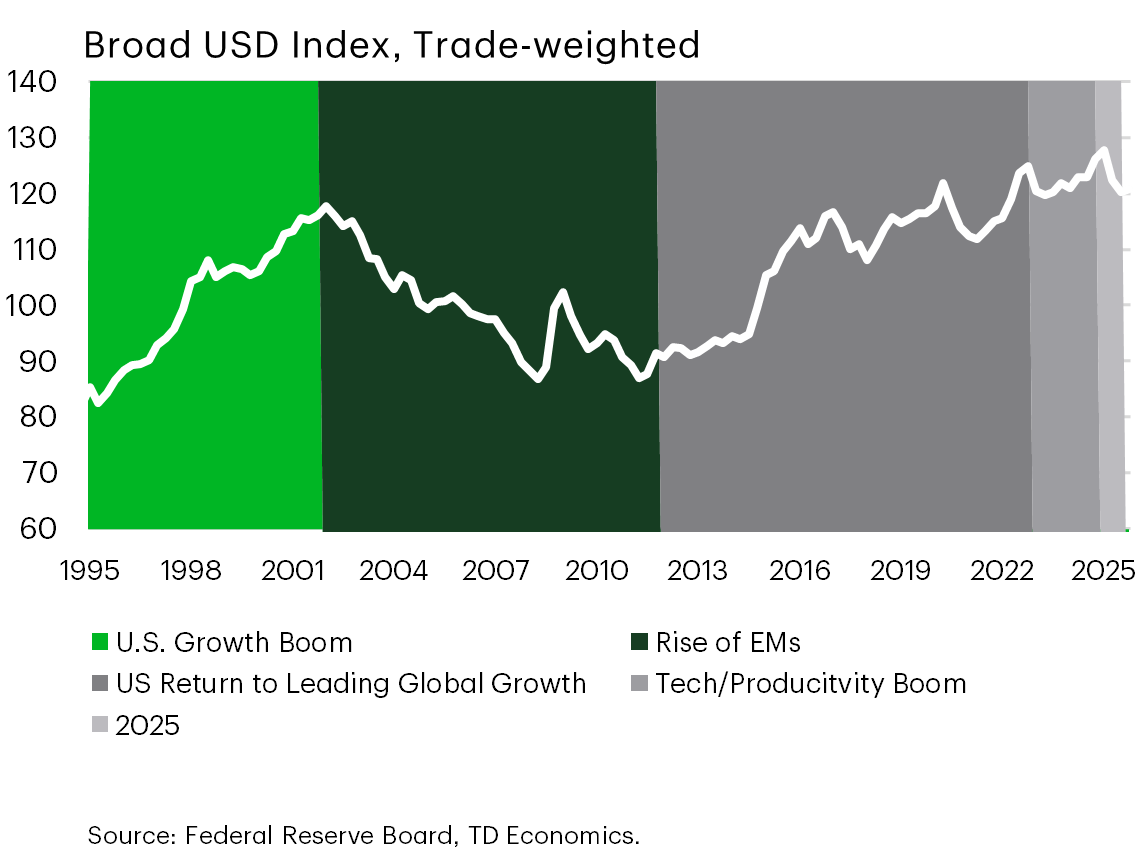
And to reinforce the importance of historical context, here’s the U.S. dollar back three decades that requires you to almost have to squint to see the depreciation that occurred last year.
This also shows a broader point that currency cycles are multi-year, shown by the color coding. When the momentum holds, it unfolds over years with shifts of 25% to 40%. There are similarities today to the Dot.com boom and bust which was when:
- the US economy was growing faster to peer countries
- U.S. equities were outperforming
- And the Federal Reserve was holding interest rates higher than peers
If this AI boom cycle turns into a bust cycle, this becomes an argument that U.S. dollar depreciation could be another 10% or more, if it mirrors that cycle. But the current movements are not yet alarming or unusual in this historical context.
Surprisingly, Nothing Shaking U.S. Economic Momentum
For now, nothing seems to be shaking the U.S. economic dynamics.
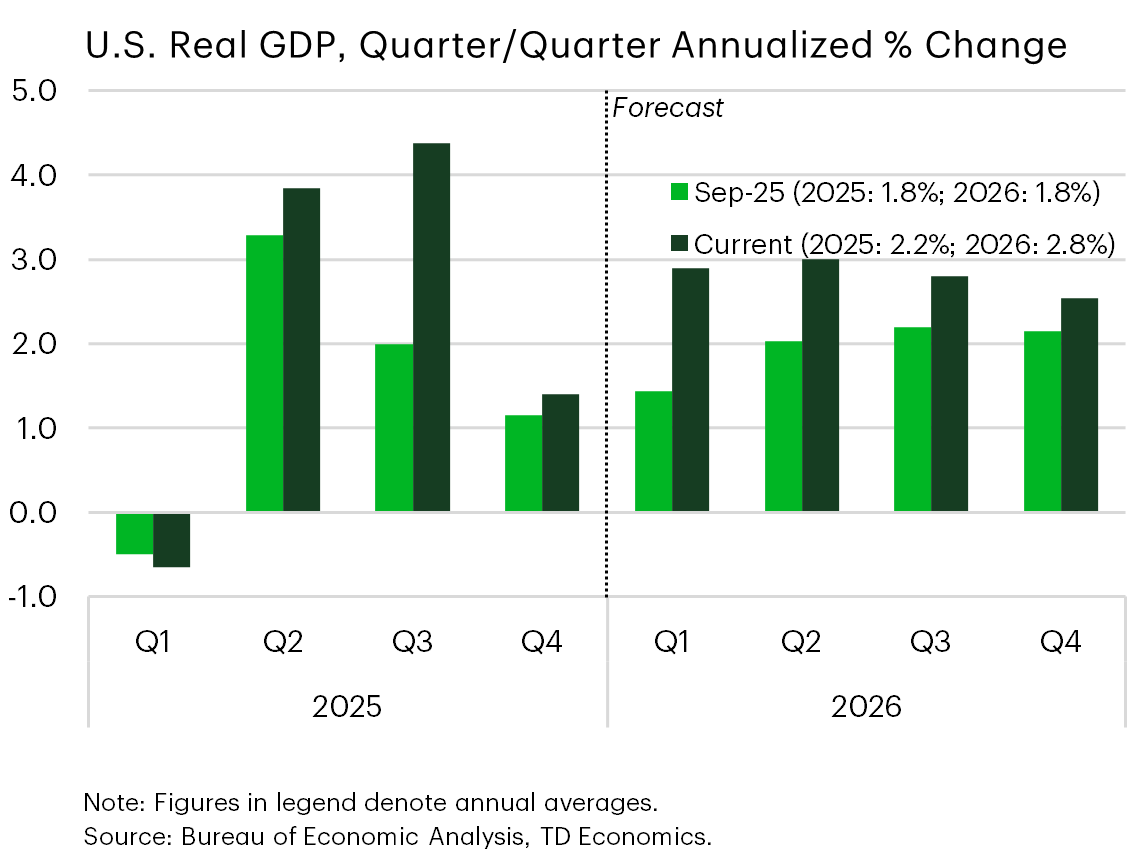
Since our forecast in September, there have been significant upward revisions to the U.S. outlook. The near-3% annual rate expected this year is impressive, and may seem surprising given last week’s fourth-quarter GDP estimate, which came in weaker than expected, at only 1.4%. But most of the undershoot reflected weaker government spending partly due to the shutdown. Stripping that impact away, economic growth came in at a solid 2.5%. Much of the temporary shutdown-related losses will reverse in the first quarter of 2026, leading us to upgrade our estimate closer to 3%.
The two catalysts behind this resilience are stronger AI investments and consumer spending. What’s most impressive is that this is occurring with heightened trade uncertainty and with a fed funds rate that was in restrictive territory for nearly the entirety of last year.
Reason 1: U.S. Dominates AI Investment
So, digging into the details, we’ve been telling this story for some time, but here it is again.
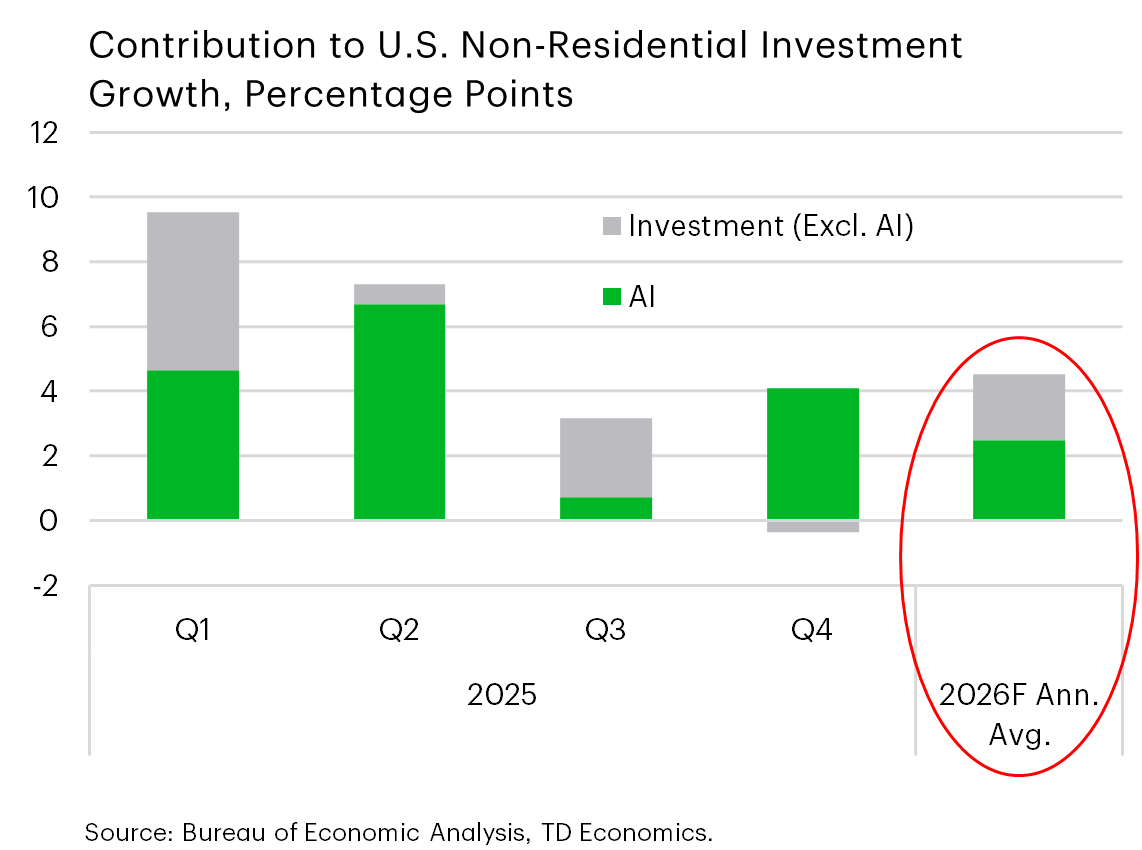
AI is dominating investment in the economy, but now it has a twist. This graph shows the contribution to total investment from AI versus all other types of business investment. AI continued to dominate the investment picture in the fourth quarter, but it appears only a matter of time before we see higher investment from other types of businesses.
As 2026 unfolds, this rotation of investment is embedded into our forecast as a theme, even with ongoing massive hyperscale capex from AI companies, which showed another 30% increase from last year. And that was from just 4 companies - Microsoft, Meta, Alphabet and Amazon.
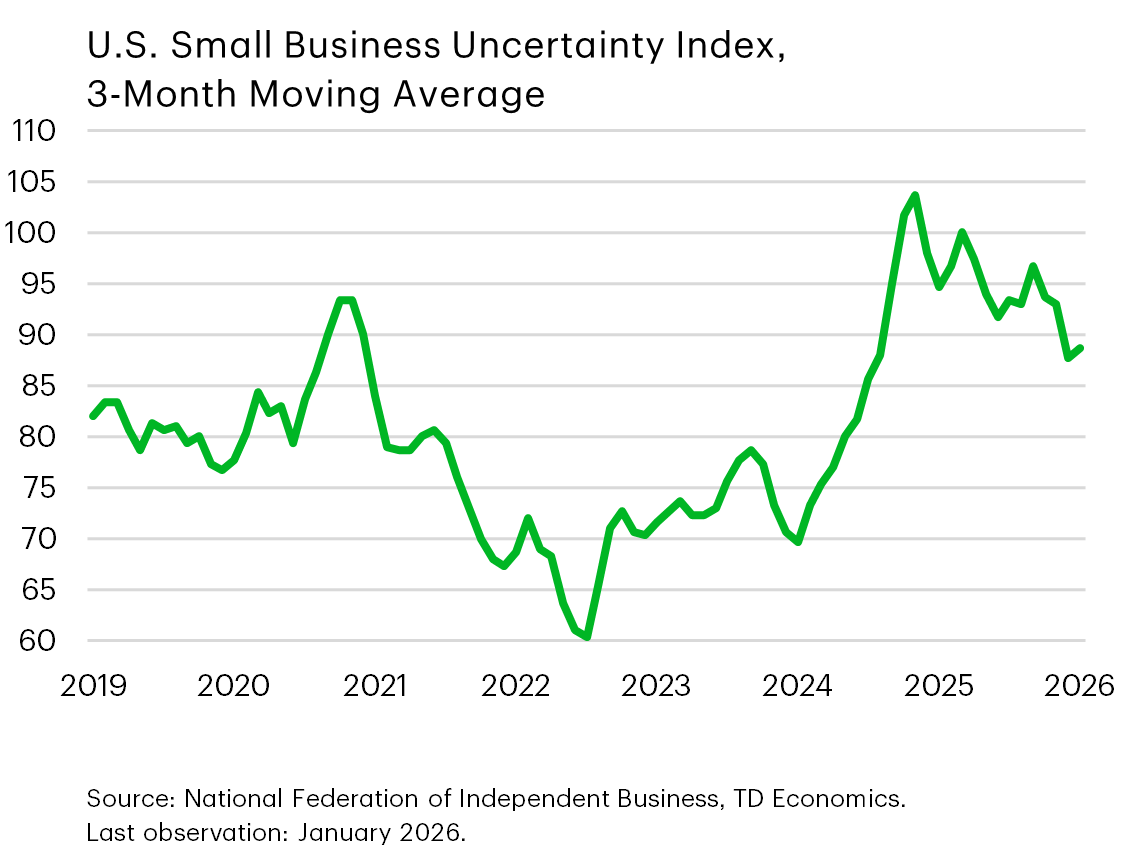
The second graph shows that there’s also a corresponding drop in business uncertainty, even though it remains historically high. We suspect businesses have sat on the sidelines too long and are now learning to navigate through uncertainty. This is substantiated by a Federal Reserve survey that showed an increase in C&I loan demand by small and medium sized businesses, which shot to its highest level since the onset of the tightening cycle.
And then let’s not forget there will also be an investment impulse coming from the OBBB that changed several business provisions including full bonus depreciation on equipment, full expensing for research & development costs, and temporary expensing for manufacturing structures.
Reason 2: U.S. Consumer Spending Proves Resilient
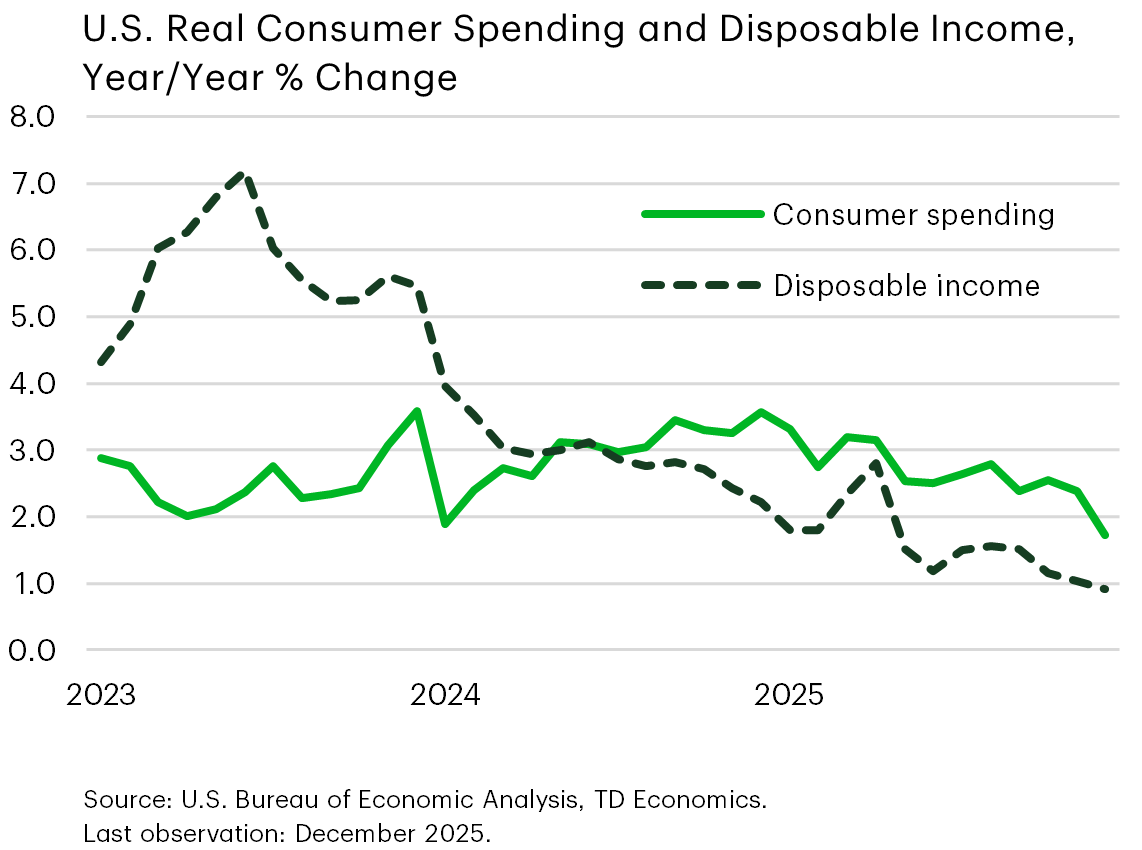
Turning to the other growth-catalyst, it came from a resilient consumer in the second half of 2025 despite weakening after-tax income fundamentals.
This would normally lead us to question its sustainability in 2026, but the income picture is about to get a big boost…
Fiscal Tailwinds Should Sustain Consumer Momentum in 2026
There are two fiscal tailwinds about to hit household pockets from tax changes in the OBBB.
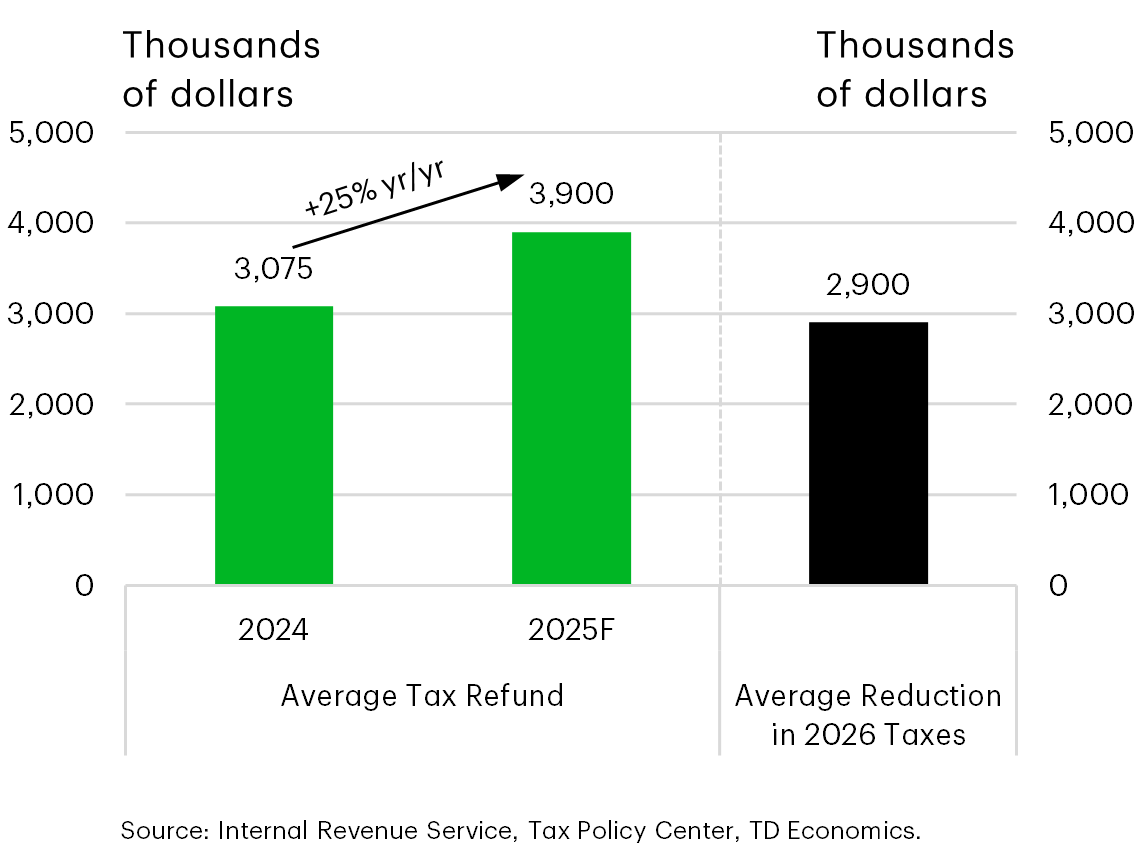
The first is larger tax refunds, which were retroactive through 2025, hitting bank accounts this quarter and next. Because the IRS didn’t update its withholding tables until this year, many will benefit from refunds that will average roughly $900 more per tax-filer relative to last year. The second benefit is on the right side of the graph, showing higher tax-home pay from tax cuts.
The combined effect is expected to lift after-tax incomes by over $200 billion this year. And even though tax breaks skew to higher income households, applying conservative economic multipliers still causes a lift in nationwide consumer spending by several tenths of a percentage point.
Chasing the Forecast
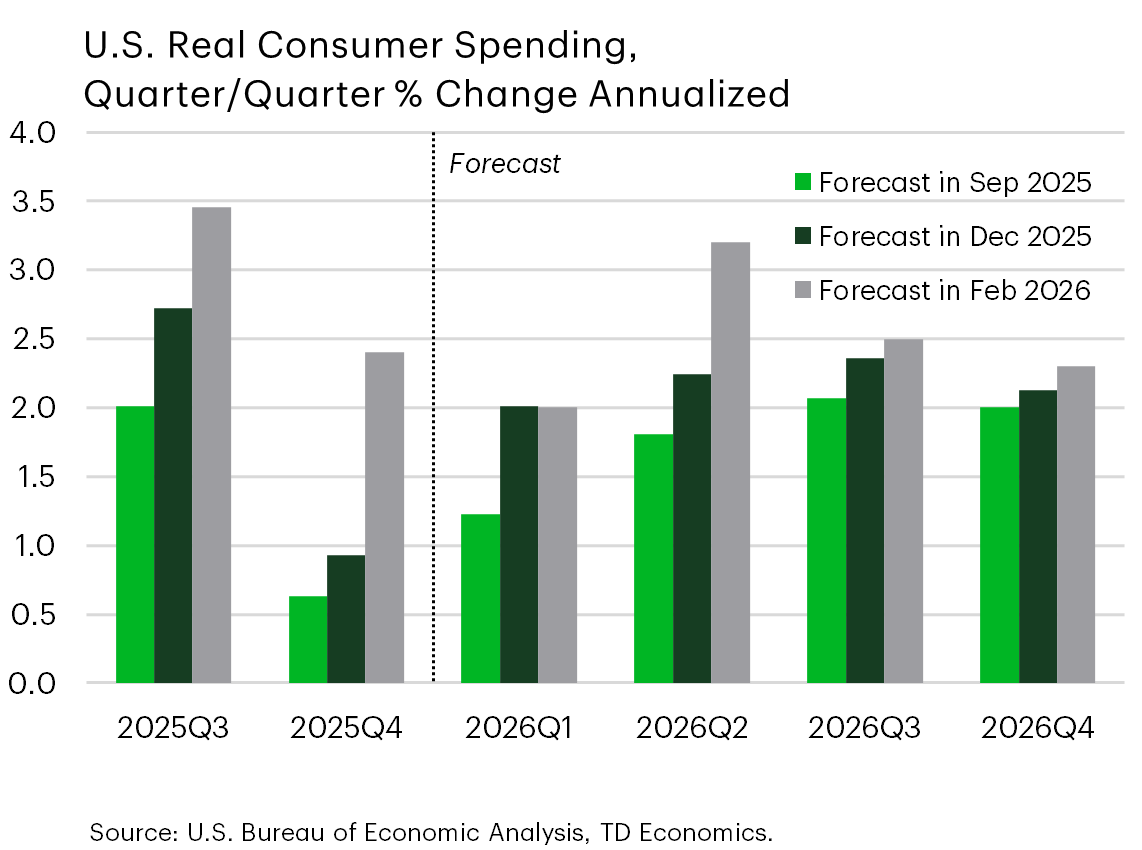
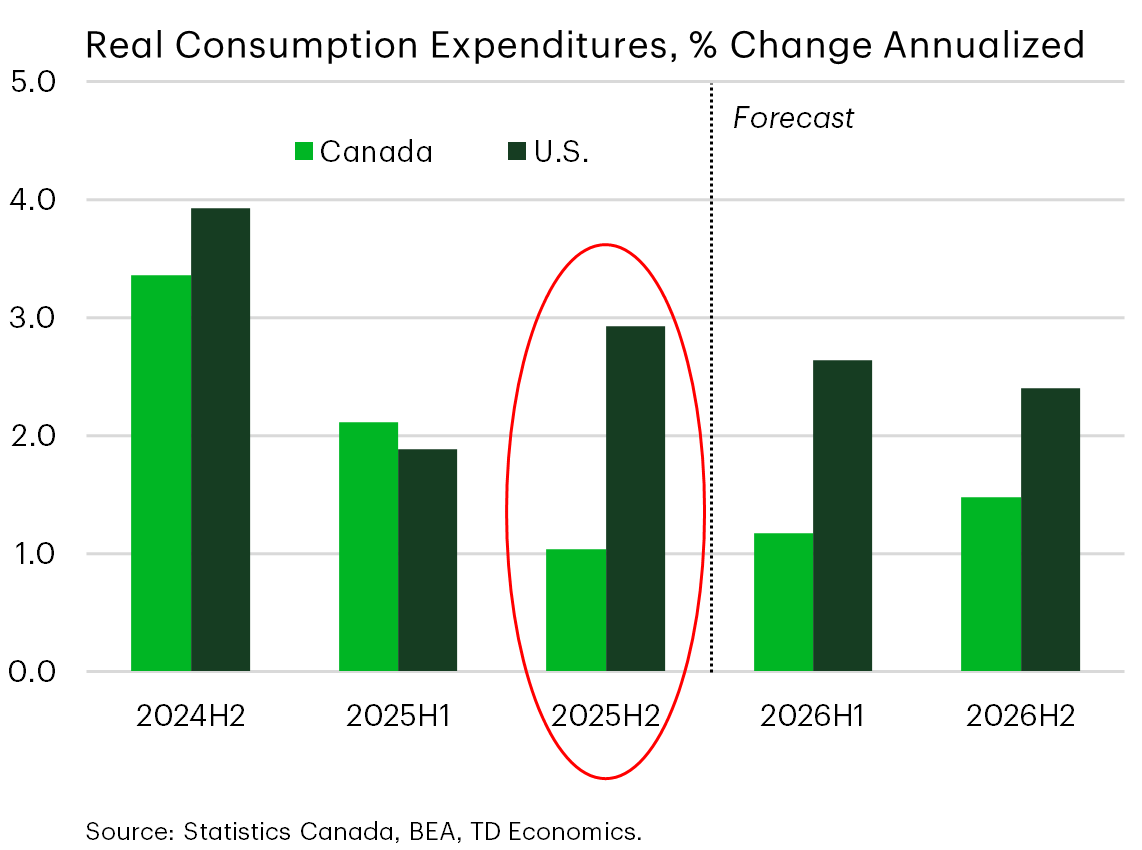
And this is the net result, which I call “chasing a forecast” because we’re getting the direction right, but not the magnitude. Ultimately, households dug into their savings more than expected in the second half of 2025, which helped to power solid consumer spending gains despite the impact of the record long government shutdown. Real consumer spending expectations now sit at 2 1/2% in 2026, relative to our December forecast, which reflected a more trend-like 2%.
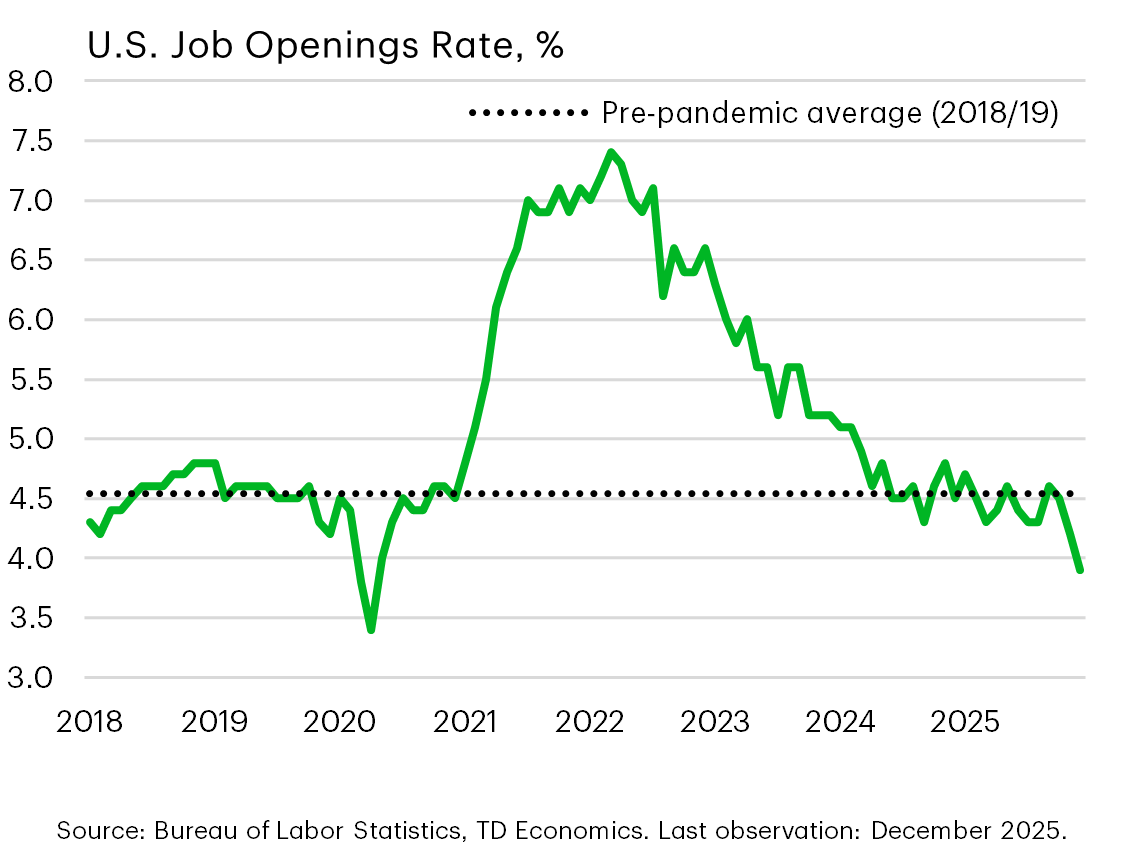
Soft Spots Exist: Cooling U.S. Labor Demand
Now it’s not all sunshine and rainbows. I couldn’t respect myself as an economist if I didn’t deliver some words of caution or bad news.
Starting with the good. January jobs data were double market consensus at 130,000 new positions, with an unemployment rate that ticked down to 4.3%. That’s all good. But it’s superficial to leave it there.
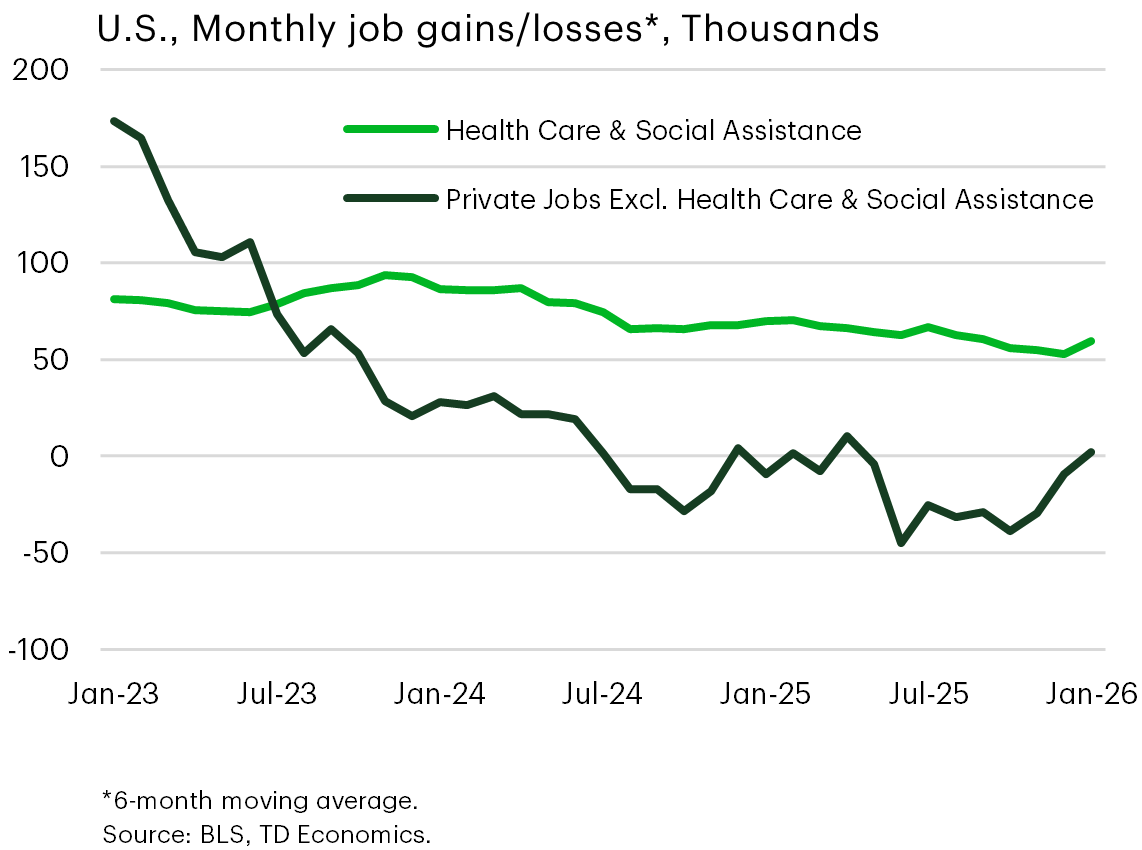
A collapse in job openings suggests the prospect for more big surprises is limited unless this turns around. And, when we look under the hood of that January jobs report, it reveals demand is largely centered in a single sector – health and social assistance. This long-standing theme is now starting to get challenged, with is shown by the uptrend in the dark line, but it needs to be substantiated with more time and conviction.
Canadian Economy Not Sharing in the Upside
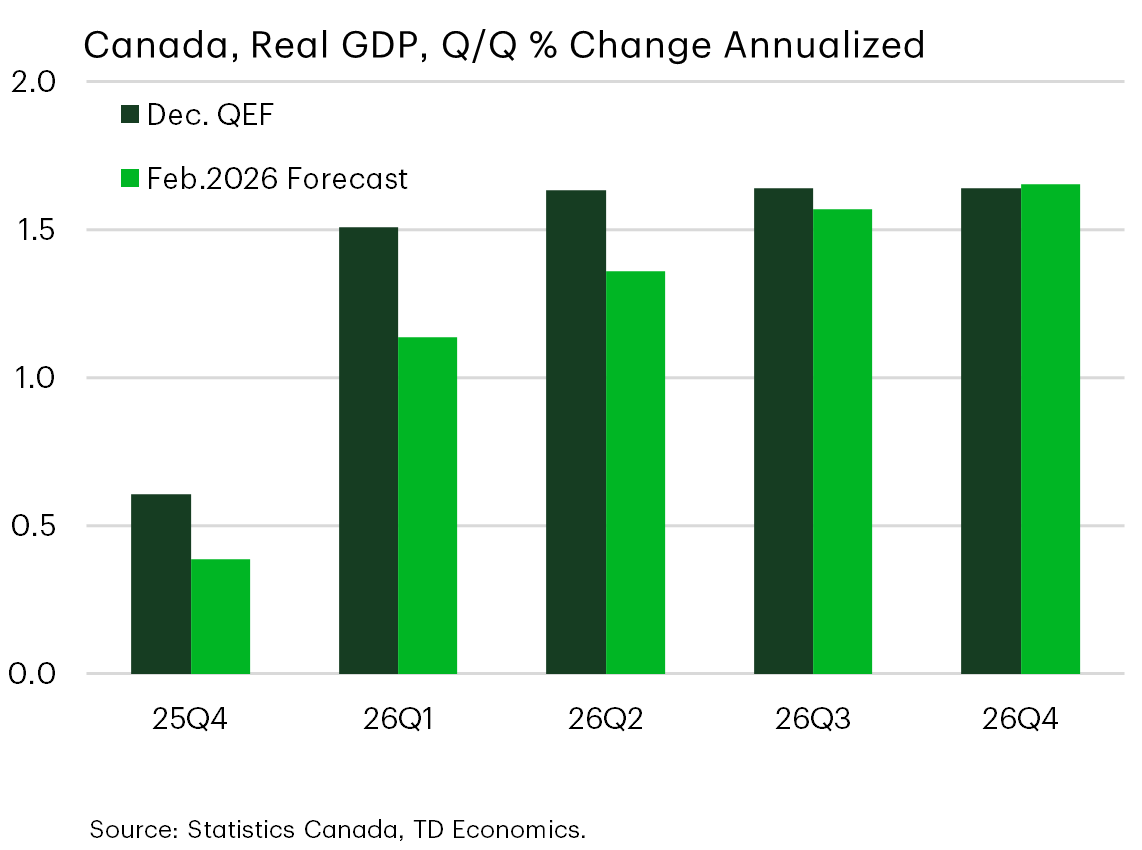
Turning to the Canadian economy, where forecast changes are relatively minor but have gone in the other direction compared to the U.S.
2025 ended with a thud, and the lower starting point has pulled down the near-term outlooks. The catalysts on the downgrade are coming from three areas:
- The housing market, where demand completely stalled out.
- Consumer spending, which showed similar dynamics.
- And, unlike the U.S., trade uncertainty continues to wear on Canadian business investment.
We hope this latter point is reaching the low water mark as government programs and investment announcements gain footing in the back half of this year.
Putting the pieces together, we anticipate another sub-par year with growth of 1.4% in 2025, on a Q4/Q4 basis. This demonstrates a momentum improvement from last year’s 0.8% pace, but still captures a highly restrained economy.
And of course, when it comes to CUSMA, we’ve made no heroic assumptions in the absence of information. We hold all current tariff rates imposed by the U.S. on Canada as constant and assume those sheltered within CUSMA continue to remain so. Naturally this is a total wildcard in the forecast.
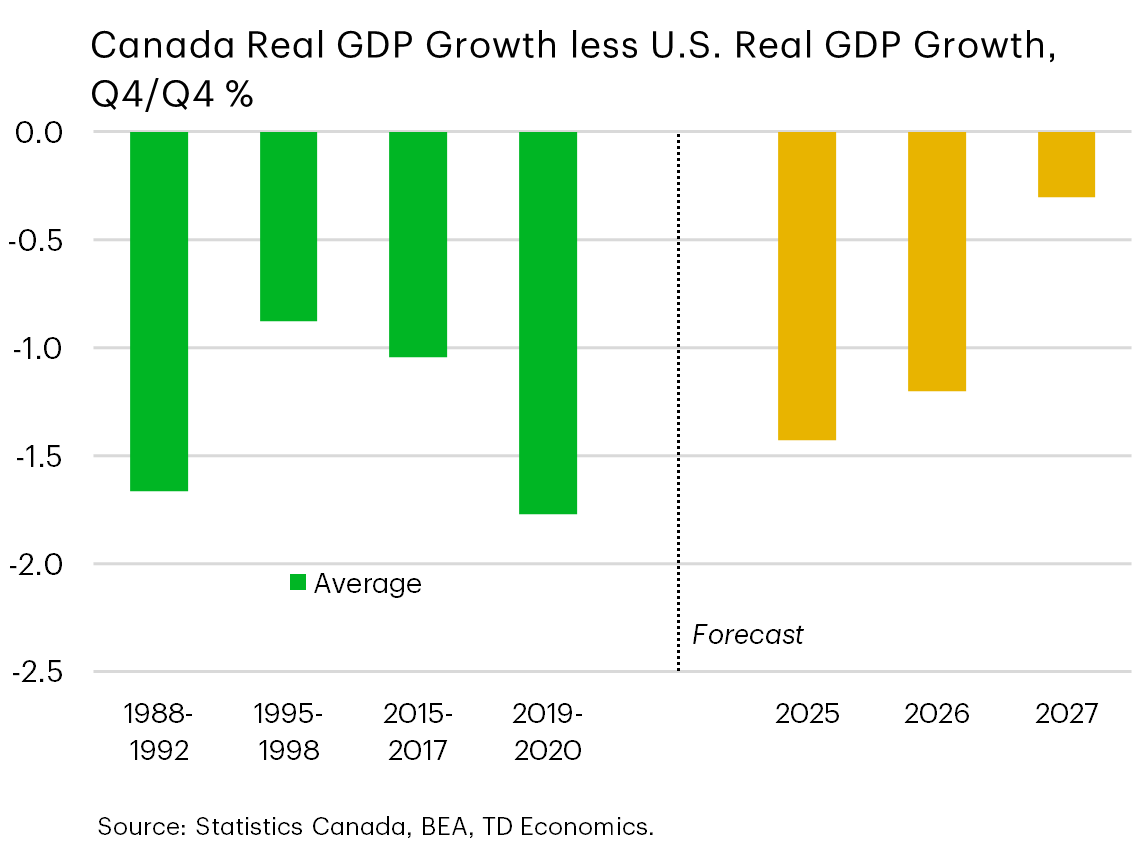
Canada’s Momentum Falls Further Behind the U.S.
Let’s take a look at how Canada stacks up to the U.S. on relative economic performance by starting with the historical context of periods that coincide with deep or sustained underperformance by Canada.
The two deepest declines were in the late 1980s and 2020, both reflecting idiosyncratic factors. The first period was coined the Great Canadian Slump, coinciding with a central bank trying to gain inflation credibility with crippling high interest rates. The U.S. economy did not experience this. And the 2020 period captures COVID when Canadian provinces were more aggressive on imposing economic shutdowns relative to the American states. The shallower two periods in between capture the tech boom where the U.S. led on economic growth and a commodity slump in 2015-2017 that left Canada more exposed.
The right side of the graph shows how Canada compares today.
If we are too optimistic on the 2026 outlook, we will certainly hew more closely to the 1988-1992 period for a second time. The historical gap tends to average at about 30 basis points, because a key factor that helps Canada climb out of the growth-gap is the trade relationship with the U.S., which is obviously stifled this time around. The narrowing of the growth gap in 2027 presumes the U.S. slows down from its 3% pace this year, rather than Canada climbing closer to that performance.
Canadian Consumers No Longer An Upside Catalyst
Looking more closely under the hood reveals a Canadian consumer that managed to slightly outperform its American counterpart in the first half of last year. This gap was initially reported much larger, but U.S. revisions to the data altered that narrative. Even so, it was an impressive performance by Canadians hit by peak trade uncertainty, and maybe speaks to the effectiveness of the “elbows-up” campaign that promoted spending dollars at home.
That momentum slipped away in the second half of this year despite incomes continuing to rise and a savings rate at 4.7%, which is higher than the pre-pandemic average. So Canadian households still have gas in the tank, but they’re using it more conservatively. This supports some improvement as the year unfolds, but the forecast is biased towards caution given CUSMA remains unresolved and we don’t know which way that’ll break in impacting confidence.
There are some helping hands from government initiatives, like the recently announced expanded GST tax subsidy for groceries that kicks in more fully by mid-year. But ultimately, Canadians don’t have the big tax impulses feeding through like in the U.S. to boost income and confidence nationwide. Nor are we recommending this because the focus needs to be on using government finances to promote business competitiveness.
Homebuyers Hit an Air Pocket After Strong Momentum
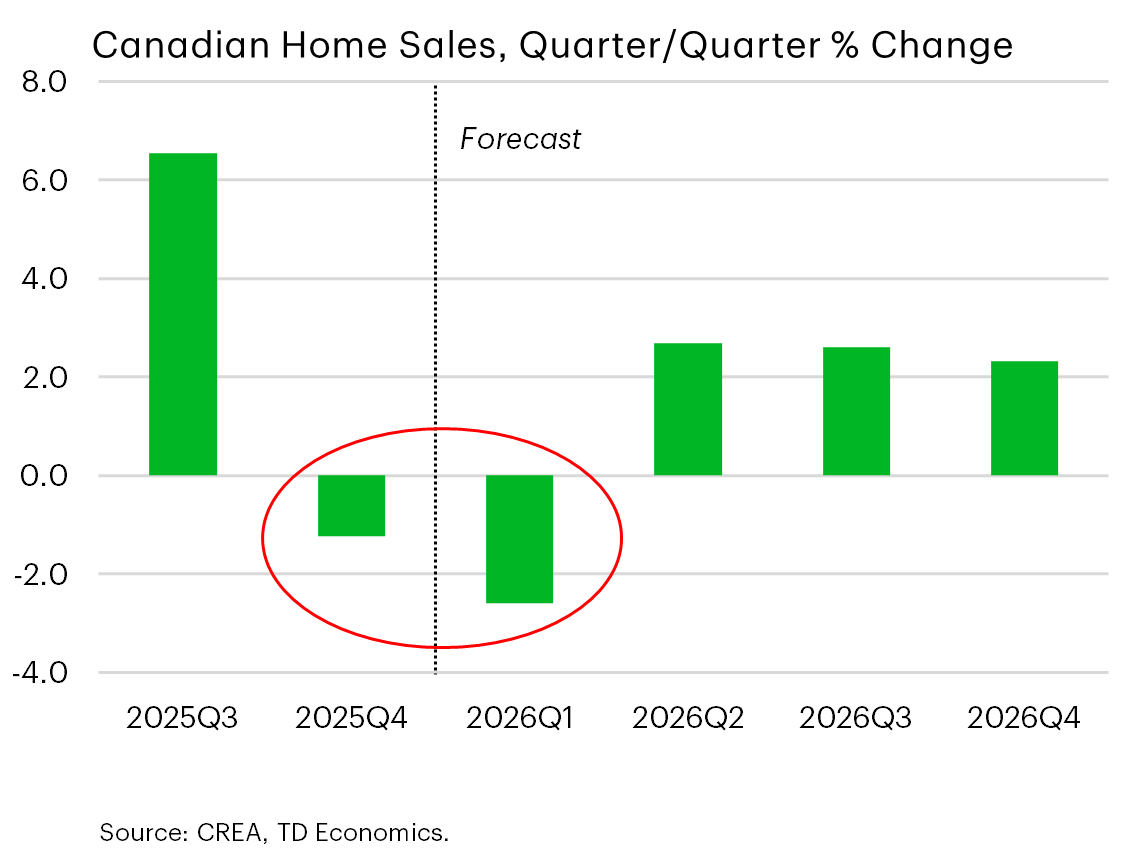
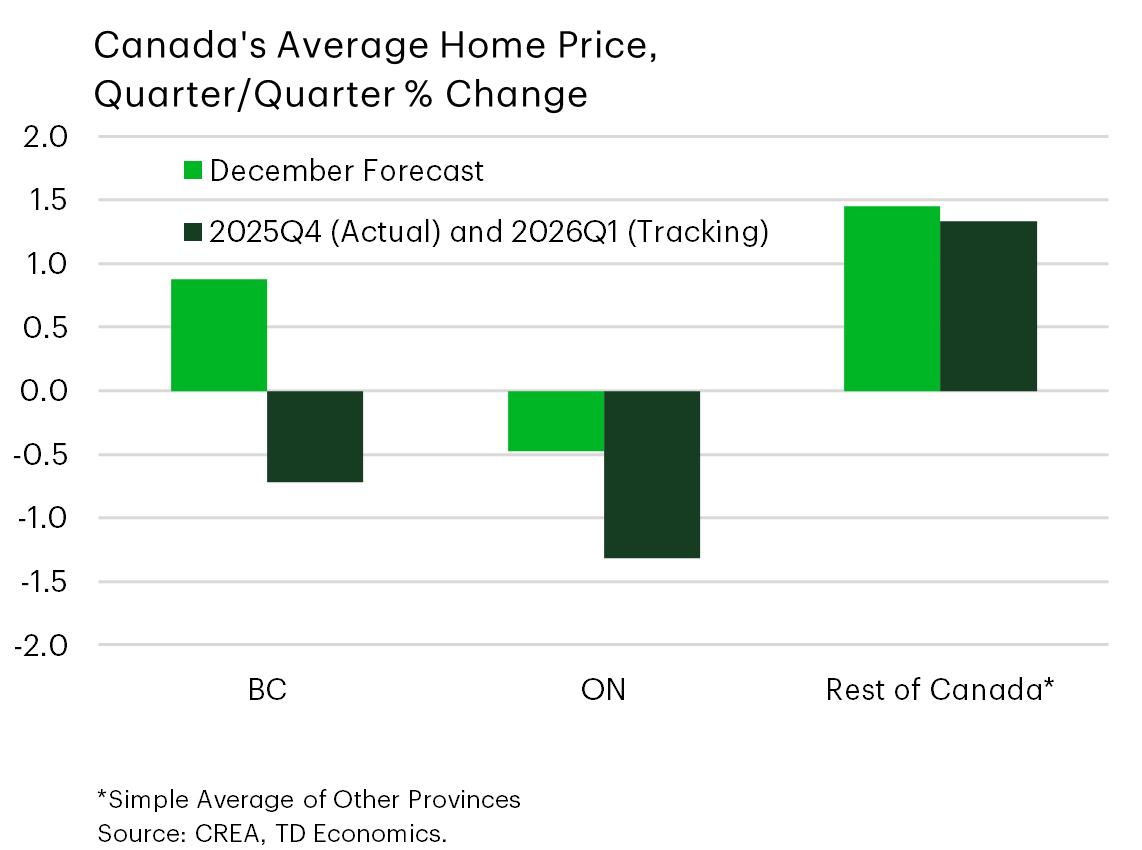
Turning to the housing market, this graph shows precisely how much demand suddenly stalled out, with weakness concentrated in BC and Ontario.
There were some one-time factors, like crippling January winter storms in Ontario. But building in a partial rebound still leads to an overall downgrade in the 2026 outlook. Canadian average home price growth is likely to be closer to 1% rather than the 4% we expected in the December outlook, with tumbling condo prices being the main weight in BC and Ontario.
The overarching message is that it’s reasonable to expect a gradual and modest recovery due to some pent-up demand, but we can’t dismiss the headwinds created by high supply in both those provinces, as well as a nationwide slowdown in population growth and the expectation of a softer labour market.
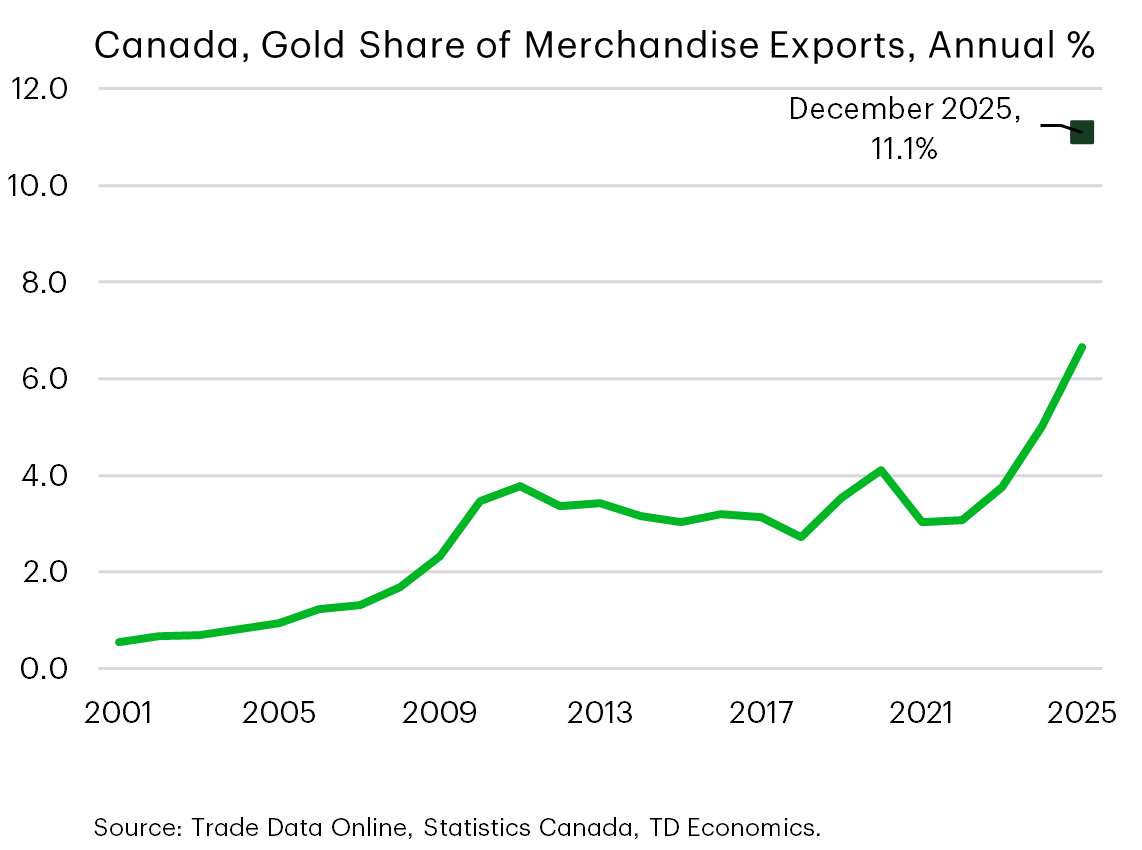
1a. Higher Gold Prices Propped Up Canadian Exports
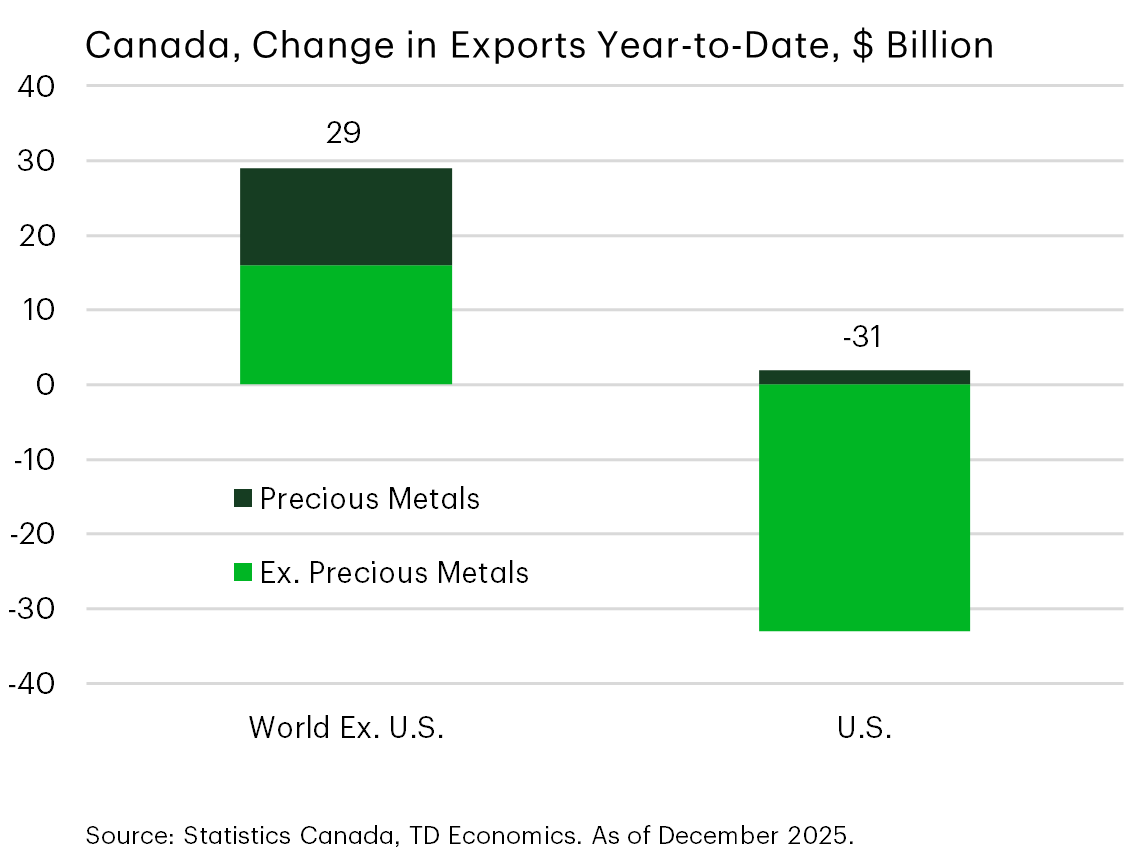
Switching gears to factors that fall into the good-news camp for Canada, there is early evidence of success in the rotation of exports away from the U.S.
However, it comes with a caveat of a high concentration in gold exports. This leaves Canada exposed to a price correction and doesn’t really speak to sustainable demand growth. Gold was responsible for one-third of Canada’s non-US export growth. Gold exports went from representing around 3% of total Canadian exports, to averaging 8% over the year. The latest trade data for December showed a further rise to 11%.
However, we’ll take what we can get, particularly given it’s very early days on export rotation and on hitting the reset button within the industrial landscape. Canada did succeed in replacing almost all of the $25 billion loss in U.S. exports with shipments to other markets.
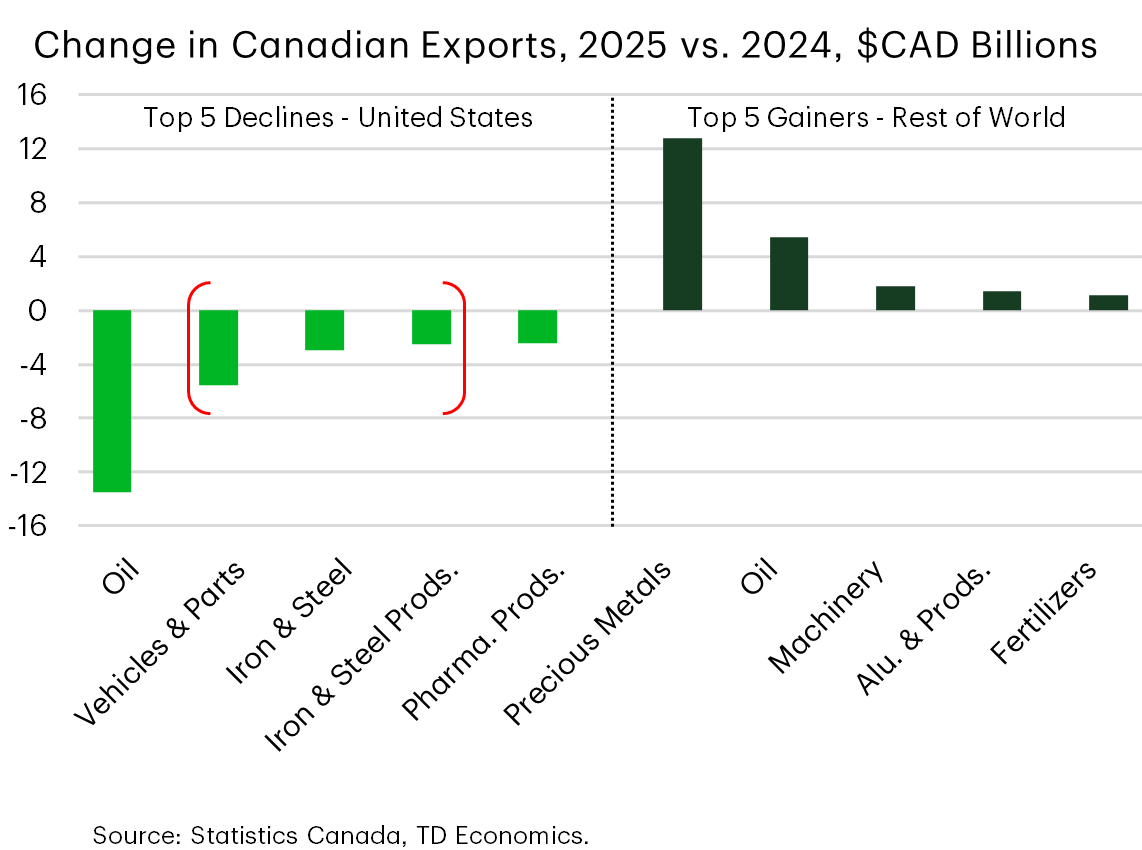
1b. Canada Has Taken Strides to Diversify Its Export Portfolio
The trade economy, however, is reconfiguring across industries in a manner that’s creating winners and losers.
The loss of exports to the U.S. is heavily embedded within sectors facing section 232 tariffs. Vehicles and parts not under CUSMA face a 25% tariff, while iron and steel are at 50%. Oil represents almost half of the lost shipments to the U.S., but this is mostly related to temporary shutdowns in refineries and lower prices impacting the nominal value of shipments.
On the right of the graph is where shipments have risen to non-US markets. A couple things stand out. The first is that there’s little-to-no overlap between the industries that are winners and losers. So the loss of production and jobs in Ontario’s steel industry creates a mismatch to the benefits going to gold production in that province.
The second point is that, up until now, diversification has mainly involved selling existing products. It speaks to the importance of Canada building investment and capacity to leverage other areas of strength such as critical minerals, mining, and agriculture, which also helps gain access to more trading partners. And this needs to be complemented with increased export capacity at ports, rail lines, and other infrastructure. As an example, oil and LNG shipments to Asia and Europe rose by a massive 25%. But sustaining that growth depends on whether pipeline and export capacity can be scaled up. The same is true elsewhere.
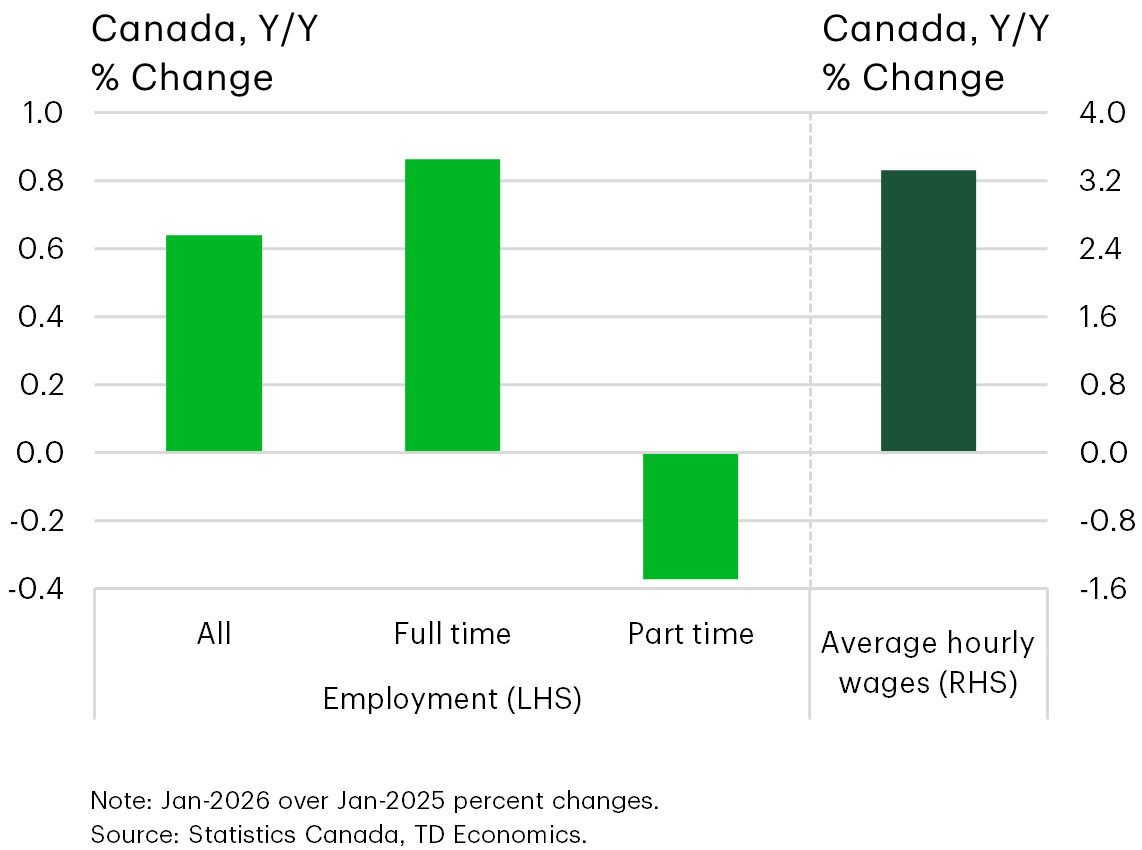
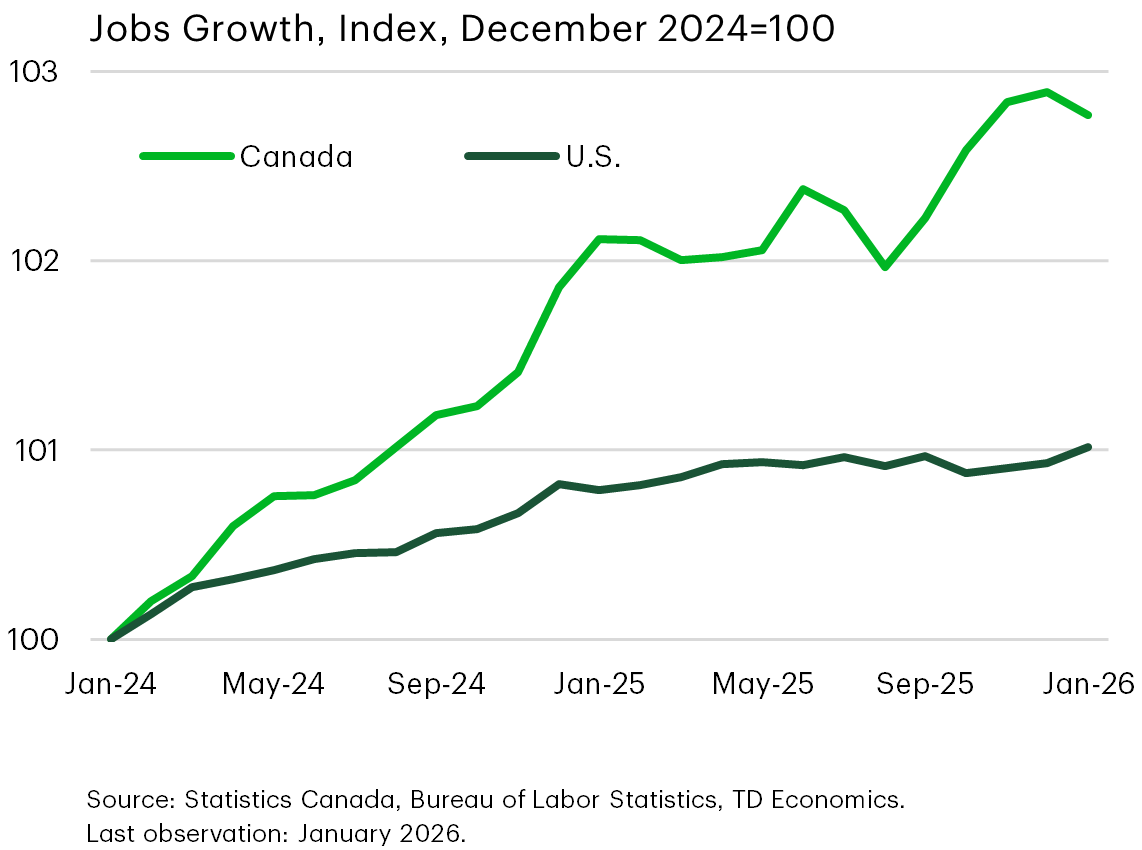
2. Canada’s Job Market Not Capitulating
The second factor working in Canada’s favour is the job market.
Even though jobs contracted by 25K in January, this graph shows the longer-term context with data that is highly susceptible to month-to-month volatility. First off, that loss of jobs in January came after a string of big gains that resulted in 165,000 net new jobs over five months.
Second, as this graph shows, hiring has shifted to full-time jobs, and this was even true in January. These jobs offer greater income strength and stability, with the benefits flowing to wages. Wages are growing just over 3%, which is outstripping inflation.
And third, relative to the job market performance of the US, Canada has been an outperformer. To be frank, the pull back in January came later than we expected because the degree of job strength seemed divorced from the economic fundamentals. And by extension, while the U.S. is experiencing large productivity gains, Canada is not.
This is a long-standing story for Canada to have an over-reliance on labour. However, one reason we might be seeing it this time around is because labour might be the safer and cheaper bet to respond to production demand in the near term, when the investment environment is riddled with uncertainty.
That doesn’t make it sustainable, however, and it’s one reason why we think labor demand will be flatter this year, with some rotation to investment with government programs from last year’s budget lending a helping hand.
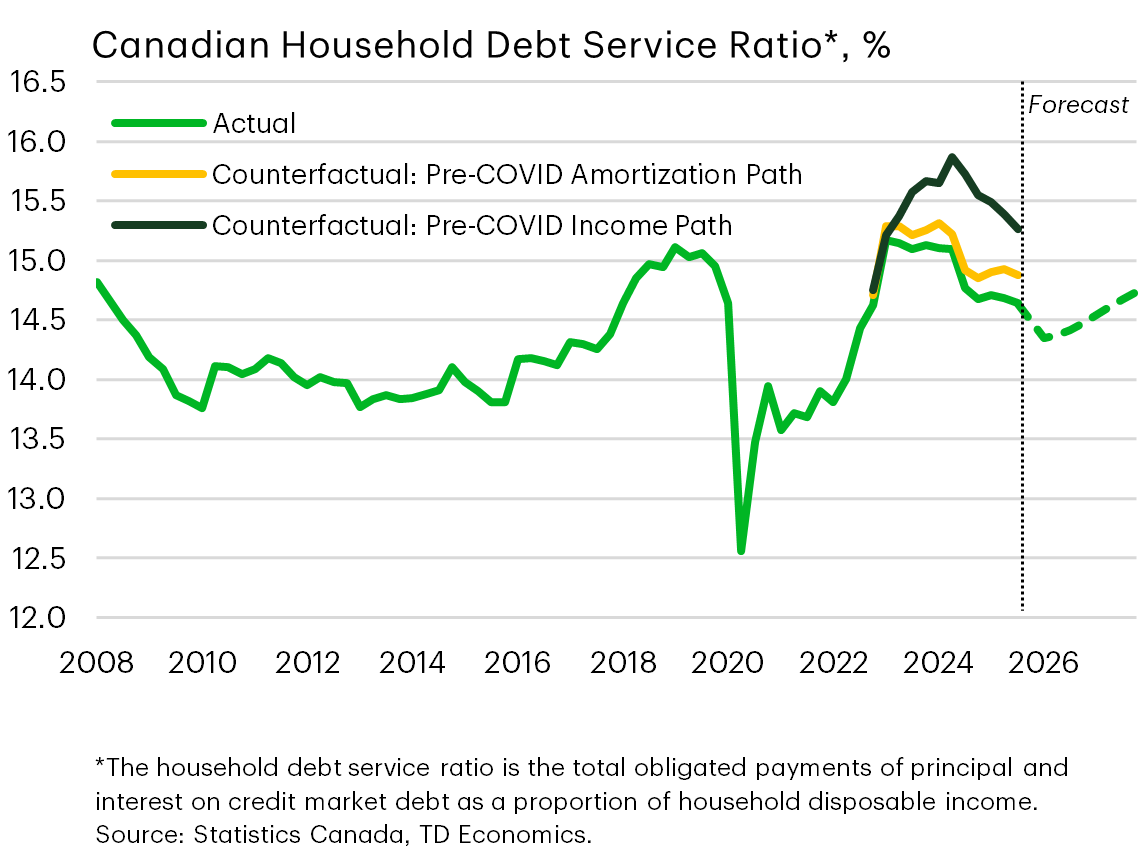
3. Income Growth and Longer Amortizations Blunt Mortgage Renewal Shock
A final element worth noting in the “win camp” for Canada is the successful navigation of the mortgage renewal cliff, that has turned into looking like a hill.
One worry we had around consumer spending was that it would be held back by higher payments from mortgages originated at rock-bottom pandemic interest rates renewing at higher prevailing rates. The Bank of Canada flagged that 15% of mortgage renewals this year could see payment increases, as high as 20%, depending on whether they adjust their amortization length.
However, there’s more going on beneath the surface.
The debt service ratio (DSR) for the economy is below its recent highs in 2023, suggesting the worst risk-period has already passed. This lower DSR exists because of healthy income growth and longer amortizations, which were stretched to about 16 months longer than before the pandemic. The gold line in the graph reflects the counterfactual estimate on the DSR had amortizations not lengthened.
But of the two influences mitigating a payment shock, the more important has been stronger after-tax income growth. Over the past three years, it has grown two percentage points faster than in the three years preceding the pandemic. Had income growth instead tracked that pace, the debt service ratio would have peaked about one percentage point higher, which is shown by the dark line in the graph.
In the near term, there’s more downside for the DSR, but it will erode again once prices gain more momentum next year. And assuming there’s not another down-leg on interest rates, which we don’t think realistic.
Summary
A middling performance is expected by Canada, but there is some good news with success in trade rotation and households having dry powder to spend if they’re confident in doing so. In this environment, the outlook is not weak enough to compel further rate cuts by the Bank of Canada.
We think they’re on hold at 2.25% unless there’s a material and sustained deterioration in the job market that’s accompanied with an unemployment rate that breaches well above 7%. I’m thinking around 7.5% from the current level of 6.8%. Keep in mind that the Canadian unemployment rate is volatile compared to its U.S. counterpart. If we get to 7.5% without significant and sustained job losses, the Bank of Canada won’t feel compelled to respond immediately.
As for the U.S., it’s steady as she goes. The economy has a good underbelly on a combination of investment and consumer spending, with a tax tailwind coming in. The inflation outlook risks upside in the near term if further tariff pass-through occurs. But since Trump is doing a course correction in some areas, this helps build the case for two more rate cuts once Kevin Warsh is in seat as the Chair, presuming his appointment is approved by mid-year.
In a nutshell, our rate views for both countries haven’t changed from last quarter and, so far, is consistent with market pricing.
DisclaimerThis report is provided by TD Economics. It is for informational and educational purposes only as of the date of writing, and may not be appropriate for other purposes. The views and opinions expressed may change at any time based on market or other conditions and may not come to pass. This material is not intended to be relied upon as investment advice or recommendations, does not constitute a solicitation to buy or sell securities and should not be considered specific legal, investment or tax advice. The report does not provide material information about the business and affairs of TD Bank Group and the members of TD Economics are not spokespersons for TD Bank Group with respect to its business and affairs. The information contained in this report has been drawn from sources believed to be reliable, but is not guaranteed to be accurate or complete. This report contains economic analysis and views, including about future economic and financial markets performance. These are based on certain assumptions and other factors, and are subject to inherent risks and uncertainties. The actual outcome may be materially different. The Toronto-Dominion Bank and its affiliates and related entities that comprise the TD Bank Group are not liable for any errors or omissions in the information, analysis or views contained in this report, or for any loss or damage suffered.
Download
Share this: