The Canadian Equity Market
Outperformance in Context
Andrew Foran, Economist | 416-350-8927
Matt Palucci, Economic Analyst
Date Published: August 31, 2026
Category: Canada Financial Markets
Highlights
- The TSX has outperformed the S&P 500 by roughly 17 percentage points since February 2025, marking its longest sustained relative advance in nearly two decades.
- The advance reflects the TSX’s heavy concentration in financials, materials, and energy, where strong returns have outweighed its limited exposure to the U.S.-led technology cycle.
- The durability of the TSX’s outperformance remains uncertain and will depend largely on commodity prices and the evolution of the U.S.-led AI investment cycle.
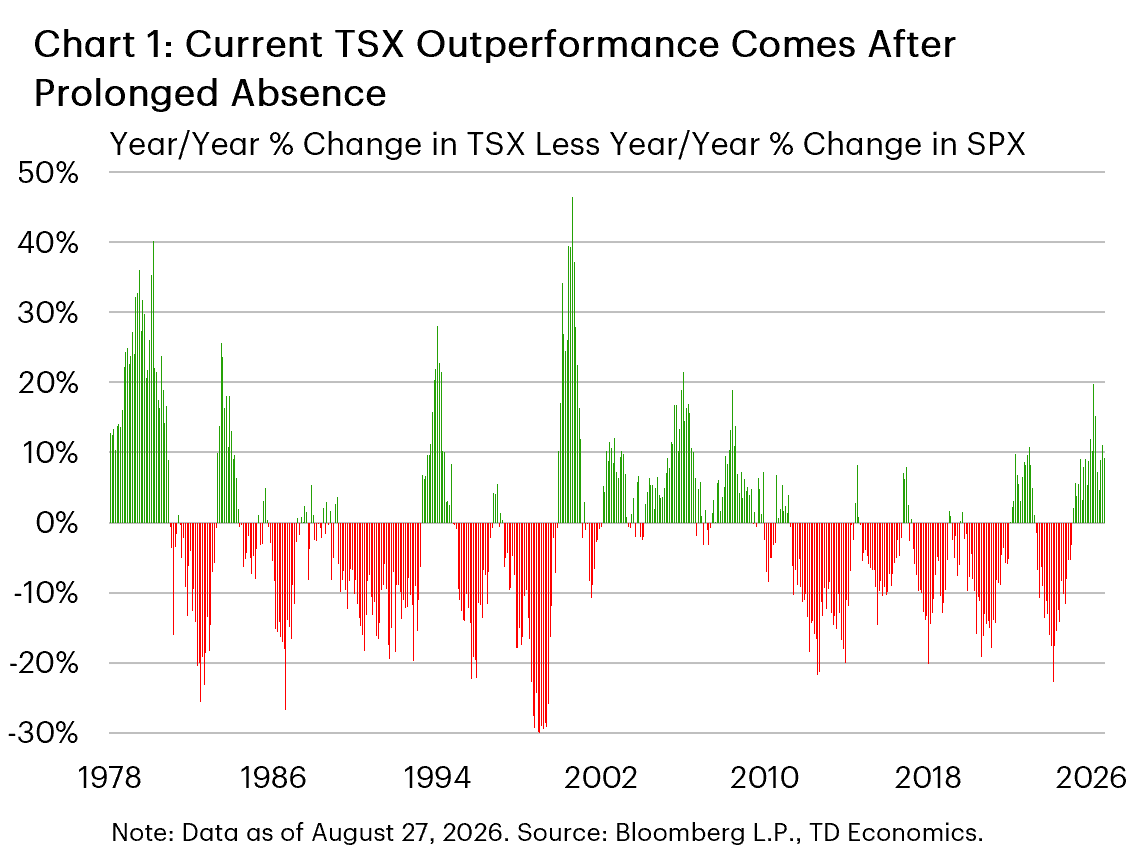
The Toronto Stock Exchange composite index (TSX) has experienced its longest period of sustained outperformance relative to the S&P 500 (SPX) in nearly two decades (Chart 1). The cumulative gain in the TSX since the end of February 2025 has been just under 47%, versus the SPX return of 29%. This outperformance has occurred even as trade policy uncertainty clouds Canada’s economic outlook and U.S. equity markets continue to be bolstered by AI-related investments.
It also marks a major turn from the status quo. Historically, the SPX has maintained an average annual return advantage of roughly 2 percentage points relative to the TSX. This difference holds when comparing total returns as well, which incorporate dividend payments in the calculation. This raises the question of what factors are driving the current divergence and whether they are temporary or structural.
Historical TSX Outperformance Linked to Commodity Cycles
Historically, prolonged episodes of the TSX outperforming the SPX, defined as a positive difference in year-on-year growth between the two indexes, have not been random. Of the 5 longest episodes over the past fifty years in which the TSX outperformed the SPX, nearly all of them have been linked either to a strong commodity cycle or relative underperformance of the U.S. economy, typically tied to a major recession (Table 1).
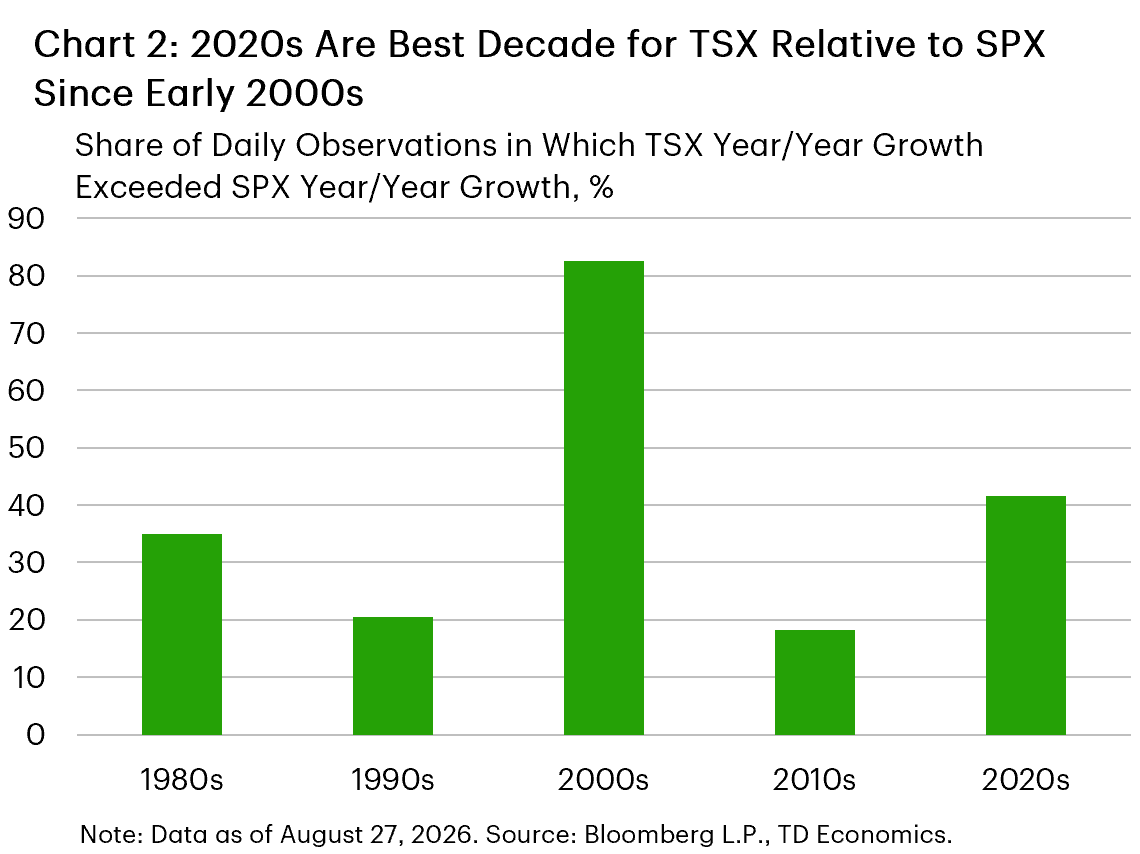
The current outperformance cycle, which began in February 2025 and has lasted for nearly 550 days thus far, is soon to be the third longest episode going back 50 years. The two longest episodes of outperformance occurred between 2004 and 2009, as oil prices nearly doubled between 2004 and 2006, and then doubled again between 2007 and 2008. Cumulatively, this led to the 2000-2010 period being the best decade for the TSX relative to the SPX (Chart 2).
The early 2000s were the best decade in recent history for the TSX relative to the SPX, as the period included a commodity super cycle in oil prices in addition to two recessions that were broadly concentrated in the U.S. The 1990s and 2010s were worse for the TSX owing to strong tech growth in the U.S. and declining commodity prices. The 2020s have been a renaissance period for commodity prices, with gold prices rising sharply and two positive oil price shocks in the span of 4 years. From this data, a clear pattern arises with respect to the factors that typically lead to an outperformance in the TSX.
Using a simple weighted index comprised of oil prices, gold prices, and the inverse performance of the Dow Jones Internet Composite Index, we are able to explain a substantial share of the variation in relative TSX performance over the past three decades. Excluding major market dislocations (2001, 2008, and 2020), the correlation between the constructed index and the TSX less SPX year-over-year performance is equal to 0.71. Note that a correlation of 1 would mean both series move in unison. The result suggests that a relatively small number of factors, namely commodity prices and U.S. technology leadership, account for much of the historical variation in relative equity market performance. Interestingly, gold prices exhibited the strongest correlation with TSX outperformance over the full sample period, while the correlation with oil prices declined notably after 2010. Part of this decline likely reflects the reduced importance of the energy sector within the TSX following a decade of weaker energy sector performance, but it may also reflect the growing role of the U.S. as a major energy producer and exporter, reducing the extent to which higher oil prices disproportionately benefit Canadian equities.
Table 1: Five Longest Episodes of TSX Outperformance Relative to the S&P 500
| Start Date | End Date | Consecutive Days of TSX Outperformance |
Driver |
| Sep '04 | Sep '06 | 734 | Commodity Prices (Oil) |
| Sep '07 | Jun '09 | 650 | Commodity Prices (Oil) & U.S. Financial Crisis |
| Apr '93 | Oct '94 | 554 | Early Cycle Recovery |
| Feb '25 | Present | 548 | Commodity Prices (Gold & Oil) |
| Dec '99 | Feb '01 | 438 | U.S. Technology Correction |
What’s Driving the Current TSX Outperformance Cycle?
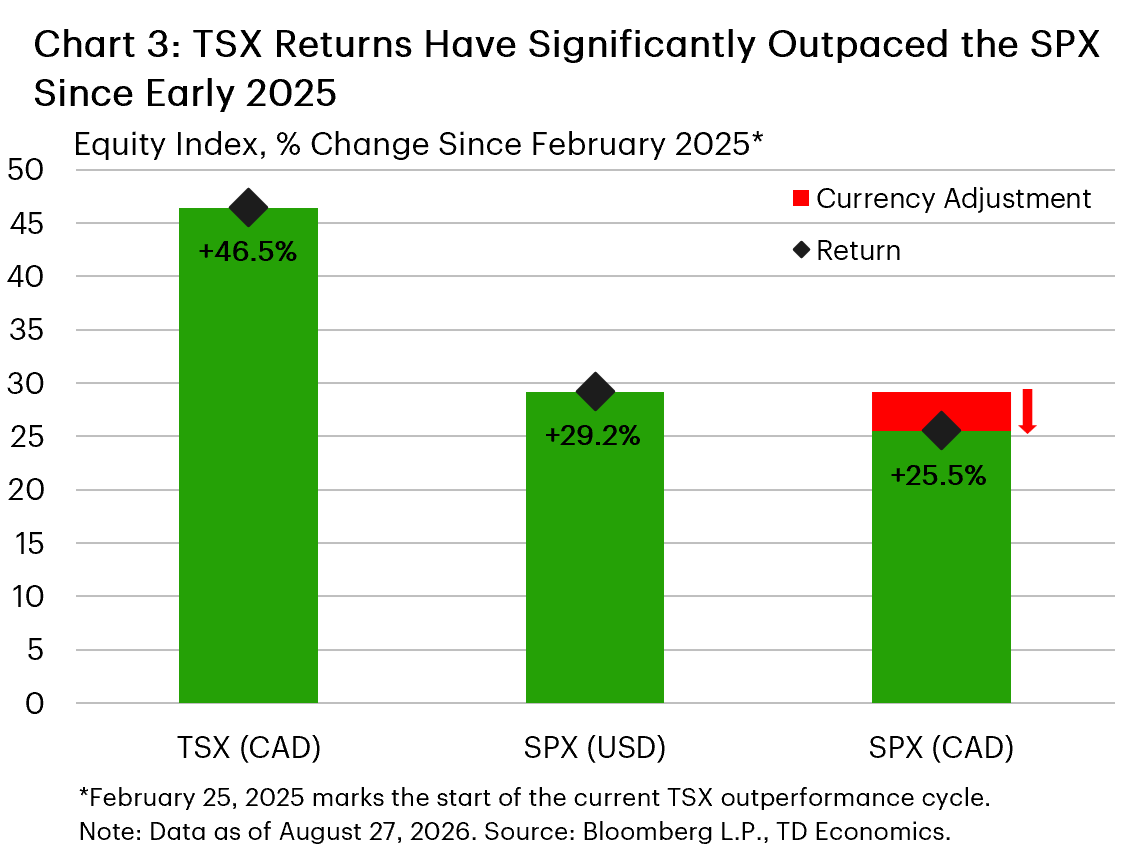
The TSX has climbed by nearly 47% since the current outperformance cycle began, beating the SPX by an impressive 17 percentage points. The gap widens further after adjusting for currency differences, as a stronger loonie over the reference period trims the SPX’s gain to just 25% in Canadian dollar terms, expanding the TSX’s lead to nearly 21 percentage points (Chart 3). If sustained through year-end, this would mark the first time since the Global Financial Crisis that Canada’s benchmark equity index delivered stronger returns than its U.S. counterpart in consecutive calendar years.
Beneath the aggregate indexes, a sector-level comparison reveals that the TSX has outperformed the SPX across six of the eleven major sector groups, driven largely by commodity price strength and resilient domestically oriented industries (Chart 4).
The materials sector has been the TSX’s top-performing sub-index, rising nearly 120% and exceeding the gain in its SPX equivalent by an eye-popping 98 percentage points. The sub-index is dominated by gold mining companies, whose share prices have soared alongside the historic rally in bullion. A more recent commodity price shock has provided an additional boost to TSX outperformance, with the U.S.-Iran conflict pushing oil prices to their highest levels since Russia’s invasion of Ukraine in 2022. Canada’s major oil producers have benefitted from higher prices while remaining insulated from the supply disruptions behind them, helping lift the TSX energy sub-index 30% year-to-date and build on the sector’s solid gains from 2025.
Several other industries have emerged as key drivers of Canada’s equity market outperformance as well, led by the financial sector. The TSX financials sub-index, which includes Canada’s largest lenders, insurers, and asset managers, has advanced more than 55% since early 2025, far outpacing the 14% gain in its SPX equivalent. Canada’s “Big Six” banks have accounted for the bulk of this increase, with shares surging by an average of 75% on resilient credit conditions, robust trading/capital markets revenue, and their reputation for stability during periods of economic uncertainty. The consumer discretionary and consumer staples sectors have also outperformed, with returns exceeding those of the corresponding SPX sub-indexes by an average of 18 percentage points. Gains in both sectors have likely been supported by lower borrowing costs, targeted federal transfers to households, and a “Buy Canadian” shift in consumer spending preferences.
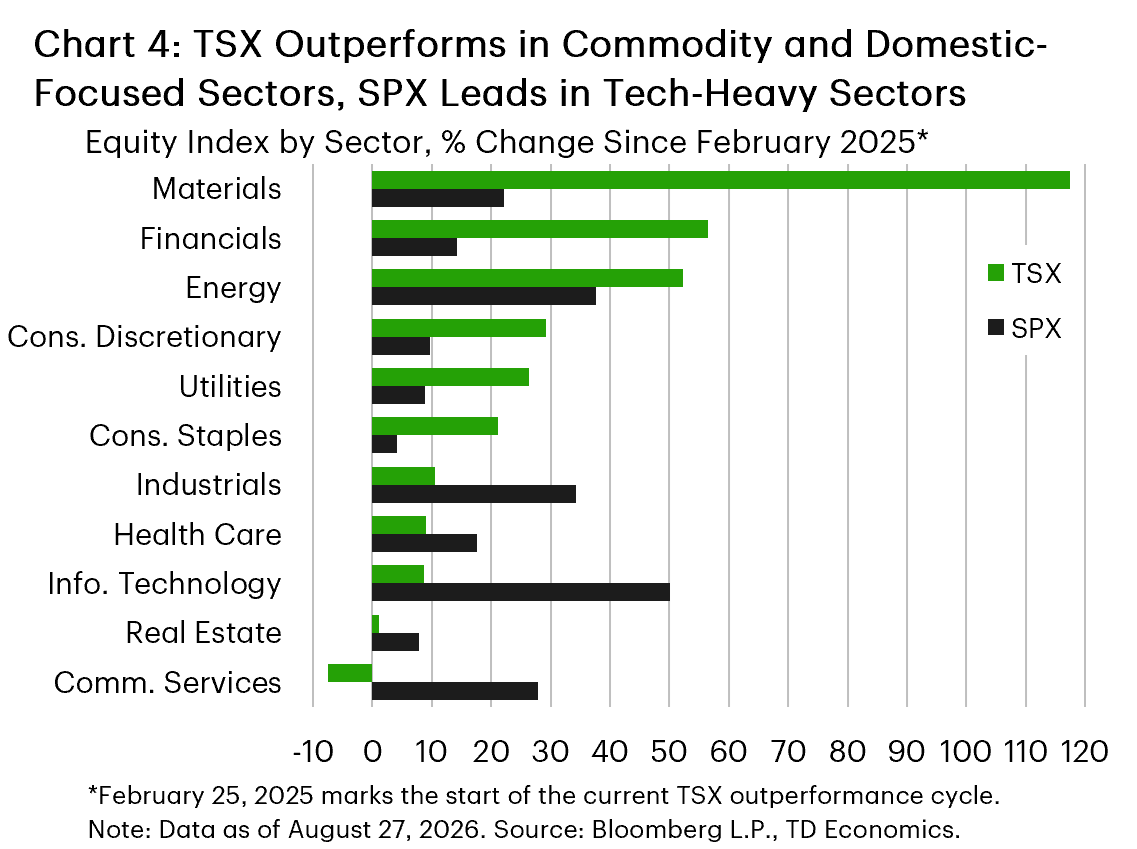
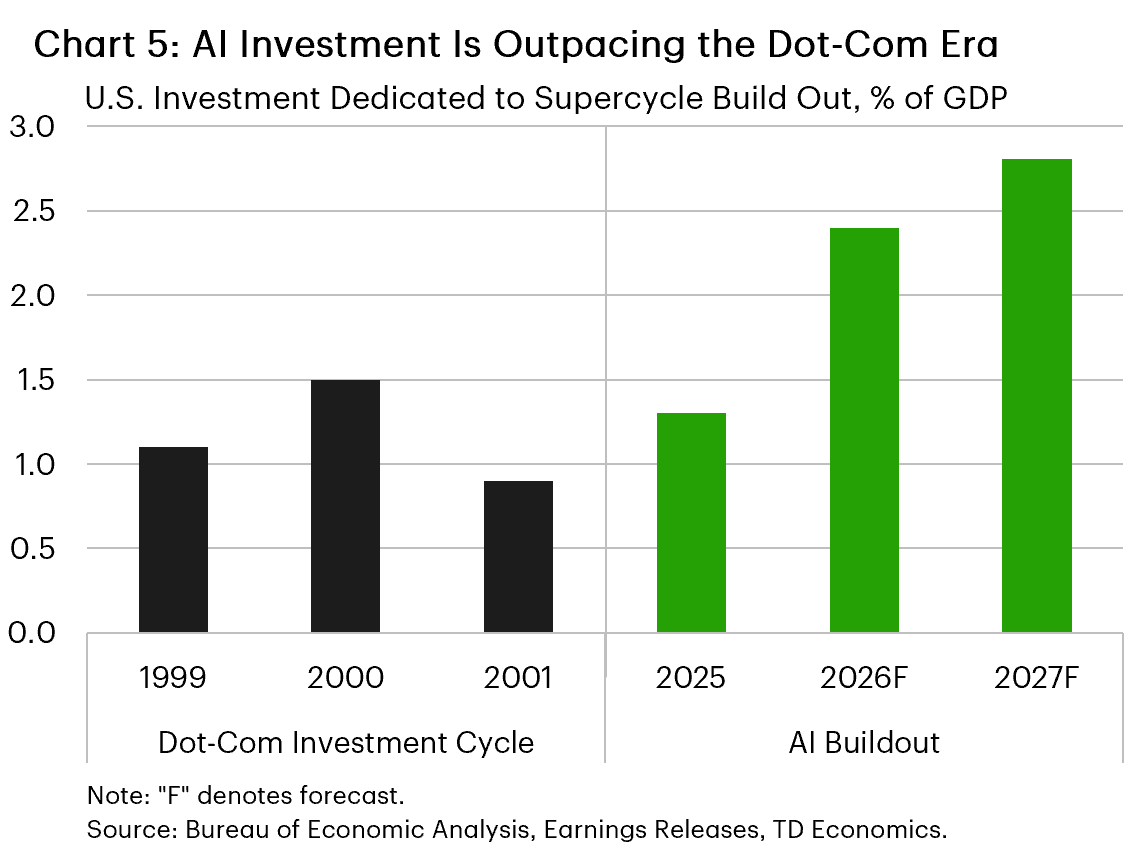
The sector-level breakdown also reveals where Canadian equities have lagged, and it is here that the current TSX outperformance cycle departs from historical precedent. The U.S. is at the forefront of a corporate capital spending boom that eclipses the late 1990s “dot-com” era, with leading tech firms committing vast sums to fund the AI infrastructure buildout (Chart 5). That spending has flowed directly into share prices, fueling outsized gains among companies closely tied to the buildout. Not only have the SPX information technology and communication services sub-indexes (home to the AI “hyperscalers” and large semiconductor firms) significantly outperformed their TSX equivalents, but both sectors rank among the weakest-performing within the TSX as well.
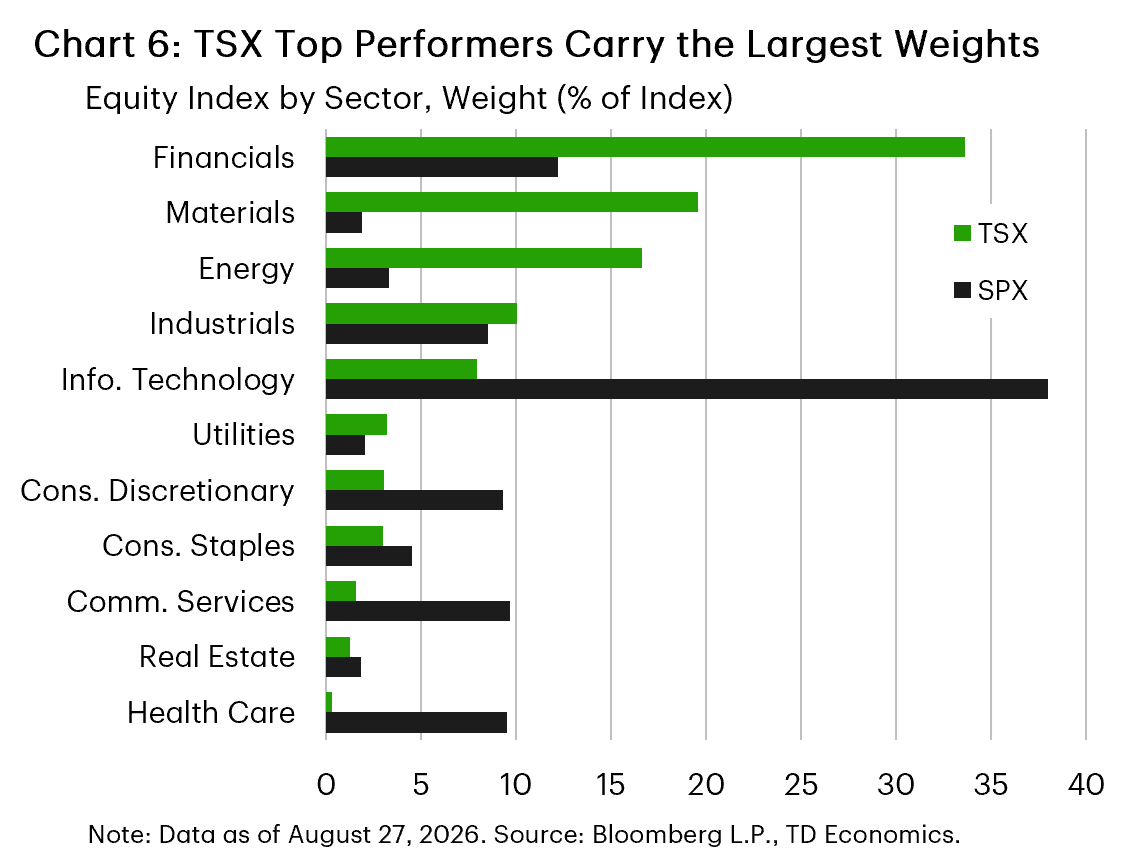
Still, relative sector performance tells only half the story. What ultimately determines a sector’s impact on aggregate index returns is the weight assigned to it. A large move in a small sector barely registers, while a modest move in a dominant one can meaningfully shift an index. This is where the TSX’s ability to outperform the SPX comes into focus. Since February 2025, the TSX’s three best performing sectors are also its three largest, collectively accounting for nearly 70% of the entire index (Chart 6). The SPX’s top three performing sectors, by contrast, represent less than half of the index, leaving its winners with less influence on overall returns. The same dynamic explains why decisive U.S. leadership in the tech-heavy sectors has not been enough to close the gap. While the information technology and communication services sectors make up close to 50% of the SPX index, they represent less than 10% of the TSX, largely insulating Canada’s benchmark from the weakness in its own technology names.
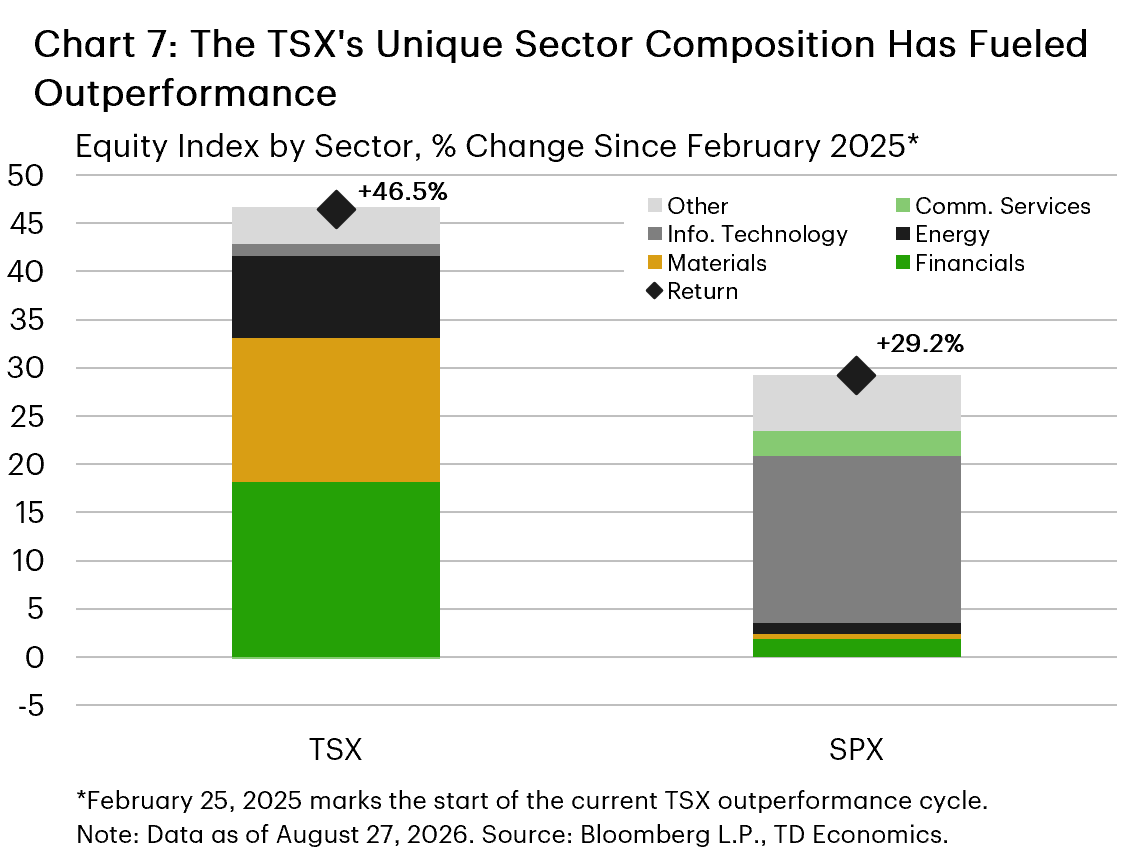
Scaling each sector’s return by its index weight provides a clear read on what drove performance across both markets (Chart 7). In Canada, financials, materials, and energy account for nearly all the TSX’s gain since early 2025, an unsurprising result given that these sectors pair the largest weights with the strongest returns. In the U.S., tech-related sectors did the heavy lifting, though the gains were not sizable enough to keep pace with the TSX. Canada’s equity market outperformance comes down to a story of composition. The TSX holds unique and outsized positions in precisely the sectors that have outperformed this cycle, and those positions have been large enough to offset the drag from its limited technology exposure.
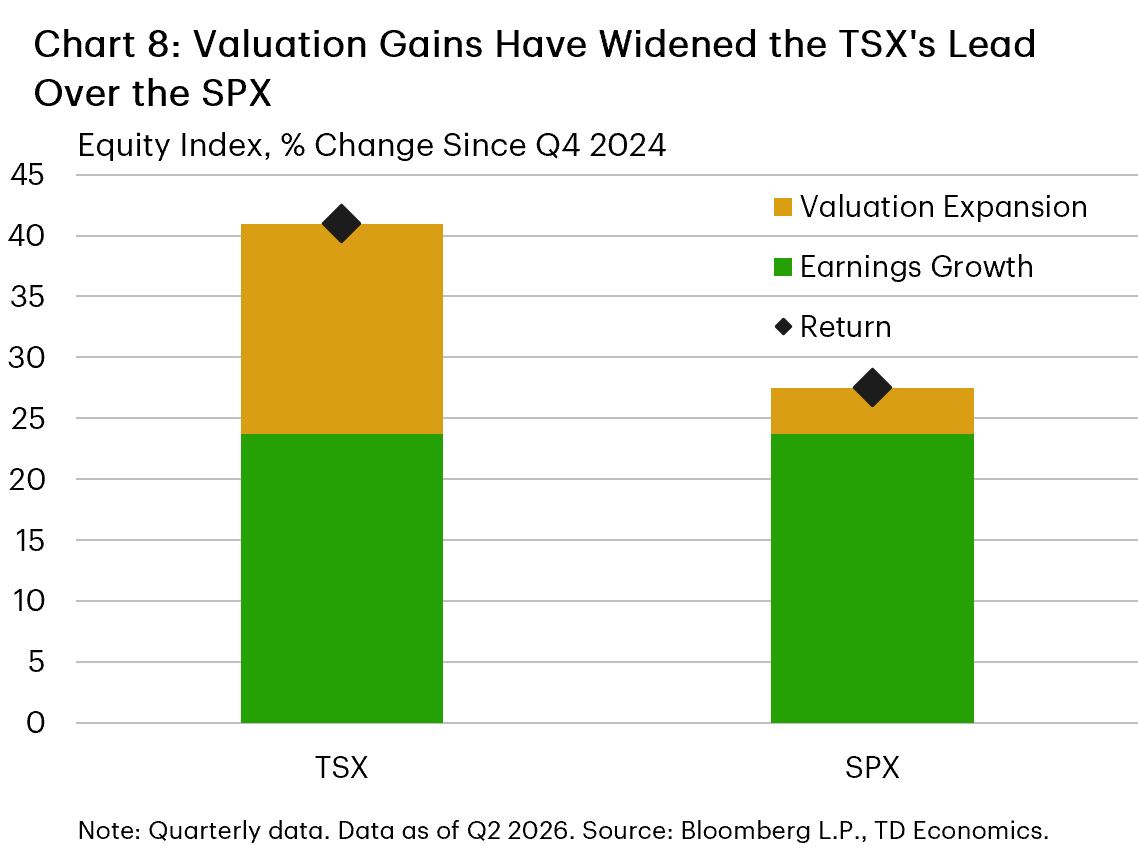
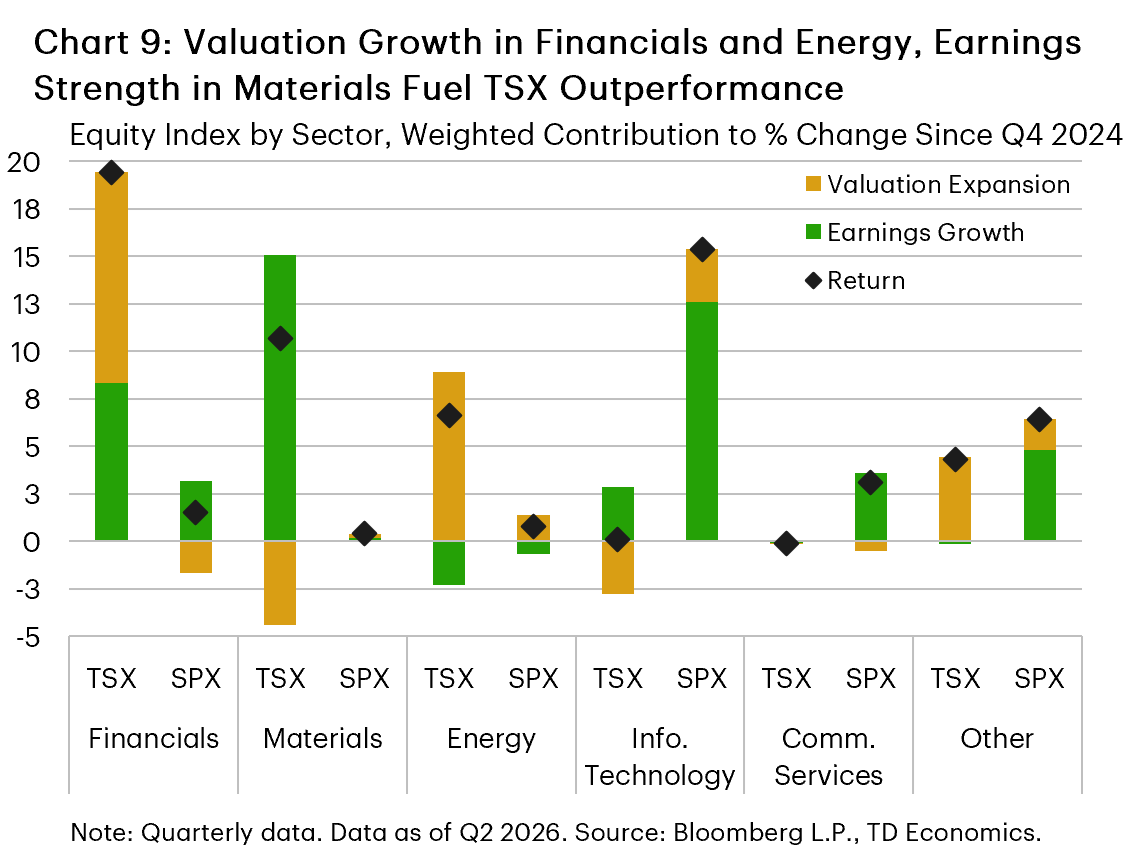
When comparing the relative performance of the two indexes, it is clear that TSX outperformance over the past six quarters has reflected comparable earnings growth alongside materially stronger valuation expansion (Chart 8). Within the TSX, financials benefitted roughly equally from earnings growth and valuation expansion, while gains in the energy sector were entirely attributable to higher valuations (Chart 9). Note that energy prices declined through most of the cumulative reference period which weighs on the contribution from earnings in the energy sector. In contrast, materials derived their gains entirely from earnings growth, with valuation adjustments acting as a modest drag on the sector’s overall contribution to aggregate index returns. For the SPX, index gains were primarily driven by earnings growth in the information technology and communication services sectors, with modest valuation adjustments across most other sectors.
How Long Can the TSX Outperformance Persist?
The answer to whether the TSX outperformance can be sustained depends on the evolution of the factors currently driving it. The historical advantage of the SPX relative to the TSX has largely been driven by the structural trends associated with the confluence of the growing influence of technology in society and the concentration of companies providing technological goods and services in the U.S. In contrast, the Canadian equity market has remained concentrated in traditional sectors like commodities and financials. These dynamics allow the TSX to outperform during traditional economic shocks, like commodity booms and geopolitical events. The past 2 years have seen no shortage of these shocks, but their ultimate duration remains unknown.
Historically, commodity prices fluctuate in cycles, with pronounced price appreciation typically followed by a period of mean reversion. Gold appeared to be in the midst of such a reversal through the first half of 2026 but subsequently recorded a sharp appreciation in August as U.S. economic data for July came in softer than expected, reducing expectations for monetary policy tightening. This ascent in gold prices was further bolstered by the U.S. Treasury Department announcement that it would be doubling its buybacks of longer-dated Treasuries just as the national debt surpassed $40 trillion. Persistent concerns about fiscal deficits internationally combined with heightened geopolitical tensions could lead to more durability in gold prices than otherwise expected.
In contrast to gold, oil prices started the year near multi-year lows, but jumped by roughly 50% after the onset of the conflict in Iran. Prices have fluctuated in the interim, as the U.S. and Iran have oscillated between temporary ceasefire agreements and escalation. With the Strait of Hormuz remaining largely unnavigable, it is possible that the current energy supply shock could also prove to be more durable than expected.
Non-commodity factors are likely to take on a greater role if the commodity cycles wane, which structurally advantages the SPX over the TSX. However, with roughly half of the SPX accounted for by AI-related companies, much of this will depend on the evolution of AI adoption and monetization. Upside scenarios could lead to a profound outperformance of the SPX relative to the TSX, while the inverse scenario, if it included a material correction in AI equities, could prolong the TSX outperformance. Despite significant integration of the Canadian and U.S. economies, the TSX has historically outperformed the SPX during recessions concentrated in the U.S.
Ultimately, the relative performance of each equity market will likely continue to be decided by the handful of sectors driving the current expansion. If the commodity cycles mature as the AI boom continues in the U.S., then the TSX will likely begin to lag. Conversely, if the commodity cycles remain robust and/or the AI boom in the U.S. matures, then the TSX outperformance could be sustained. Given the considerable uncertainty surrounding these trends, either outcome remains plausible.
Bottom Line
The TSX’s outperformance reflects an unusually favourable alignment between its sector composition and the current market environment. Strong returns in financials, materials, and energy - supported by a mix of earnings growth and valuation expansion - have more than offset the index’s limited exposure to the U.S.-led technology cycle. However, the persistence of the TSX’s relative gains will ultimately depend on how commodity prices evolve and whether the AI investment cycle continues to support U.S. earnings.
Disclaimer
This report is provided by TD Economics. It is for informational and educational purposes only as of the date of writing, and may not be appropriate for other purposes. The views and opinions expressed may change at any time based on market or other conditions and may not come to pass. This material is not intended to be relied upon as investment advice or recommendations, does not constitute a solicitation to buy or sell securities and should not be considered specific legal, investment or tax advice. The report does not provide material information about the business and affairs of TD Bank Group and the members of TD Economics are not spokespersons for TD Bank Group with respect to its business and affairs. The information contained in this report has been drawn from sources believed to be reliable, but is not guaranteed to be accurate or complete. This report contains economic analysis and views, including about future economic and financial markets performance. These are based on certain assumptions and other factors, and are subject to inherent risks and uncertainties. The actual outcome may be materially different. The Toronto-Dominion Bank and its affiliates and related entities that comprise the TD Bank Group are not liable for any errors or omissions in the information, analysis or views contained in this report, or for any loss or damage suffered.
Download
Share: