Canadian Corporate Debt: Navigating the Risks Amidst the Economic Recovery
James Orlando, CFA, Senior Economist | 416-413-3180
Brett Saldarelli, Economic Analyst | 416-542-0072
Date Published: November 19, 2021
- Category:
- Canada
- Business Investment
Highlights
- Canadian nonfinancial corporate debt has reached new highs, spurred by low interest rates and the desire for firms to hold higher levels of cash.
- Debt is highly concentrated in specific industries, including real estate and construction. The high level of indebtedness in these industries makes them vulnerable to a moderation in housing market activity.
- The oil and gas sector is another highly leveraged sector following years of energy price volatility, but the recent improvement in pricing has bolstered their financial position.
- Small businesses that operate in the food and accommodation sector, though not as highly leveraged, are vulnerable to the uncertainly surrounding service spending and the withdrawal of government support programs.
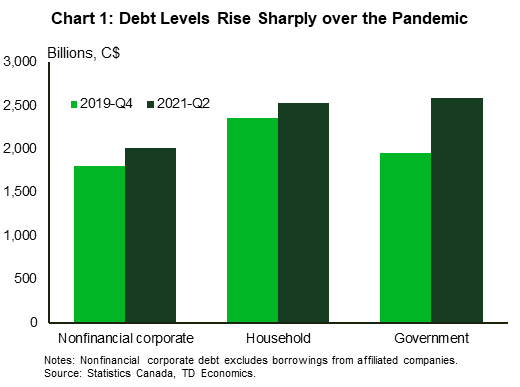
The corporate debt landscape in Canada has shifted dramatically. Over the last two years, we have seen businesses take on debt for various reasons. Some have done so to weather the economic volatility, where others have levered up to take advantage of new economic opportunities. With interest rates hitting rock bottom, the ability for firms to carry more debt has been a strong incentive. This has caused nonfinancial corporate debt to reach record highs, having increased by $196.9 billion over the pandemic (Chart 1). The total debt load now accounts for 81.5 percent of nominal GDP, well above the 77.2 percent established in the final quarter of 2019. In this paper, we look at the change in debt in the Canadian economy and highlight specific sectors which have been impacted the most.
Cash Remains King
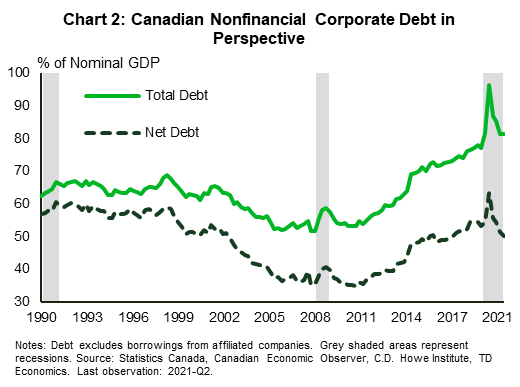
Many corporations have taken on debt only to maintain elevated cash levels. Indeed, the amount of cash holdings of nonfinancial corporations increased by 37.9 percent since the final quarter of 2019. A similar pattern, although not as pronounced, occurred during the Global Financial Crisis, when cash balances increased by 16 percent (2008Q1 to 2009Q4). When we adjust debt-to-GDP for cash holdings, we can see this metric has fallen below its pre-pandemic level and is now in line with its long-run average (Chart 2). Given the pandemic uncertainty, firms had the incentive to hold cash to meet refinancing needs. With borrowing rates at historical lows, firms across the risk spectrum were able to tap into the corporate debt market. The investment-grade sector provides evidence of this as the share of corporate issuance at the bottom of the risk spectrum currently sits at historic highs1.

The Changing Industry Debt Landscape
The global pandemic has brought a number of economic themes to the forefront, including record home price gains, oil price volatility, global supply chain disruptions, and the willingness of Canadians to return to in-person service activities. Should these themes persist they could have a profound impact on highly indebted Canadian industries. When breaking down nonfinancial corporate debt at the industry level, five industries (real estate, manufacturing, oil and gas, construction, and utilities) account for a total of 56.0 percent of gross debt and 69.3 percent of net debt2 (Chart 3). Moreover, these five industries are significant contributors to economic activity, accounting for close to 37 percent of industry level real GDP.
What Does Housing Have in Store for Real Estate and Construction?
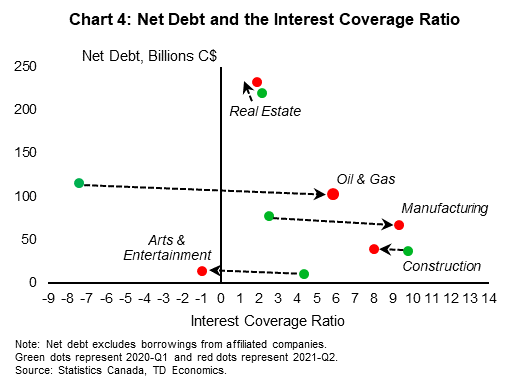
Real estate and construction are two industries that have popped up on our radar given their vulnerability to a moderation in housing market activity. The real estate sector is the most highly indebted sector in Canada, accounting for 23.3 percent of gross debt and 31.3 percent of net debt. Over the pandemic, the sector experienced one of the biggest increases in debt, with gross and net debt increasing by 5.3 and 6.0 percent, respectively. Given the high levels of debt, it’s important to gauge the industry’s ability to meet its interest obligations by looking at the interest coverage ratio3. Worrisomely, the industry has one of the lowest interest coverage ratios (Chart 4). This is important because real estate has been an engine of economic growth over the past decade, accounting for an average of 11.9 percent of real GDP. Given the run-up in house prices, the real estate sector is obviously vulnerable to any future price volatility. Using history as a guide, from 1989 to early 1990, home prices declined by 12.7 percent peak-to-trough. Subsequently, bankruptcies in the real estate sector spiked by over 200 percent.
A similar debt story has emerged in the construction sector. The sector has experienced an increase of 4.4 percent in gross debt and 4.9 percent in net debt since the first quarter of 2020 and currently accounts for 7.3 and 5.3 percent of gross and net debt, respectively. In addition to elevated levels of leverage, operating profits have plunged from their 2020Q3 peak, but are starting to rebound. Even still, the industry boasts a healthy interest coverage ratio (although it is still below pre-pandemic levels, Chart 4). Furthermore, the industry accounts for 10.3 percent of cash holdings, suggesting that it is well positioned to meet its interest obligations in the event of a future economic downturn. Similar to the real estate sector, construction has been a catalyst for economic growth, contributing an average of 7.5 percent to real GDP over the past decade, with residential building construction contributing 2.6 percent and non-residential construction contributing 1.2 percent.
Both the real estate and construction sectors could be vulnerable to a slowdown in housing market activity. The global pandemic brought a surge in Canadian residential home prices and sales as many individuals left larger less affordable cities for ones that offered more affordable living options. Residential home prices have increased by 33.0 percent since February 2020. With such strong price gains and the swelling levels of household indebtedness, the risks to the real estate and construction sectors are clear. Given the recent financial contagion risk emanating from the Chinese firm, Evergrande, amongst others, the highly indebted real estate and construction sectors should be watched.
Manufacturing Yields to Supply Chain Disruptions
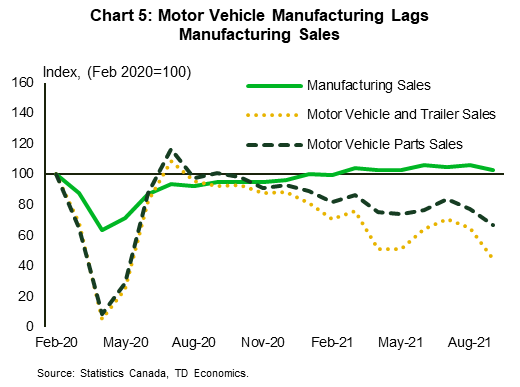
With global demand for goods peaking during the pandemic, constrained supply chains have struggled to keep up. Inputs into the manufacturing process have been delayed, or in some cases, scrapped, resulting in a slowdown in manufacturing around the world. Canadian manufacturing is no exception with sales regaining their pre-pandemic levels at a tepid pace (Chart 5). The sluggish recovery in sales has increased our interest in the sector as manufacturing is one of the most highly indebted industries, accounting for 10.4 percent of gross debt and 8.9 percent of net debt. Despite elevated debt levels, the sector’s financial statements appear to be improving. Both gross and net debt have declined by 2.0 and 14.1 percent respectively, while operating profits and the interest coverage ratio have steadily increased.
While manufacturing as a whole appears to be on solid footing, auto production is being directly impacted by supply chain disruptions and the shortage of semiconductors. Over the pandemic, sales plunged and haven’t recovered (Chart 5). Supply chain disruptions are expected to persist well into next year, which will undoubtedly weigh on future production and profits. We are already starting to see evidence of this in motor vehicle and trailer manufacturing, where operating profits and the interest coverage ratio have deteriorated markedly since the final quarter of 2020. A slightly different story is emerging for motor vehicle parts manufacturing, where operating profits and the interest coverage ratio have improved since the beginning of 2020. Should supply shortages intensify and ultimately weigh down sales and profits, the economic impact would likely be small as motor vehicle and parts manufacturing accounts for just 0.6 percent of real GDP and 0.7 percent of overall employment.
A Shot in the Arm for High Contact Services

COVID-19 and the associated lockdowns have had an unequal impact on the service sector, with the arts, entertainment and recreation, and accommodation and food services industry warranting special attention. Debt levels in the industry increased markedly over the pandemic, but are low compared to its peers, with gross and net debt accounting for just 2.4 and 1.9 percent of total debt. However, the industry’s interest coverage ratio has deteriorated alongside operating profits, signaling that some firms in the industry could have difficulties meeting their interest obligations (Chart 4).
Over the course of the pandemic, many firms in the industry relied on government support programs such as the Canadian Emergency Business Account (CEBA) to offset the decline in cash flows. As government support is withdrawn firms could face financial hardship should operating profits fail to rebound to levels that will support the additional leverage added over the pandemic. That said, a further deterioration in firms’ balance sheets is unlikely to have a financial market impact as firms that operate in the sector are typically small and usually don’t tap into the corporate debt market. Of all firms operating in the industry, 77 percent have less than 20 employees (Chart 6). Nevertheless, the effect on the wellbeing of Canadians could be wide reaching. Employment in the sector has contributed an average of 9.2 percent to total employment over the past decade, but the level of employment is still currently 17.6 percent below pre-pandemic levels.
Oil and Gas Has Weathered the Storm
While the global pandemic has created headwinds for some industries, the oil and gas sector has benefited from the changing macroeconomic environment. The past 20 months have seen volatile swings in oil prices. In April 2020, the North American benchmark oil price, West Texas Intermediate (WTI) fell into negative territory, reaching -$36.98 on concerns over diminishing demand and storage capacity. As the global economy re-opened, prices surged by over 100 percent, to their current level of around $80.
While the oil and gas sector is one of the most highly indebted sectors, with gross and net debt accounting for 8.7 and 13.7 percent of total debt, both measures have declined by 11.7 and 11.1 percent since the first quarter of 2020. In addition to declining debt, the industry has experienced a swift increase in operating profits due to rising oil prices and a notable improvement in the interest coverage ratio (Chart 4). One element of uncertainty facing the industry in the near-term are the carbon reduction objectives put in place at the COP26 climate change conference. Nevertheless, the renewed strength in the sector bodes well for the economy as the sector currently accounts for 5.3 percent of industry GDP and has contributed an average of 5.2 percent to economic growth over the past decade.
Bottom Line
The elevated level of nonfinancial corporate debt is not a new story for the Canadian economy. However, the current global health crisis has created a new economic backdrop that could present headwinds for some of the most heavily indebted sectors, namely real estate and construction. These themes may also weigh on automotive manufacturing, but the economic impact would not be as wide reaching given its small share of the aggregate economy. Smaller firms that operate in the arts, entertainment and recreation, and accommodation and food services industries may also face financial hardship, not due to onerous debt levels, but rather the withdrawal of government support programs. The story is not all bad, however, as the once struggling oil and gas sector has benefited from the surge in oil prices. All told, the new economic backdrop brought upon by the global health crisis has provided unique challenges and opportunities for Canadian industries to navigate.
End Notes
- Federal Reserve Board Financial Stability Report, November 2021.
- Industry debt has been defined as borrowings from non-affiliated companies which includes mortgage loans, non-mortgage loans and overdrafts, and debt securities. Data are from Statistics Canada, Table 33-10-0225-01 Quarterly Balance Sheet, Income Statement and Selected Financial Ratios by non-financial industry.
- Due to data limitations, the interest coverage ratio has been defined based on Bank of Canada research as operating profits plus depreciation, depletion and amortization relative to interest expense.
References
- Federal Reserve Board Financial Stability Report, November 2021. https://www.federalreserve.gov/publications/files/financial-stability-report-20211108.pdf
- Grieder, Tim and Claire Schaffter (2019), “Measuring Non-Financial Corporate Sector Vulnerabilities in Canada”, Bank of Canada Staff Analytical Note. https://www.bankofcanada.ca/wp-content/uploads/2019/05/san2019-15.pdf
Disclaimer
This report is provided by TD Economics. It is for informational and educational purposes only as of the date of writing, and may not be appropriate for other purposes. The views and opinions expressed may change at any time based on market or other conditions and may not come to pass. This material is not intended to be relied upon as investment advice or recommendations, does not constitute a solicitation to buy or sell securities and should not be considered specific legal, investment or tax advice. The report does not provide material information about the business and affairs of TD Bank Group and the members of TD Economics are not spokespersons for TD Bank Group with respect to its business and affairs. The information contained in this report has been drawn from sources believed to be reliable, but is not guaranteed to be accurate or complete. This report contains economic analysis and views, including about future economic and financial markets performance. These are based on certain assumptions and other factors, and are subject to inherent risks and uncertainties. The actual outcome may be materially different. The Toronto-Dominion Bank and its affiliates and related entities that comprise the TD Bank Group are not liable for any errors or omissions in the information, analysis or views contained in this report, or for any loss or damage suffered.
Download
Share this: