Corporate Canada: Getting Ready for a Stress Test
James Orlando, CFA, Director & Senior Economist | 416-413-3180
Brett Saldarelli, Economist | 416-542-0072
Date Published: March 8, 2023
- Category:
- Canada
- Financial Markets
Highlights
- The finances of Canadian corporations have improved dramatically over the last three years, as strong economic growth and high commodity prices provided a boost to profits and cash reserves.
- With the economy set to weaken over 2023, corporate resilience will be tested, though improved balance sheets will act as a significant buffer.
- The balance sheet improvement is evident across most sectors, although differences are apparent due to existing debt obligations, the amount of cash holdings, and the degree of earnings variability.
Corporate Canada has been on an incredible run over the last few years. The economic rebound brought about a surge in profits and filled corporate coffers. Debt ratios subsequently declined and the cash hoard on corporate balance sheets has swelled (Table 1). This puts businesses on favourable footing heading into the much-anticipated economic slowdown. Even across industries, firms appear well-positioned to withstand the impact of lower economic growth and high interest rates.
Table 1: Canada Corporate Debt
| Year | Gross Debt/GDP*, % | Net Debt/GDP*,% | Total Assets/Gross Debt*, % | Cash/Gross Debt*, % | Profits/Gross Debt*, % | Interest Coverage Ratio |
| 2022 | 75.1 | 43.5 | 484.0 | 42.2 | 18.4 | 5.8 |
| 2021 | 80.7 | 48.3 | 450.1 | 40.2 | 17.0 | 5.5 |
| 2020 | 86.8 | 54.5 | 400.3 | 37.2 | 13.0 | 3.6 |
| 2010-2019 | 64.2 | 42.4 | 484.8 | 34.0 | 18.7 | 3.0 |
| 2000-2009 | 57.2 | 42.2 | 485.2 | 26.6 | 24.2 | 2.3 |
| 1990-1999 | 64.5 | 57.0 | 348.8 | 11.6 | 17.5 | 0.7 |
Debt Up, But So Are Profits and Cash
While corporate debt levels have increased by 18% since the end of 2019, the associated risk is less than meets the eye. Despite the recent pullback in the latter half of 2022, profits as a percent of GDP are at their historical average of the prior decade, after increasing swiftly from their pandemic low. Importantly, firms have banked their profits over the last three years, causing cash to now account for 42% of total debt - well above the 30% average over the prior two decades. In addition, total assets as a share of debt have increased markedly since mid-2020 and are hovering close to levels last seen in 2014. At the same time, many firms have locked in a significant amount of debt at longer-term fixed rates1. This has allowed the interest coverage ratio – a commonly referred to financial metric used to assess a firm’s ability to meet its interest obligations – to increase well above its long-run average2.
The Industry Debt Divide
When examining leverage at the industry level, we can see that debt is highly concentrated within a few industries3. Real estate, manufacturing, construction, and oil and gas account for 55% of net debt and 34% of GDP. Of these sectors, two have trended in a positive direction since 2020 (Table 2). The oil and gas sector has seen debt ratios decline, while commodity price strength caused a swift rise in the interest coverage ratio.
Table 2: Canada Corporate Debt: Industry Breakdown
| Industry | 2022 | 2021 | 2020 | 2010-2019 | 2000-2009 | 1990-1999 |
| Gross Debt, Billions $ | ||||||
| Real Estate | 355 | 320 | 305 | 195 | 80 | 65 |
| Manufacturing | 145 | 146 | 147 | 126 | 94 | 71 |
| Construction | 127 | 104 | 99 | 68 | 29 | 20 |
| Oil & Gas | 94 | 100 | 111 | 102 | 50 | 20 |
| Transportation | 92 | 79 | 74 | 45 | 22 | 12 |
| Cash/Gross Debt, % | ||||||
| Real Estate | 14 | 14 | 14 | 15 | 10 | 5 |
| Manufacturing | 53 | 50 | 45 | 40 | 32 | 18 |
| Construction | 43 | 50 | 52 | 57 | 46 | 27 |
| Oil & Gas | 10 | 9 | 7 | 14 | 13 | 5 |
| Transportation | 22 | 27 | 28 | 37 | 33 | 29 |
| Total Assets/Gross Debt, % | ||||||
| Real Estate | 303 | 298 | 293 | 291 | 264 | 219 |
| Manufacturing | 864 | 815 | 792 | 778 | 747 | 539 |
| Construction | 406 | 453 | 458 | 470 | 460 | 415 |
| Oil & Gas | 642 | 573 | 523 | 500 | 510 | 330 |
| Transportation | 325 | 320 | 310 | 288 | 270 | 266 |
| Interest Coverage Ratio | ||||||
| Real Estate | 1.5 | 1.7 | 1.6 | 1.8 | 1.1 | -0.1 |
| Manufacturing | 9.6 | 8.1 | 4.6 | 2.0 | 0.9 | 0.3 |
| Construction | 2.5 | 4.6 | 6.6 | 8.5 | 6.5 | 3.8 |
| Oil & Gas | 12.8 | 8.5 | -2.1 | 5.1 | 8.2 | 4.9 |
| Transportation | 5.0 | 4.1 | 4.4 | 4.7 | 3.3 | 1.9 |
A similar story has emerged in the manufacturing sector, which has benefitted from strong demand for physical goods and online shopping. Here we have seen debt levels fall alongside greater ability to service debts.
At the other end, the construction and real estate sectors appear more vulnerable. Construction is one of the most highly leveraged sectors and has experienced a sharp increase in debt levels, while the interest coverage ratio has trended downward as operating profits have fallen significantly since the beginning of 2020. As of the final quarter of 2022, profits are negative in this sector.
Real estate is also on our radar. As the most heavily indebted sector, it has also experienced a sizeable increase in debt. And although the interest coverage ratio has held steady over the last three years, it has started to decline alongside profits towards the end of 2022.
How Will Canadian Industries Fare in the Coming Slowdown?
With the BoC bringing the overnight target rate to its highest level since 2007, recession fears have continued to mount. There has been a noticeable slowing across interest sensitive sectors of the economy, with residential investment falling 15% in real terms since the beginning of 2022 (-22% since the beginning of 2021) and the housing market continuing to moderate from the torrid pace of the prior two years. Household spending has also eased from the feverous pace in early 2022, as high inflation and high interest rates have taken a bite out of consumer spending potential.
Despite the improvement in corporate balance sheets, firms across various industries could be vulnerable to an economic slowdown due to the cyclicality of their earnings and the origin of the shock. High interest rates will likely cause a notable decline in the interest coverage ratios in the rate sensitive real estate and construction sectors. As we show in Chart 1, the forecast for the interest coverage ratio buffer is thin relative to other sectors.
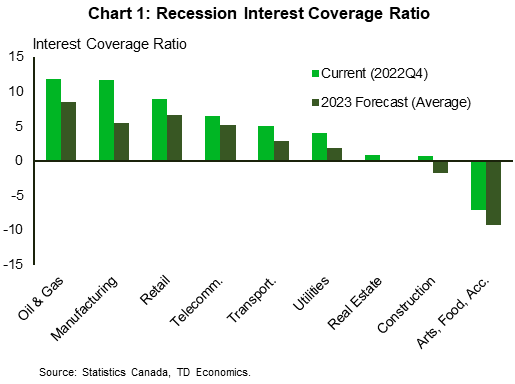
Our outlook also considers the growing stress likely to be felt on the consumer side. We expect significant spending adjustments, where the Canadian consumer prioritizes necessities. For this reason, spending at retail stores, on manufactured goods, and on entertainment (arts, food, etc.), will likely suffer. For retail and manufacturing, their improved financials should help them weather the slowdown in the quarters ahead. That said, firms in arts, food, and accommodation – which are still working to improve their financial standing after a significant pandemic hit – appear more vulnerable. A slowdown that cuts their earning potential would be coming at a very inopportune time.
Commodity prices will also play a big part. We have already seen a 34% peak to trough decline in the price of oil on the back of slowing global growth. Most other commodity prices have also pulled back significantly from their peaks last year. But with most of the recalibration done and China in the process of reopening, the oilpatch and other commodity-oriented firms look well positioned to succeed over 2023.
Bottom Line
Corporate balance sheets have improved markedly as firms have banked their profits into large cash holdings. The increase in financial resources will improve firms’ capacity to service their debt obligations. Though firms tied to housing and the indebted Canadian consumer may suffer more, it is apparent that most sectors have built up a significant financial buffer. This better foundation will be imperative as firms attempt to navigate the upcoming economic slowdown.
End Notes
- In the 2022 Financial System Review the Bank of Canada undertook research on the refinancing risks of nonfinancial businesses using data on publicly listed businesses. The Bank of Canada concluded that while bonds accounted for the largest fraction of outstanding debt, the vast majority of bonds were issued at fixed rates and not scheduled to mature for more than five years posing limited interest rate risk.
- Due to data limitations, the interest coverage ratio has been defined based on Bank of Canada research as operating profits plus depreciation, depletion and amortization relative to interest expense.
- Industry debt has been defined as borrowings from non-affiliated companies which includes mortgage loans, non-mortgage loans and overdrafts, and debt securities. Data are from Statistics Canada, Table 33-10-0225-01 Quarterly Balance Sheet, Income Statement and Selected Financial Ratios by non-financial industry. Data prior to 2020 were constructed using transformations from previous versions of the survey.
References
Grieder, Tim and Claire Schaffter (2019), “Measuring Non-Financial Corporate Sector Vulnerabilities in Canada”, Bank of Canada Staff Analytical Note: https://www.bankofcanada.ca/wp-content/uploads/2019/05/san2019-15.pdf
Disclaimer
This report is provided by TD Economics. It is for informational and educational purposes only as of the date of writing, and may not be appropriate for other purposes. The views and opinions expressed may change at any time based on market or other conditions and may not come to pass. This material is not intended to be relied upon as investment advice or recommendations, does not constitute a solicitation to buy or sell securities and should not be considered specific legal, investment or tax advice. The report does not provide material information about the business and affairs of TD Bank Group and the members of TD Economics are not spokespersons for TD Bank Group with respect to its business and affairs. The information contained in this report has been drawn from sources believed to be reliable, but is not guaranteed to be accurate or complete. This report contains economic analysis and views, including about future economic and financial markets performance. These are based on certain assumptions and other factors, and are subject to inherent risks and uncertainties. The actual outcome may be materially different. The Toronto-Dominion Bank and its affiliates and related entities that comprise the TD Bank Group are not liable for any errors or omissions in the information, analysis or views contained in this report, or for any loss or damage suffered.
Download
Share: