Canadian Housing: Navigating Challenges
Rishi Sondhi, Economist | 416-983-8806
Date Published: October 26, 2023
- Category:
- Canada
- Real Estate
This report is a Q&A covering 5 key Canadian housing-related questions as we head into the final months of 2023. In it, we detail what multi-year highs for rates have meant for resale housing so far – both nationally and regionally – and what's to be expected moving forward. We also examine how homebuilding is holding up in this high-rate environment, how investor activity is faring, and what governments are doing (or could do) to tackle Canada's housing shortage.
Question 1. To what extent are recent interest rate increases weighing on Canadian resale markets?
Following a rebound this past spring, Canada's resale activity has succumbed to another wave of downward pressure since the summer. The major catalyst for this latest weakness was the BoC, which ended a 4 month period on pause by hiking its policy rate in both June and July, while maintaining a bias towards additional tightening. Making matters worse, the 5-year Government of Canada bond yield has increased about 130bps over the past 6 months to a new multi-year high of around 4.2%.
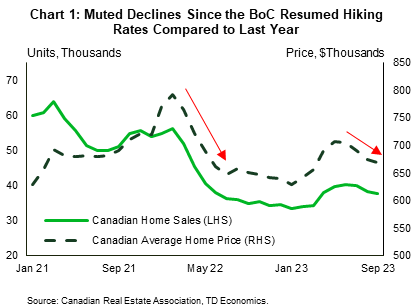
In essence, these hikes are hitting a market that was already down. National sales have pulled back by about 5%, partially retracing the moderate rally this past spring. Sales remain about 12% below their pre-pandemic levels. This second leg down in activity has been minor compared to the 40% plunge in sales observed from the early part of 2022 through the beginning of this year (Chart 1).
The shift observed in market balance has been considerably more notable, as lower sales have coincided with a sizeble increase in new listings. Indeed, the Canadian sales-to-new listings ratio has plunged from nearly 70% (indicating very tight conditions) in April to 51% (the softer-side of what's considered balanced) in September. The latter marked the lowest point for the ratio since July of last year.
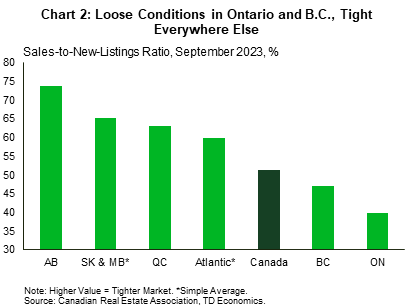
There is, however, an interesting regional divergence that's emerged, one which is vividly illustrated through differences in sales-to-new listings ratios across provinces (Chart 2). Notably, these ratios are at or above long-term averages in most provinces except B.C. and Ontario. In these two latter markets, sales have tumbled, and average price declines have been amongst the most pronounced since the BoC resumed hiking rates (Chart 3). These are two markets where affordability has recently breached historical worsts. In contrast, decent affordability conditions have supported firm growth in sales and prices in the Prairies and Newfoundland and Labrador. In Alberta's case, the fastest population growth in the country is offering an important boost to activity. These diverging regional trends mark a break from the remarkable synchronicity observed across provinces for much of the last 3 years.

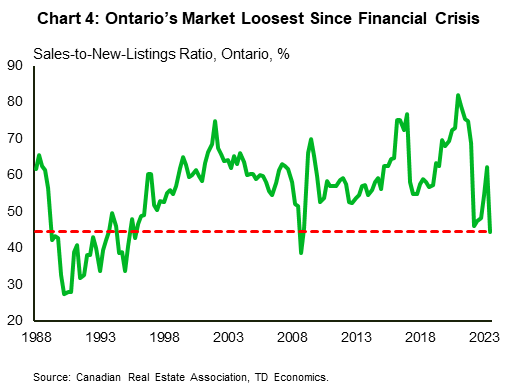
Coming back to the supply side, Canadian new listings increased for 6 straight months through September, marking a 35% surge over that time. However, because the starting point preceding these gains was so low, they had only returned to their long-term average. Ontario forms an important exception, as listings have leapt even higher to levels that are notably above long-term averages, possibly indicating that higher rates are impacting supply via pressures on homeowners. This supply bulge has driven the sales-to-listings ratio down to 40%, the lowest it's been since the depths of the Global Financial Crisis (Chart 4).
Within the province, this weakness has been especially pronounced in Toronto and markets in Central Ontario (like Hamilton, Kitchener-Waterloo, and Niagara). However, even markets in Southwestern and Eastern Ontario are showing signs of softness. Only in Northern Ontario are housing conditions generally more balanced.
Question 2: What's the outlook for 2024? Will wide regional divergences persist?
Following their 2023Q3 spurt, new listings will likely trend higher through the end of 2024. However, this rise in supply should be tempered by job markets that remain resilient in the face of flagging economic growth. Notably, we expect employment levels to hold roughly flat from 2023Q3 through the end of 2024, thereby acting as a limiting factor on forced sales.
The anticipated weakness in sales and prices is another factor that should restrain growth in listings over the next few quarters. Historically, when sales and home prices weaken, supply typically tends to follow suit, with would-be sellers moving to the sidelines to wait out the turbulence.
So, what is our view on home sales and prices? We expect Canadian home sales and average prices to fall in the final quarter of the year and into 2024Q1, as the impact of higher rates continues to be felt. Relative to third quarter levels, sales and prices should be about 10% and 5% lower, respectively by the end of 2024Q1. Thereafter, we expect both sales and prices to pick up, starting in 2024Q2. Key here is our assumption that the BoC will be cutting rates in the spring, as the unemployment rate should continue to rise, thus taking the heat off wage growth, while core inflation will likely be moving closer to the Bank's 2% target. At the same time, investors should be moving to price in the growing likelihood of rate cuts amid a sustained stretch of weak economic growth. As such, Canadian bond yields should start to edge down from their current multi-year peak by the end of this year. Population growth should also remain robust, while job markets bend (but not break) under the weight of higher rates. However, historically challenging affordability backdrops in most provinces will likely temper the extent of the rebound in housing. Indeed, we suspect that it will take until 2025 for Canadian home sales to sustainably surpass their pre-pandemic level.


Regionally, the steepest near-term declines should take place in Ontario and B.C., with lesser drops manifesting across much of the Atlantic and Quebec. By mid-2024 each of these regions should be seeing rising sales and prices. In contrast, Newfoundland and Labrador and the Prairies are likely to see rising prices over the forecast horizon, supported by favourable affordability backdrops (Chart 6).
In terms of risks to our forecast, there's the potential for job markets to deteriorate by more than we expect. If this risk were to materialize, it would have the largest impact on our forecast through it's potential to push housing supply higher while simultaneously weaking demand. Another important risk is that the BoC may take their policy-rate higher than we anticipate if inflation remains stubborn. While weighing on demand, this could amp up the pressure even more for overstretched homeowners renewing into a much higher backdrop for rates, pushing supply higher than we expect.
Question 3: How is investor activity faring?
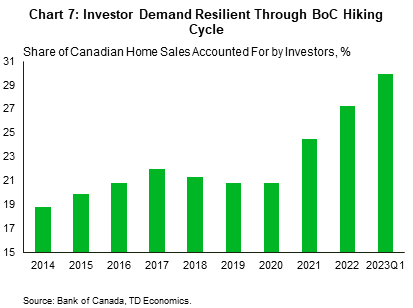
The outlook for investors is one of the biggest uncertainties around our view. It's also an especially important consideration given that type of demand has helped prop up overall selling through the Bank of Canada's hiking cycle. As of 2023Q1, investors accounted for 30% of homes purchased across Canada, according to Bank of Canada data (Chart 7). This share is up 4 ppts from the final quarter of 2021 (before the Bank initiated its tightening cycle). While Bank's data only stretches to the first quarter, outperforming condo sales in several markets since that time hints at some persistence in this demand.
Of course, if investor demand has comprised a rising share of sales, that implies a dwindling slice of the sales pie for other purchasers, in this case repeat buyers. From 2021Q4 – 2023Q1, the share of homes bought by repeat buyers fell by about 4 ppts to 28%, marking its lowest level since at least 2014. In our view, move-up demand has been impeded by an eroded affordability backdrop and tough stress test qualification standards. For first-time homebuyers, their share of home purchases amounted to 43% in 2023Q1. While this is nearly unchanged from 2021Q4, its well down from the 50% mark observed in 2014.
At first glance, the relative resilience in investor demand may seem curious, as this group is typically the most indebted of all buyers and interest rates have moved sharply higher. Of course, real estate investment has provided a solid return over the long-term, and the return of rates to multi-year highs was not immediate. Still, it's fair to wonder how much steam this demand has, especially as a typical new investor would likely be deeply cashflow negative in a jurisdiction like the GTA, even with the sharp rise in rents. In addition, higher rates have blunted the attractiveness of real estate relative to other asset classes. For instance, in Toronto the apartment cap rate was measured at between 3.5 – 4.5% in 2023Q21. Meanwhile, a risk-free 2-year government bond was yielding 4.1%. Price growth has also not been strong, which simply piles on to the bearish case.
Given these developments, one could reasonably expect the share of homes being purchased by investors to move away from its current, multi-year high. Higher rates also appear to be driving (likely over-levered) investors into listing their properties, at least in the GTA2. However, once the Bank of Canada begins to cut rates, that should relieve some pressure in this space, while supporting demand from other types of buyers.
Question 4: How is homebuilding holding up across Canada?
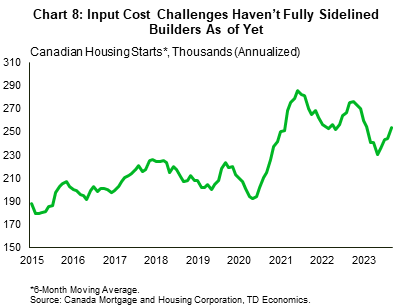
This is an especially important question in the context of a surging Canadian population. The answer is "pretty well", as even with multi-year highs in borrowing costs and persistent labour shortages, builders have been able to sustain a pace of housing starts that's roughly 20% above pre-pandemic levels and near-multi-decade highs (Chart 8). Activity has been supported by elevated prices, past sales gains, and low levels of unsold inventories. Across regions, B.C., Alberta and Ontario have offered important boosts, while starts are rapidly retrenching in Quebec. Robust homebuilding has also translated to a level of completions that's running at its fastest rate on record so far in 2023, with 140k units finished across CMA's through September.
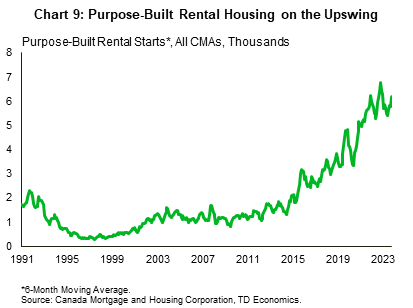
An important story that’s perhaps flown under the radar a bit is the resurgence in purpose-built rental construction. Supported by supercharged rent growth and abetted by government programs, purpose-built starts are by far the highest they've been since at least 1990, both in absolute and per capita terms (Chart 9).
Even with these positives, there are still concerns. For one, while the number of units under construction is at a record high, a large part of this reflects the fact that it's taking longer to deliver new supply to the market. Indeed, as of September, it took 18 months to finish a construction project in Canada. Part of this has to do with the shift to apartment construction, which typically takes longer to complete. However, construction timelines have lengthened across all structure types, according to CMHC data. The problem of delivering new supply in markets like Toronto and Vancouver is also exacerbated by cumbersome regulations around land use and delays in approving projects, which is much less of a struggle in other jurisdictions.
More worrying is the likelihood that even at these elevated levels, homebuilding will struggle to keep pace with demand induced through Canada's ballooning population (and other factors such as healthy growth in household assets). Our forecast anticipates Canada's population swelling by over 1 million people this year and a slower (but still elevated) 740k in 2024, as economic uncertainty weighs on international migration flows.
In an earlier paper, we estimated that Canada could be short some 215k cumulative units from 2023-2025, as population growth collides with a cooler pace of homebuilding. We've since upgraded our population forecasts on the back of strong data, and now the estimated gap has swollen to over 300k units. This shortage threatens sustained pressure on affordability over the medium term, with CMHC analysis pointing to the most pronounced gaps in Ontario, B.C. and Manitoba.
Question 5: How are governments responding to Canada's housing challenges?
Question 4 highlights the scale of the challenge faced by policymakers and the construction industry in accommodating Canada's population boom. For their part, governments at all levels have taken steps in the right direction. Some examples include municipalities like Edmonton, Vancouver, and Toronto changing zoning regulations to allow for more so-called "gentle" density. Vancouver has also made strides in purpose-built rental construction through its housing strategy.
At the provincial level, the Ontario government boasts that 23 of the 74 recommendations from its Housing Affordability Task Force report have been either fully or partially implemented, while 14 are in progress. Some examples of measures taken include limiting exclusionary zoning in municipalities through binding provincial actions, and legislating timelines at each stage of the provincial and municipal review process. In B.C., the government has announced plans that will offer financial support for owners who want to construct secondary suites, supply more multi-unit housing for middle-income earners, create new laws that allow secondary suites on sites currently zoned for single-family, and supply tools that help municipalities enforce new rules on short-term rentals. Of course, all provinces and territories have active housing plans and housing, like education and healthcare, is a continuous priority for policymakers. At the federal level, the government has implemented category-based selection in Express Entry, allowing for the rapid intake of immigrants with backgrounds in the skilled trades.
Making headlines is the federal government's decision to remove the GST on purpose-built rental construction. This is certainly a step in the right direction with respect to levelling the playing field between those types of units and condominiums for builders. Ontario, Newfoundland and Labrador, Nova Scotia and PEI have followed suit (while Manitoba has pledged to), by relieving the provincial portion of the tax burden. Econometric analysis suggests that this change could offer a lift of around 6% (or 5k units) to purpose-built rental starts over a year. However, media reports say that this change (abetted by adjustments that allow more low-cost financing through the Canada Mortgage Bond program), could lift starts by over 10k units.3
Of course, more can always be done, and there's certainly no shortage of recommended routes policymakers can opt for. To pick but a few, Ontario's Housing Affordability Task Force report offers the province a robust roadmap on how to boost supply. Others, like the recommendations from the National Housing Accord, provide ideas on how to lift purpose-built construction across the country.
For our part, we think that (among other measures) provinces and municipalities working together to eliminate or reduce cumbersome ancillary construction requirements could bear some fruit, if developments in other jurisdictions (like Minneapolis, for example) are any guide4. The federal government could also review the Rental Construction Financing Initiative (which offers low-cost loans for developers of "standard" rental units), to see if there's any opportunities for enhancements, especially as it’s the largest program in their National Housing Strategy. Notably, A Centre for Urban Research and Education study estimated that, at most, only 4% of all rental starts from April 2017 – September 2020 could be attributed to the program5. Governments at all levels could also review domestic programs to identify unintended or self-imposed barriers on recruitment and retention in the trades. This would help maximize the workforce already in the country.
Recall that CMHC estimated that an additional 3.5 million units above what's already planned would be required by 2030 to restore affordability to 2003/04 levels. This is a daunting task, as it implies historical highs (by far) in homebuilding are required on a sustained basis. Hitting this lofty goal probably isn't required, however, as affordability was pristine in 2003/04, but it does illustrate that more action will be needed.
End Notes
- Colliers (August 18, 2023). Canada Cap Rate Report. https://www.collierscanada.com/en-ca/research/canada-cap-rate-report-2023-q2
- Pasalis, J. (October 2023). The Move Smartly Report. Realosophy Realty. https://www.movesmartly.com/monthly-report-2023-october
- Rendell, M. & Younglai, R. (2023, October 15). New government efforts expected to boost rental construction in Canada. The Globe and Mail. https://www.theglobeandmail.com/business/article-new-government-efforts-expected-to-boost-rental-construction-in-canada/
- Maltman, M. (2003, April 17). A Detailed Look at the Outcomes of Minneapolis' Housing Reforms. One Final Effort. https://onefinaleffort.com/blog/a-detailed-look-at-minneapolis-housing-supply-reforms
- Pomeroy, S. (2021, January). Toward Evidence Based Policy: Assessing the CMHC Rental Housing Finance Initiative?. CURE Brief # 12. Centre for Urban Research and Education (CURE). https://carleton.ca/cure/wp-content/uploads/CURE-Brief-12-RCFI-1.pdf
Disclaimer
This report is provided by TD Economics. It is for informational and educational purposes only as of the date of writing, and may not be appropriate for other purposes. The views and opinions expressed may change at any time based on market or other conditions and may not come to pass. This material is not intended to be relied upon as investment advice or recommendations, does not constitute a solicitation to buy or sell securities and should not be considered specific legal, investment or tax advice. The report does not provide material information about the business and affairs of TD Bank Group and the members of TD Economics are not spokespersons for TD Bank Group with respect to its business and affairs. The information contained in this report has been drawn from sources believed to be reliable, but is not guaranteed to be accurate or complete. This report contains economic analysis and views, including about future economic and financial markets performance. These are based on certain assumptions and other factors, and are subject to inherent risks and uncertainties. The actual outcome may be materially different. The Toronto-Dominion Bank and its affiliates and related entities that comprise the TD Bank Group are not liable for any errors or omissions in the information, analysis or views contained in this report, or for any loss or damage suffered.
Download
Share: