Provincial Budget Season Wrap-Up
Date Published: April 23, 2026
Highlights
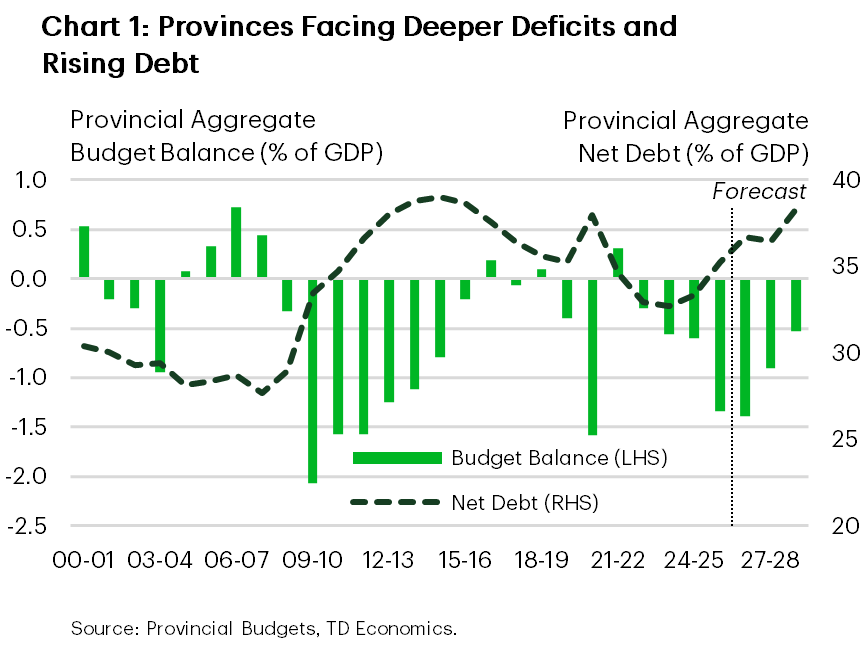
- This year’s round of provincial budgets revealed an aggregate deficit of around 1.4% of GDP for FY 2026/27, a deterioration from last year, but modest by historical standards. The all-province net debt-to-GDP ratio is set to climb further.
- Recent energy price gains have tilted near‑term fiscal risks towards improved budget positions, particularly for commodity‑producing provinces.
- Capital spending remains a central pillar of fiscal plans, providing near‑term support to growth but adding to medium‑term debt and debt‑servicing pressures across most jurisdictions.
- New policy initiatives were deliberately limited, with a focus on affordability, housing, and core services. To some extent, targeted support will help firm domestic activity, potentially offsetting downside risks to real growth from external shocks.
Provincial governments entered this budget season with less fiscal room, reflecting weaker budget balances, elevated debt, and a softer macro backdrop. As a result, budgets were generally cautious. Indeed, program spending increases were restrained and focused on core services. Policy measures tended to be pragmatic rather than ambitious, while capital spending remained a key feature—adding to already rising debt loads and future interest costs.
This note summarizes the key takeaways from this spring’s round of provincial budgets, including projected balances, debt positions and key measures. Moreover, since most budgets were crafted on economic assumptions compiled before – or in the early stages – of the Middle East war, we provide an assessment of how the shock could affect the near-term fiscal outlook of the Provinces.
Provincial Fiscal Positions Are Eroding
According to this year’s budgets, the combined provincial deficit is projected to widen by about $6.5 billion to $47 billion in FY 2026/27, driven largely by Ontario, British Columbia (B.C.), and Alberta. As a share of GDP, the overall shortfall is expected to edge up to 1.4%. Meanwhile, net debt-to-GDP is forecast to rise just shy of a percentage point (ppt) to 31.5% by FY 2027/28 – near the highs seen in 2012–2015, when weak nominal GDP growth weighed on fiscal metrics (Chart 1).
Debt-servicing costs are also set to climb, with interest costs projected to drift higher from 6.4% in FY 2025/26 to 6.7% by FY 2028/29. While still below the elevated levels of the 1990s and early 2000s, this rising “interest bite” will further constrain fiscal flexibility and leave provinces modestly more exposed to rate shocks.
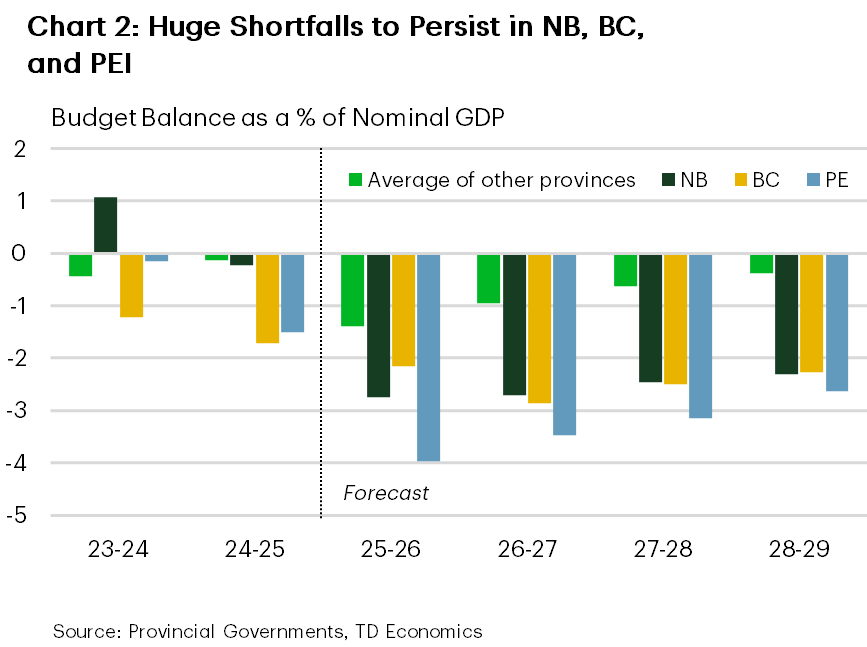
Medium-term paths back to balance are laid out in Ontario, Quebec, Saskatchewan, and Manitoba. However, Ontario and Quebec rely on keeping spending growth contained to less than the rate of inflation, while Manitoba’s plan assumes a large revenue gain this fiscal year despite an uncertain economic backdrop. Elsewhere, deficits are expected to persist in Nova Scotia, B.C., New Brunswick, and Alberta. Notably, shortfalls in B.C., New Brunswick, and PEI are projected to average over 2.5% of GDP over the next three years, which are lofty by historical standards (Chart 2).
Elsewhere, recent credit downgrades in B.C., Nova Scotia, and Quebec, highlight the pressures provinces face around higher spending and rising borrowing needs. The overall provincial sector, however, remains in good standing across rating agencies, even as credit differentiation has become more pronounced. For example, provinces such as Alberta and Ontario are notable for their stability and positive performance, while most other provinces carry a high and stable rating. Overall, recent downgrades are not flashing major warning signs, but they do underscore a shift toward tighter fiscal constraints that bears watching as borrowing needs remain elevated.
Capital Spending Plans Feature Heavily
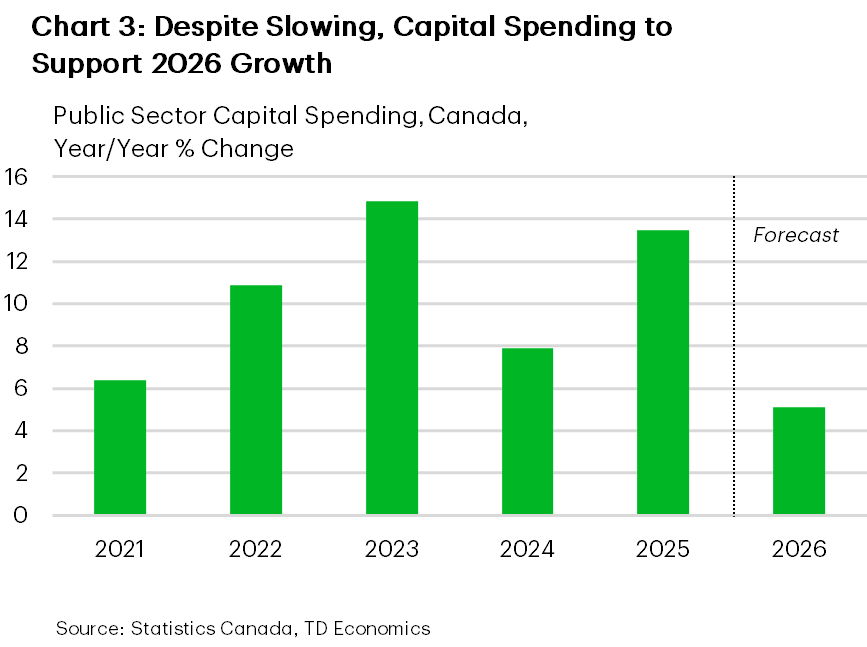
A key driver of rising provincial debt burdens is the sustained emphasis on capital spending (Chart 3). Atlantic Canada continues to make significant capital commitments, while B.C. maintains a reprofiled but substantial program. Ontario is planning nearly $40 billion in outlays for FY 2026/27, just under $10 billion is expected in Alberta, and Quebec is topping up its infrastructure plan.
Near-term, this spending should be supportive of growth. The latest capital spending intentions survey points to a 5% nominal increase in public sector investment in 2026, led by transportation and utilities, with healthcare investment also rising.
Capital spending may also benefit provinces in the long run. Studies suggest that public sector investment is relatively more productive than the private sector1, that private industries broadly benefit from public sector investment2, and that the returns per dollar spent can be substantial3.
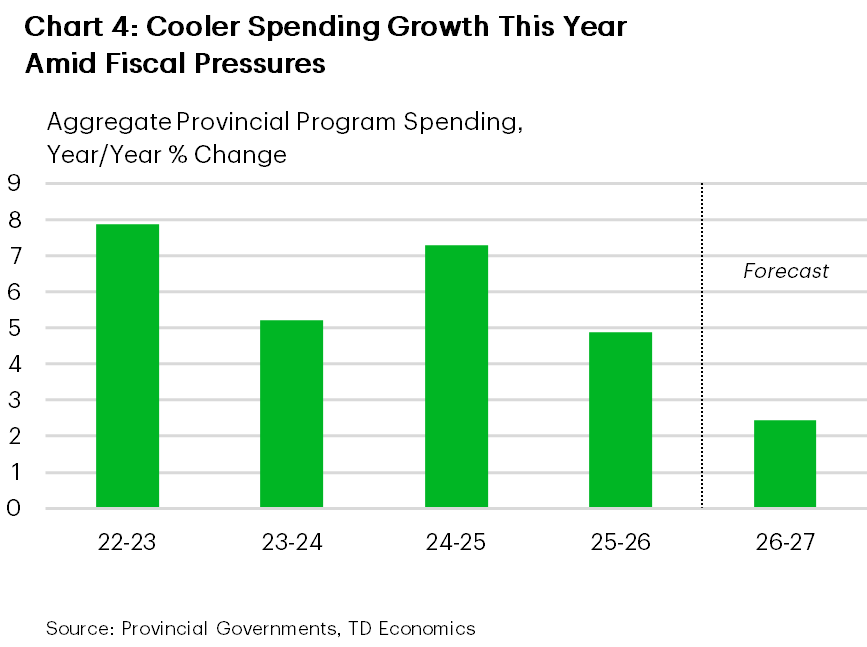
Program Spending Gains Geared to Core Services
Program spending across provinces is slated to ease to around 2.4% across regions in the upcoming fiscal year – roughly flat in real terms (Chart 4). This suggests a lesser contribution to GDP growth from provincial operating spending in 2026. Firmer FY 2026/27 gains are projected in healthcare and education compared to other portfolios, lifted by cost and demographic pressures as well as capacity expansions.
Ontario and Quebec account for most of the slowdown in overall program spending. In both provinces, healthcare spending is expected to grow faster than the total in FY 2026/27. Education spending is also expected to outperform other major portfolios in Quebec, while Ontario’s education spending is projected to be weak, which the government attributes to a continued pullback in foreign students.
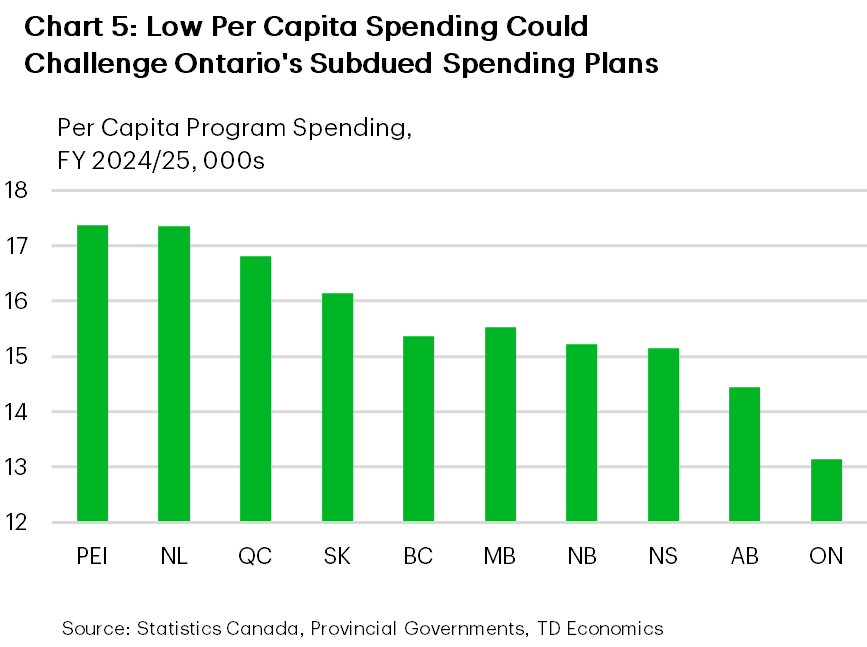
Austere periods are possible (e.g., Quebec’s program spending averaged just 1.8% from FY 2014/15 – FY 2016/17). Still, both Ontario and Quebec face structural and cyclical challenges meeting spending targets, largely due to population aging (over 20% of Quebec’s residents are now 65+). Ontario also has the lowest per-capita program spending, so there’s potentially less room to trim (Chart 5). Both provinces also risk needing to support their economies further, given their exposure to U.S. trade frictions and reliance on energy imports.
Our latest Provincial Economic Forecast incorporated budgets from Alberta, B.C., and Nova Scotia. Budgets released since then point to modest upside risk to the spending outlook in Manitoba and New Brunswick compared to earlier expectations, but the overall picture is largely unchanged.
New Initiatives Are a Mixed Bag
Policy choices were generally targeted rather than transformative as provinces face more challenging conditions. In most cases, governments leaned on modest tax and revenue measures, from B.C.’s personal income tax (PIT) bracket and provincial sales tax (PST) base changes to Alberta’s taxes on user‑pay items and Saskatchewan’s corporation capital tax (CCT) tweak. While these measures will lift revenues in these regions, Manitoba’s decision to remove the PST from groceries will support household purchasing power at a cost to the government. Ontario stood out for pairing business side relief with housing market stimulus, including a small business rate cut and the removal of HST on new homes, while also launching a new $4 billion investment fund geared to priority sectors such as AI and advanced manufacturing.
Saskatchewan layered in a set of smaller household supports (tax credits and a one‑time arrears benefit), and Manitoba boosted renter/homeowner credits. Quebec, by contrast, largely avoided major new initiatives ahead of an election, but still included targeted social supports and a cap on school tax growth. Finally, several provinces used budgets to emphasize fiscal management tools, through higher contingencies in B.C., a fiscal framework review in Alberta, or efficiency focused plans in Nova Scotia. Taken together, the mix of new and expanded measures are unlikely to be a near-term game changer for provincial growth, but it does provide targeted support to key sectors and households, helping to modestly firm domestic demand.
Commodity Provinces Will Likely See Improved Fiscal Positions
Canada’s commodity-producing provinces entered this budget season facing a deteriorating fiscal outlook. In FY 2026/27, Alberta expects its budget deficit to swell to over $9 billion, its largest since 2020/21. Saskatchewan also anticipates a deficit of more than $800 million, following a $1.2 billion shortfall last year. However, these estimates were tabled before the recent sharp rise in energy prices that offer meaningful upside to the provinces’ projected revenue profiles.
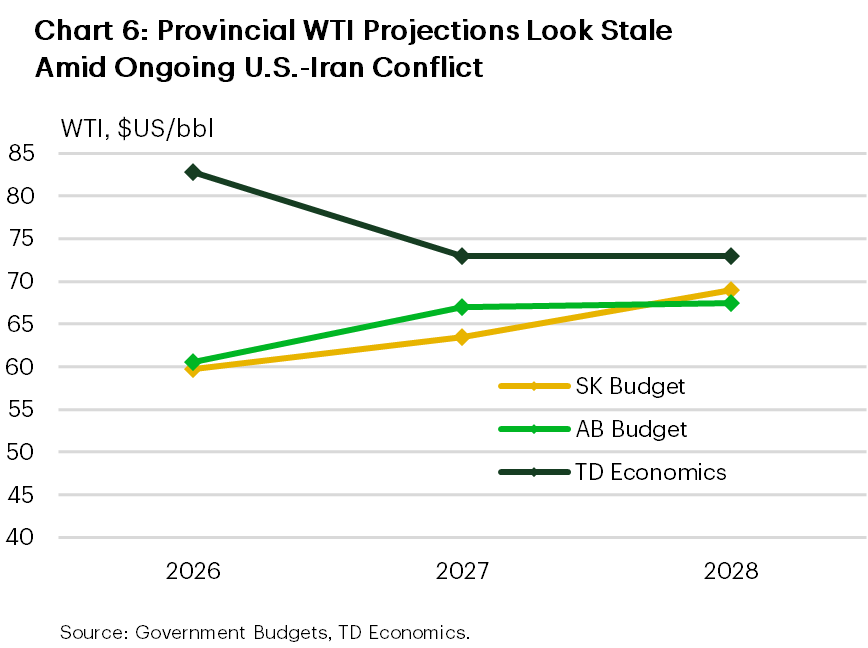
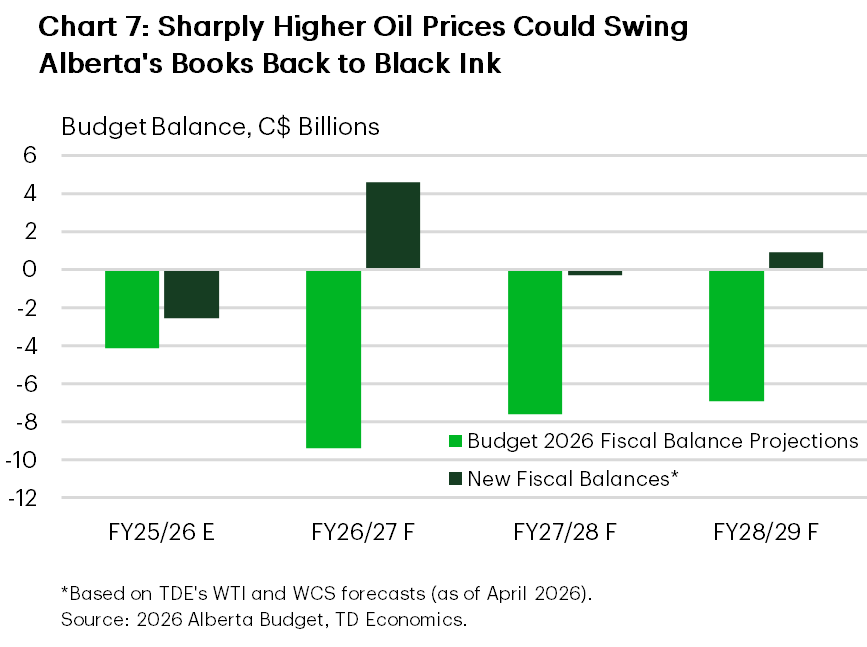
Alberta and Saskatchewan anchored their budgets in oil price assumptions that now look highly conservative. Chart 6 illustrates the stark divergence between our updated crude oil price forecasts and government benchmarks. In Alberta, the impact is particularly significant, with each $1/bbl increase in WTI prices raising revenues by $680 million. Should our baseline forecast materialize, it could drive a roughly $30 billion cumulative fiscal improvement between FY 2025/26 and FY 2028/29 (Chart 7). Saskatchewan faces a similar dynamic, though less pronounced considering the smaller sensitivity to oil prices. Under our oil price projection, the province’s deficit for this fiscal year could still be reduced by half while the cumulative revenue boost nears roughly $800 million over the four-year forecast horizon. Volatility in energy markets is here to stay, but the takeaway only a few months into the fiscal year is that fiscal risks for commodity producers are heavily skewed to the upside vis-à-vis 2026 budget targets, at least in the near-term. Looking out further, these provinces are not immune to structural headwinds – such as a cooling population and housing backdrop as well as ongoing trade and tariff uncertainty – that are likely to weigh on the broader revenue intake beyond resource royalties.
Newfoundland and Labrador, the only provincial government that has yet to table its 2026 budget, will likely incorporate higher oil prices into its projection. If so, the Province is almost certainly entering the fiscal year from a stronger starting point than would otherwise have been the case. This may offer scope to curb the province’s net debt-to-GDP trajectory which currently stands as the highest across jurisdictions.
What provinces might do with potential windfalls is equally as important as how they obtained them. Looking back to 2022, Alberta tabled a budget using conservative oil assumptions just ahead of onset of the Russia-Ukraine war. The ensuing oil price surge produced a record $11.5 billion surplus in FY 2022/23, far above the initial projection of a balanced book. At the time, most of the additional revenue was directed toward debt repayment and savings, with only limited incremental spending. This experience suggests that if energy prices remain elevated, today’s revenue windfalls are more likely to go toward repairing balance sheets than fuel further spending.
The experience was similar elsewhere. Saskatchewan underwent a sharp fiscal turnaround due to higher oil (and potash) prices following the Russia‑Ukraine shock. This flipped a planned deficit into a surplus, with most of the extra funds used to repay operating debt and only minimal one-time affordability measures. Newfoundland and Labrador also saw a rare surplus driven by higher oil prices, but the improvement mainly lowered the rate of increase in its debt rather than actual debt paydown.
Oil Shock Impact More Complex Elsewhere
While the impact of the oil shock on commodity producers is straightforward, effects elsewhere are more nuanced. In oil importing provinces, economic research has shown a boost to nominal GDP through higher prices, even as real economic activity is negatively impacted4. The 2021/22 and 2007/08 oil price runups bear this out, with nominal GDP expanding at a much sharper rate in both Ontario and Quebec than real GDP. We’d expect a similar dynamic this time around.
Nominal GDP is, of course, the more important metric for provincial revenues. Our March nominal GDP forecasts appear to more fully reflect the U.S./Israel–Iran conflict than provincial government projections, largely because of budget timings and differing planning assumptions used.
Nova Scotia and B.C. published forecasts before the conflict began and therefore did not capture its potential inflation impulse. Manitoba appears to treat conflict-related effects as a risk to its baseline. Ontario’s budget gives limited attention to oil, while Quebec assumes a short-lived conflict. Both provinces peg WTI at roughly $60/bbl on average this year, versus our assumption of $83/bbl.
All told, provincial governments, excluding commodity producers, were expecting aggregate nominal GDP growth to slow by about 0.8 ppts to roughly 3.5% this year. This would hold FY 2026/27 revenue growth to a soft ~3% in these regions, despite a stronger outlook for federal transfers.
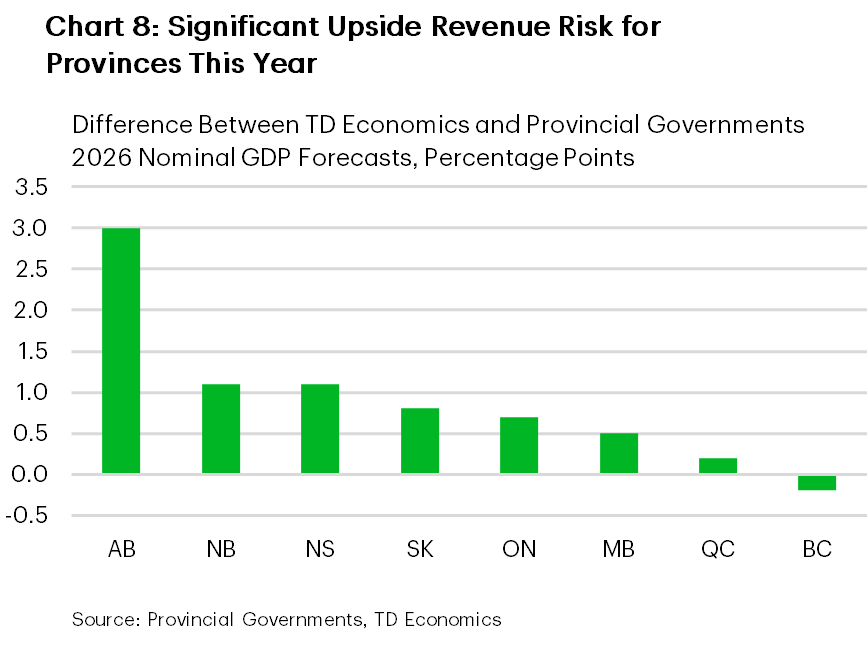
Our 2026 nominal growth forecasts are higher than provincial projections in most cases – sometimes materially (Chart 8). And, we’ve since upgraded our forecast for oil prices. As a result, we think there is upside risk to 2026 revenues in across Canada. Quebec’s published sensitivities imply a $200 million revenue bump if our stronger nominal GDP profile proves closer to reality. Ontario’s sensitivities would suggest a $900 million lift if we’re more on the mark, but the unique impacts from the war and recent government policies could eat into a potential boost. For instance, the Ontario government has made its gas tax cut permanent, leaving its provincial fuel tax rate among the lowest in Canada, but also impeding revenues from prices. Gold prices – a key export for Ontario – have also fallen after the onset of the war. Ontario’s real economy will also be disproportionately impacted, given its status as an energy importer. B.C. also produces publicly available sensitivities, but its nominal GDP forecast is roughly in line with ours.
Bottom Line
Provincial budgets this season reflect tighter fiscal room, with most governments opting for incremental, targeted measures over large new commitments. Capital spending remains a key near-term support but adds to already-rising debt and interest costs. Deficits are expected to linger over the next several years, although the oil price shock has tilted this calculus in favour of commodity provinces while complicating the outlook for energy importers, where lingering deficits and elevated debt burdens make fiscal positions more vulnerable to negative economic shocks.
Endnotes
- Harchaoui, T.M., and F. Tarkhani. 2003. “Public Capital and its Contribution to the Productivity Performance of the Canadian Business Sector.” Economic Analysis Research Paper Series Catalogue no. 11F0027MIE, no. 017, Micro-Economic Analysis Division. Ottawa: Statistics Canada.
- Ibid.
- Broadbent Institute, “The Economic Benefits of Public Infrastructure Spending in Canada”. Prepared by The Centre for Spatial Economics. September 2015.
- Moran, K., & Stevanovic, D. (2025). “Chocs macroéconomiques et finances publiques au Canada et au Québec” (2025RP-29, Projects Reports, CIRANO.) https://doi.org/10.54932/TPWR7272.
Disclaimer
This report is provided by TD Economics. It is for informational and educational purposes only as of the date of writing, and may not be appropriate for other purposes. The views and opinions expressed may change at any time based on market or other conditions and may not come to pass. This material is not intended to be relied upon as investment advice or recommendations, does not constitute a solicitation to buy or sell securities and should not be considered specific legal, investment or tax advice. The report does not provide material information about the business and affairs of TD Bank Group and the members of TD Economics are not spokespersons for TD Bank Group with respect to its business and affairs. The information contained in this report has been drawn from sources believed to be reliable, but is not guaranteed to be accurate or complete. This report contains economic analysis and views, including about future economic and financial markets performance. These are based on certain assumptions and other factors, and are subject to inherent risks and uncertainties. The actual outcome may be materially different. The Toronto-Dominion Bank and its affiliates and related entities that comprise the TD Bank Group are not liable for any errors or omissions in the information, analysis or views contained in this report, or for any loss or damage suffered.
Download
Share: