

The U.S. has been disruptor of itself. Whether it be to its own business cost structures and trade flows with tariff policies, or labor force dynamics with uncertainty and immigration policies.
And yet, it’s paying a lower economic cost relative to peer countries, giving rise to the title of this presentation: Tails we win, heads you lose.
I’ll explore the resilient features of the domestic economy, making sure to distinguish the narratives we hear from the data we see. In doing so:
- I’ll address why media and some market pundits have breathed a sigh of relief that economists got it wrong… inflation did not skyrocket and there is no recession. Some of this sentiment is feeding off the administration’s framing of the economy, but not all of it.
- To understand the American story is to understand the protagonist, who is the consumer.
- Lastly, I’ll review how trade deals have morphed into a bigger strategy around investment deals, which offer a new consideration for the outlook.
Did Economists Get It Wrong?
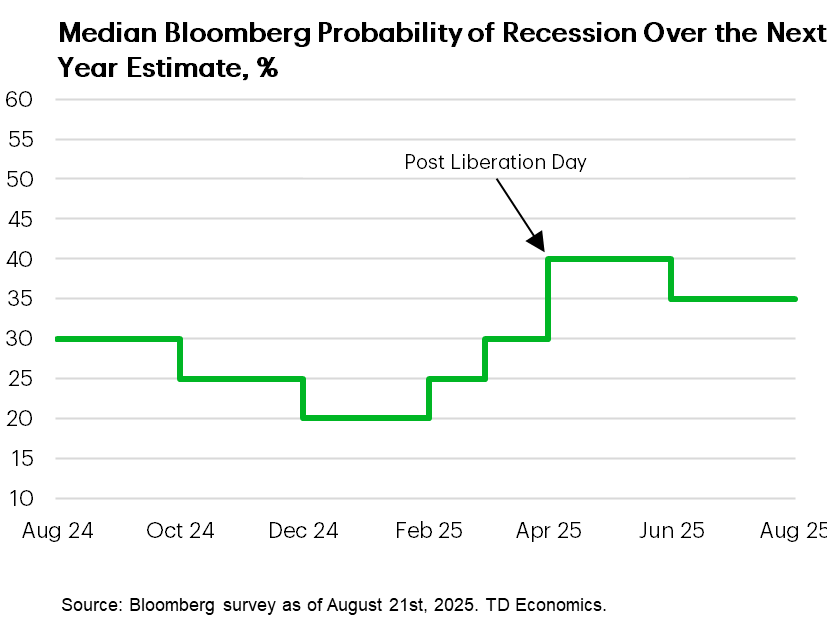
Starting with those who said that the abrupt and steep rise in tariffs would create a recession, these views hit a peak when President Trump announced reciprocal tariffs in early April on more than 90 countries, with tariff rates ranging from 10 to 50%.
Recession calls have since stabilized at a lower level but remain elevated. So, part of the relief within media commentary is that the worst case hasn’t played out. But that doesn’t mean the U.S. economy is strong or ignoring the twist and turns in domestic policy.
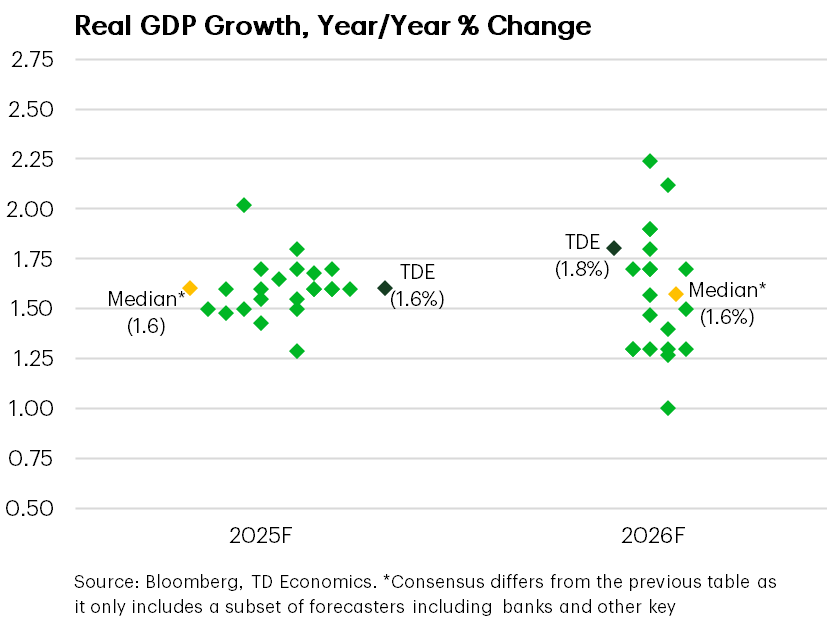
Major bank forecasters do not have a strong forecast this year or next, even within a wide distribution of views.
Remember an economy expanding sub-2% is a bit of unfamiliar territory for Americans. During Trump’s first administration, the average three-year growth rate was 2.7%, excluding the pandemic downturn. Biden put up the same figure during his tenure, excluding the outsized rebound following the pandemic.
We were never on board with a U.S. recession call, even at the height of uncertainty in early April, but did think the job market would struggle. We thought we had this part of the narrative wrong, until data revisions came out in July that squared the circle with the soft consumer spending patterns that were playing out.
Job Market Revisions Shatter Resiliency Narrative
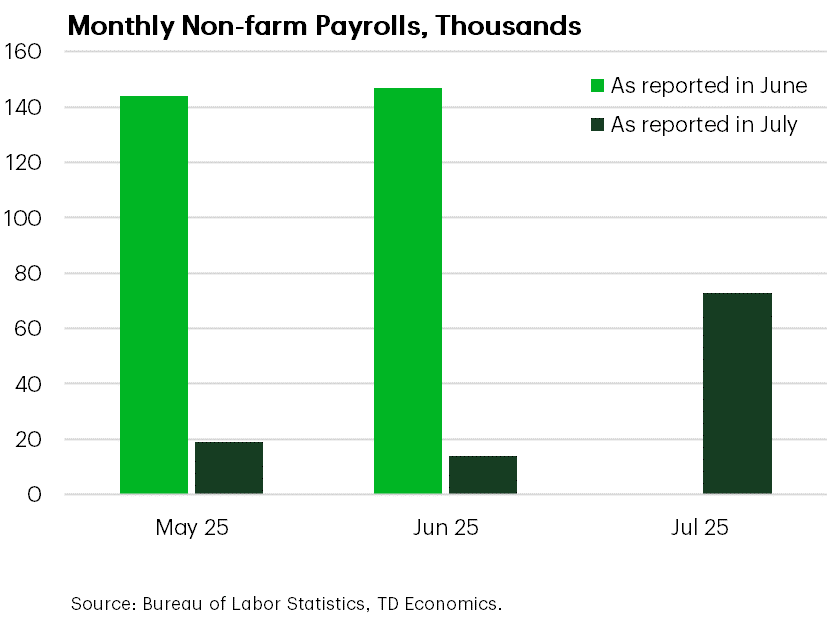
In terms of the labor market, here’s the before-picture that argued resiliency alonside the revisions that turned into the shot heard around the world. Revisions removed more than a quarter-million jobs from the two-month tally, throwing into question whether the job market was shrugging off tariff impacts and policy uncertainty.
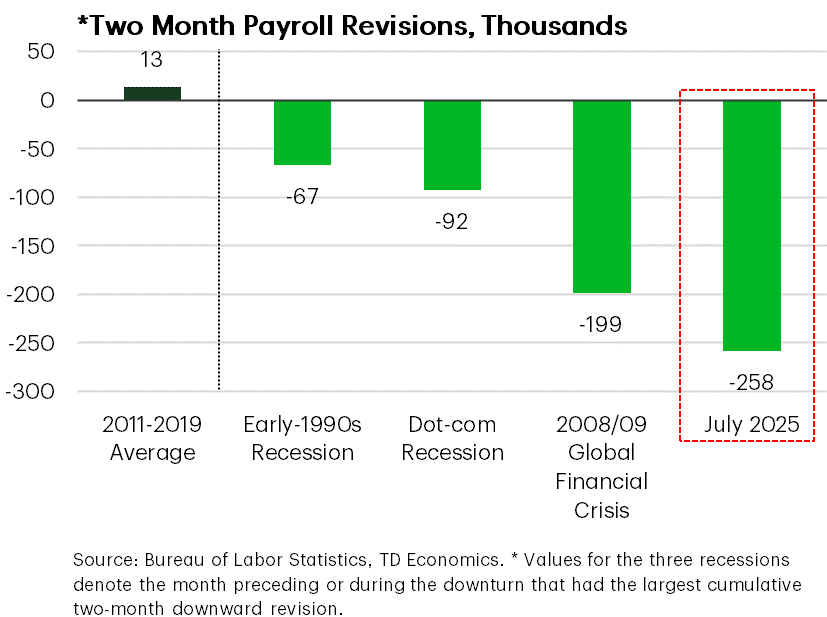
From a historical perspective, it was the largest two-month downward revision outside of the pandemic. This magnitude usually occurs with turning points in the cycle, when survey response rates are slower and the BLS must engage in higher estimation rather than rely on reported data. For instance, in the past two months, the initial survey response rate by companies was less than 60%, but jumped to 90% by the second iteration of the data.
If this is a true turning point in the cycle, it becomes all the more important that we become data-dogs and sniff every corner for information. That term, data-dog, is borrowed from Austan Goolsbee of the Chicago Fed to aptly describe what I’m going to do.
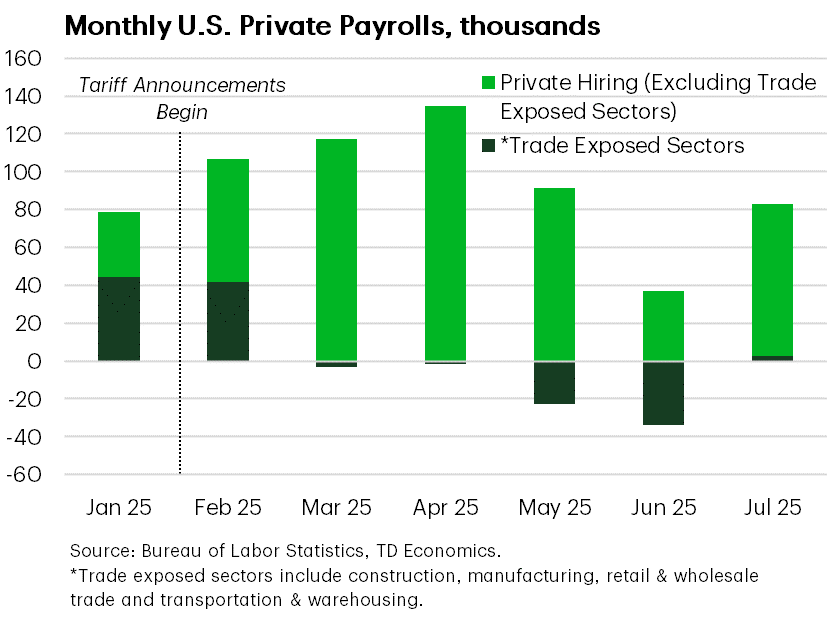
Jobs Within Trade Exposed Sectors Hit The Wall
In the past three months, hiring has averaged only 35 thousand. Maybe that’ll turn out to be a single soft data point for a point in time, but one way to find out is to dig into the questions of who is hiring, or not hiring, and is it pervasive.
Since the on-again, off-again tariff policies came into place in March and April, trade exposed sectors have hit the pause button, shown by the placement of the dark bars. Trade sectors were contributing about 40-45 thousand jobs per month in the pre-tariff world.
However, manufacturing has since shed 37 thousand jobs in three months, while other sectors have added minimal jobs that are about one-fifth to one-tenth of that sustained in better times.
If we focus instead on the brighter green bars, it leaves the impression that the rest of the private sector is doing well in producing jobs…
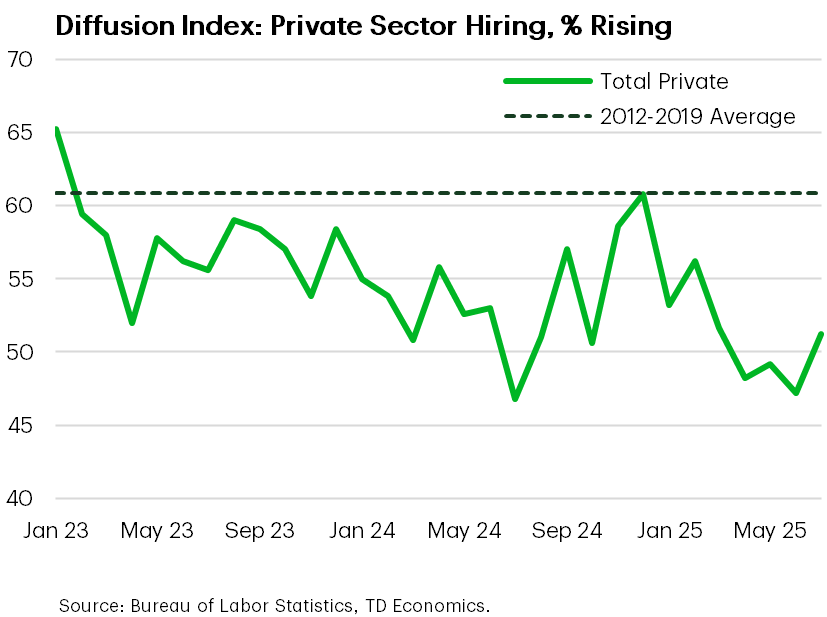
And Non-Trade Sectors Lack Breadth
…but this too is misleading.
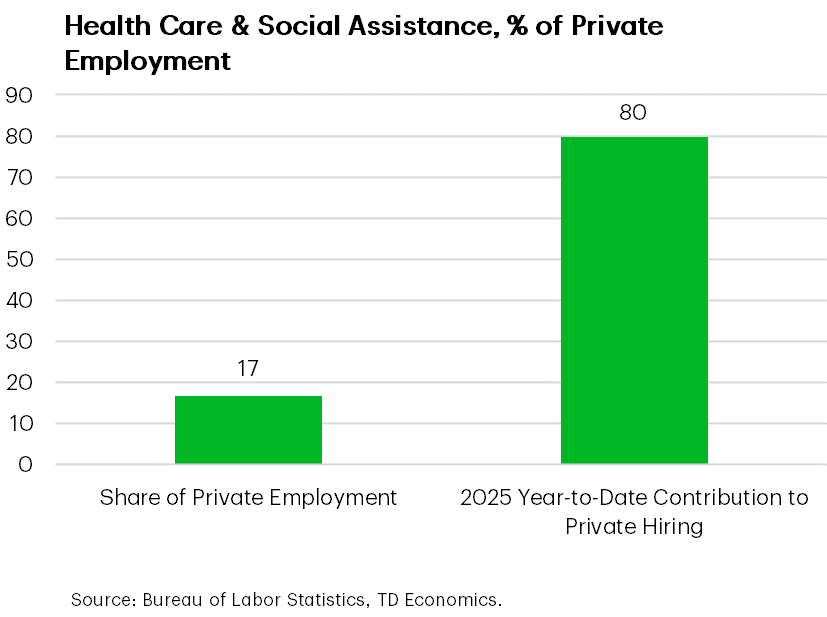
The share of industries hiring is well below average. This isn’t a new phenomenon relative to the past year, but the new element is that of those jobs in the private sector, 80 percent are in a single industry: health care and social assistance.
This industry is punching well above its weight because it represents only 17 percent of all private sector jobs.
This combination of a thinning in the number of jobs with less distribution across industries is a yellow flag on the consumer backdrop, even though jobs are still being created and unemployment insurance claims are low.
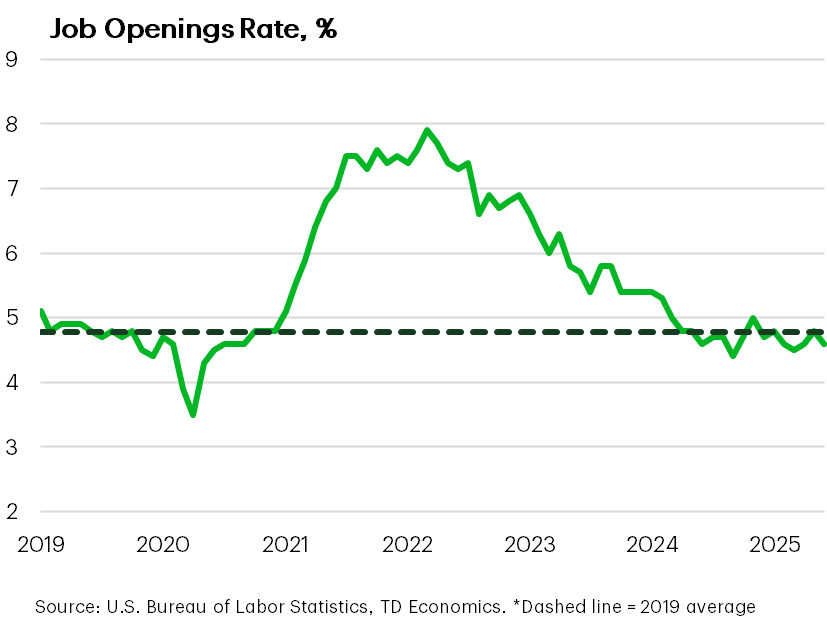
The Three Horsemen Of The Labor Market
Now let’s sniff into another corner of the labor market to see how supportive it is of this conclusion.
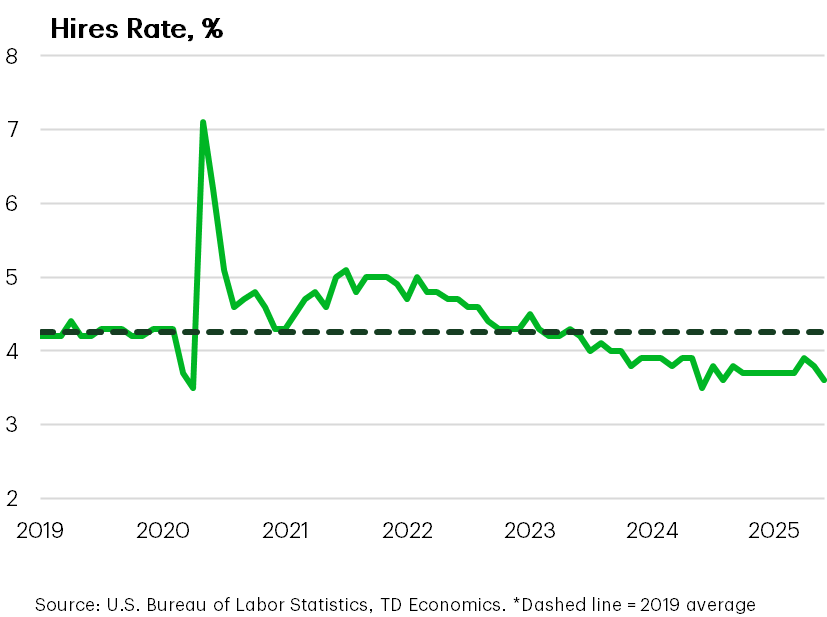
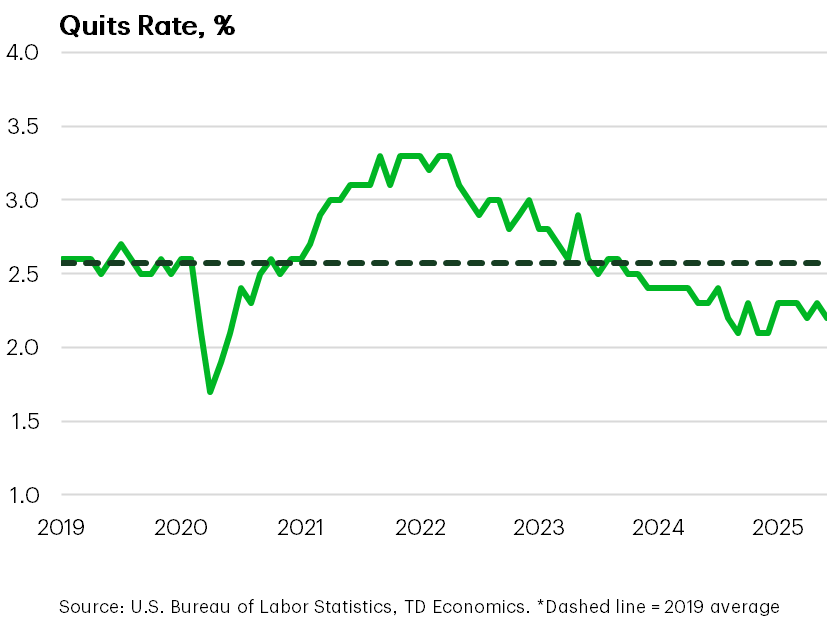
Austin Goolsbee has referred to the Four Horsemen of the job market to gauge underlying health. These graphs capture three of the four, with the unemployment rate being the fourth.
The issue with the unemployment rate these days is that the big and sudden shift in immigration is blurring the picture for analysts on the run rate for jobs and the labor force. Does an unemployment rate hovering in the 4.1 to 4.2 percent range really reflect a strong and healthy job market?
To answer, we can look at how confident employers are to seek new workers, and how confident workers are to leave jobs in search of better pay or an opportunity to better align their skills.
These graphs are discouraging to that narrative. There is low churn in the hiring and quit rates. However, this started before President Trump took office, so the dynamic can’t be solely attributed to policy upheaval. We can say that time has not altered its course since the year began. In fact, the soft trend has been extended, in the case of job openings, and worsened in the case of hiring and quit rates.
The hiring rate hasn’t been this low since post global financial crisis, and the quit rate sits at 2014-2015 levels. And not shown in these graphs is that the distribution of those unemployed 27 weeks or more is higher than what transpired during the 2001 tech boom-bust period.
So, if FOMC members are looking for a backdoor to lower interest rates in September as they balance risks to inflation versus jobs, this one is open wide.
Consumer Downshift Now Makes More Sense
The labor market analysis now helps us better understand the consumer performance.
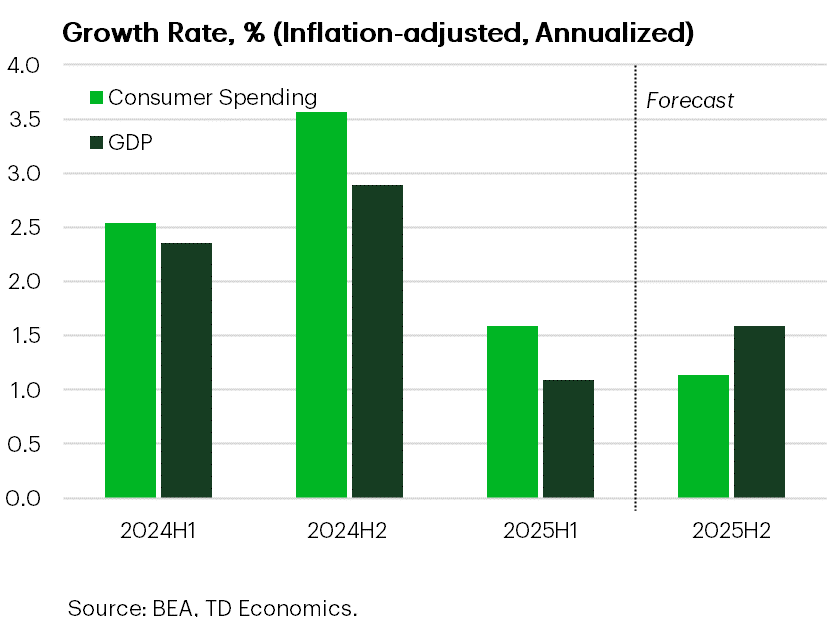
There’s been a major step-down in spending in the first half of the year. The consumer crawled at about a 1.5 percent annualized pace compared to nearly 4 percent in the second half of last year. For the remainder of 2025, we expect more of the same.
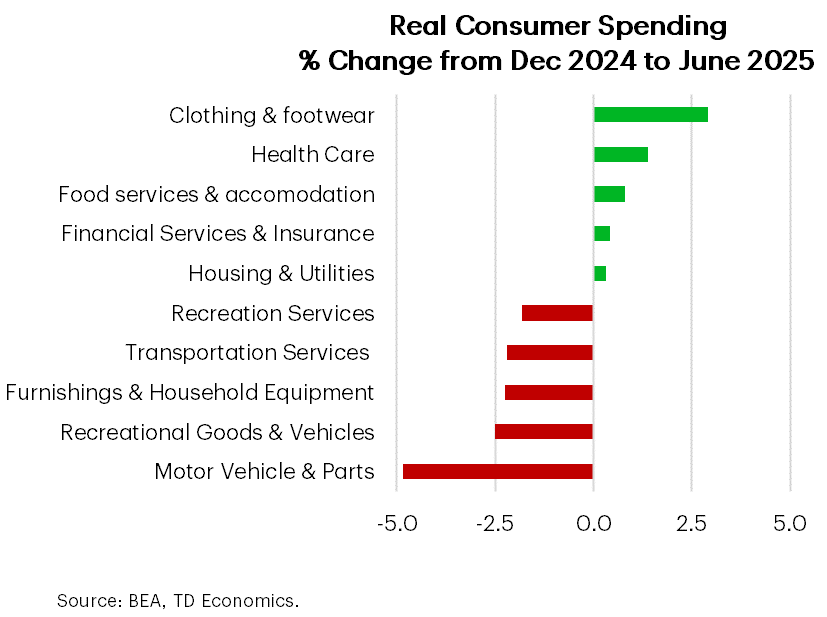
The loss in momentum has multiple factors behind it. Sectors with strong price growth have deterred consumers, while spending in discretionary areas, like recreation, have stumbled. In contrast, housing services, health care, and insurance have all advanced, but these are non-discretionary areas of spending where it’s harder to cut back. And even though food services and clothing made headway, the magnitude over a six-month period is unremarkable.
Not The Friendliest Of Consumer Environments
It hasn’t been an easy environment for consumers. A short-list of friction in the system extends from fewer job opportunities to rising goods prices to a level shift up in auto and credit card delinquency rates. In the case of credit cards, delinquencies have stabilized, but at a higher level relative to pre-pandemic.
Student loans are also returning to business-as-usual after prolonged pandemic relief programs. As of October of last year, past due payments started to get reported to credit bureaus. Then in May of this year, the Department of Education resumed involuntary collections on loans in default. And a final adjustment came when the OBBB Act enacted one of the most consequential reforms in decades. Millions of current borrowers will need to transition to new repayment plans, likely with higher monthly payments.
Student defaults have jumped to 8% from near-zero in a matter of months. That’s still below pre-pandemic levels, but TransUnion estimates that 3 million borrowers would reach default status by September, which would place the number of defaults above the pre-pandemic peak by the end of the year.
If it were just one of these areas of delinquencies shifting, it would only trim around the edges from a very large consumer base. But when they come together and are synchronized in timing, it’s a bigger headwind for households to accelerate spending.
And then there’s a housing sector that’s effectively in recession, with sales near the lows of the Global Financial Crisis. This chokes off the spending multiplier that comes with furnishings, renovation activity and other factors. In addition, mortgage rates have been over 6% since 2022, causing the share of mortgage debt with that rate or higher to be nearly 20% compared to 7% in 2022.
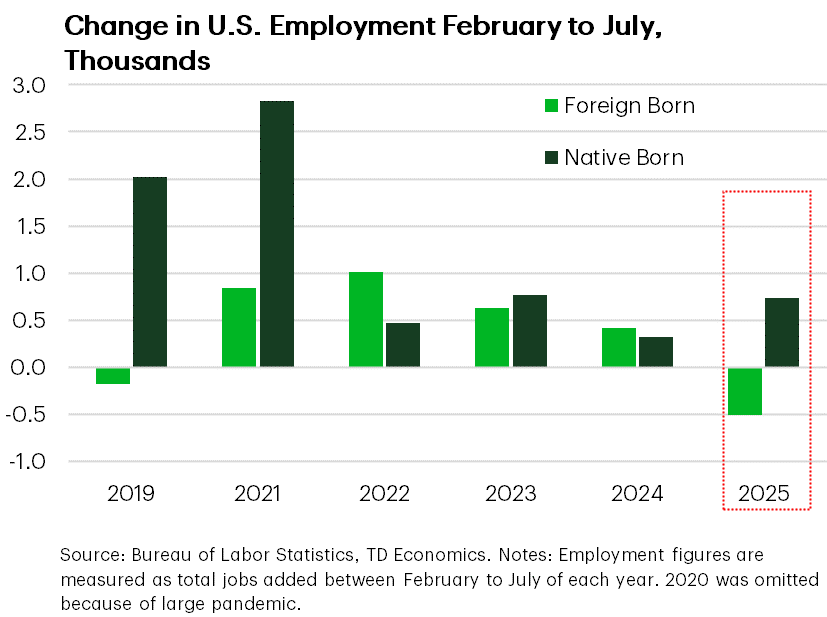
Lastly, and perhaps most importantly in the near term, restrictive immigration policy does have a nation-wide impact on spending. This is occurring through multiple channels, including less employment income. But I believe bigger effects are coming through two other channels.
Immigration = Fewer Crossings + Frozen Undocumented Workers
One is a collapse in the flow of immigrants coming over the border, and the other channel is what I call a stock effect. What happens when nearly eleven million undocumented workers fear continuing with their daily routines due to rising ICE arrests?
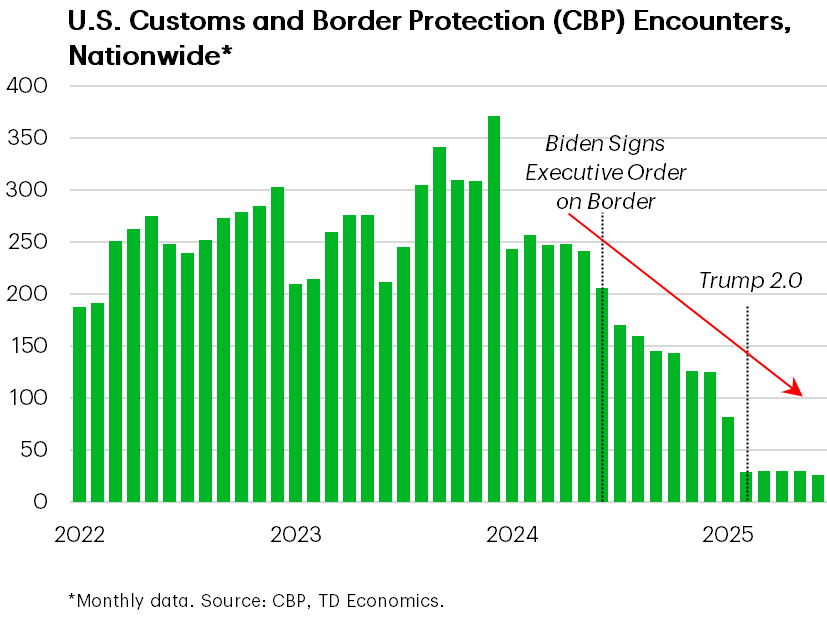
Let’s start with a collapse in the flow of immigrants.
In the first half of the year, there was more than a million fewer border crossings relative to last year. Extrapolating this through the rest of the year means that more than 2 million people are not available to spend on food, clothing, electronics, housing and so forth.
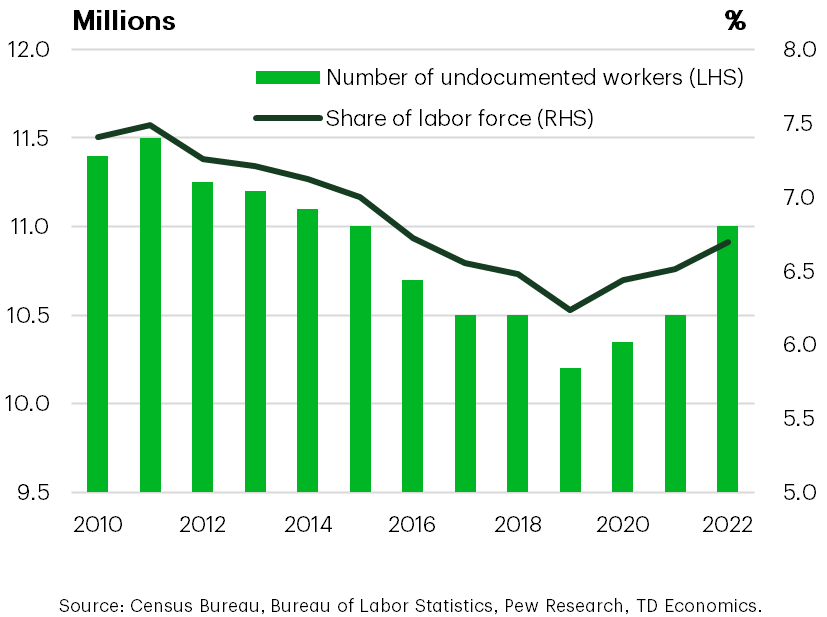
However, the bigger drag on spending is probably coming through the stock effect. Eleven million undocumented workers in American amount to more than 6% of the labor force, which is sizeable.
A share of these folks have likely scaled back vacationing, travelling to visit family, going to restaurants or amusement parks and so forth. We did an estimation of what this spending-paralysis could mean for broader America by looking at the average wage of undocumented workers, removing the amount that’s sent to families back home, which is about 15% of earnings, and also assuming spending still occurs in non-discretionary areas, like groceries, home utilities and so forth.
Measuring The Consumer Impact From Immigration Clamp Down
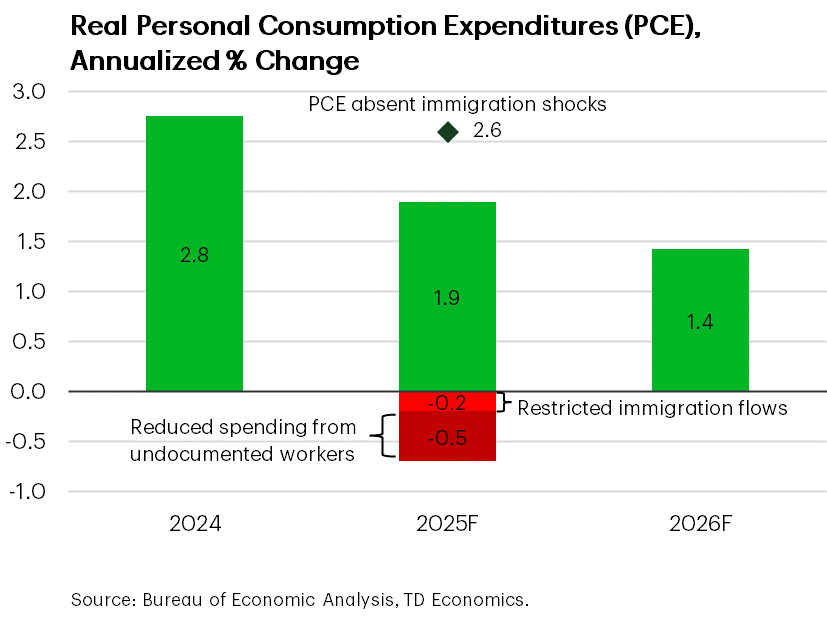
We estimate that about $148 billion would normally be available to be spend on discretionary purchases and a portion of this is likely to be in paralysis.
At the upper end of our assumptions, it could amount to a one percentage drag on consumer spending, but we’ve assumed half the effect in this graph.
So, when you combine the flow effect of immigrants not entering the U.S. with the larger stock effect of a spending freeze, we estimate that about 70 basis points has been shaved from consumer spending growth.
That sounds like bad news, but there’s a silver lining for those on the other side of this view. This means that the recent downshift in consumer spending may not reflect precaution or weak confidence across the entirety of America, but rather it may be reflective of a temporary and fading effect.
That’s because if immigration policy holds constant, the level of spending remains permanently lower than the counterfactual, but growth resumes off that new consumer base.
Like many aspects of this forecast, there’s a lot of “ifs”, requiring close monitoring and cross-checking of various data over time.
Where’s Inflation? Tariff Passthrough To Consumers Appears Small
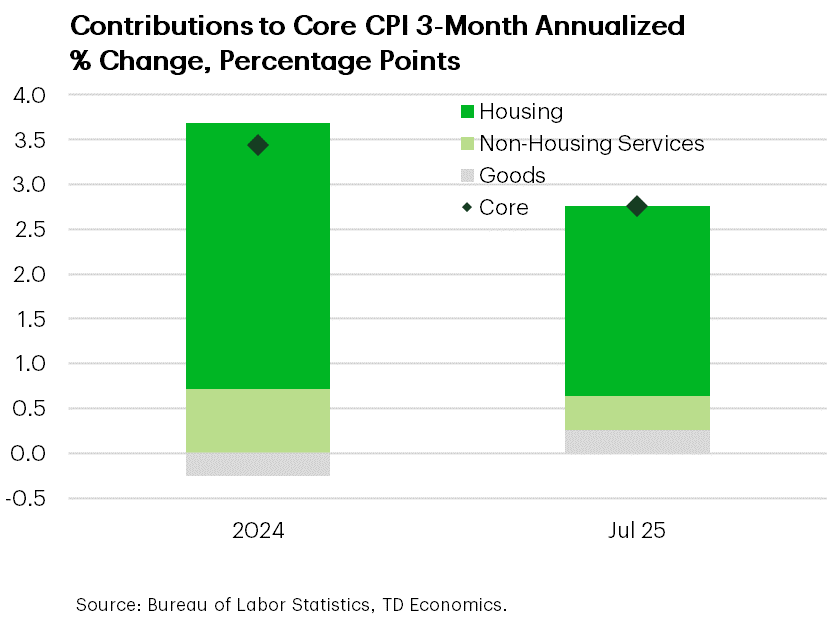
Shifting now to inflation dynamics, slower consumer spending certainty helps restrain the pricing power of firms. This graph leaves the impression there’s no issue with inflation. It’s trending lower than last year.
So let’s sniff around this one a little more.
Service prices are cooling from high levels shown by the two green bars. But because both have approached historical norms, further pressure on the downside will be harder to come by. In fact, the July CPI data showed exactly this, as non-housing service prices turned meaningfully higher. We hope this is just a data blip but, even so, the best-case scenario is that growth holds at current trends.
More relevant for the outlook is the grey bar, since tariffs uniquely affect goods prices. That flipped from negative to positive this year in its contribution to inflation. The impact remains small because it’s early days and many companies stockpiled inventories to mitigate immediate impacts on profit margins and customers.
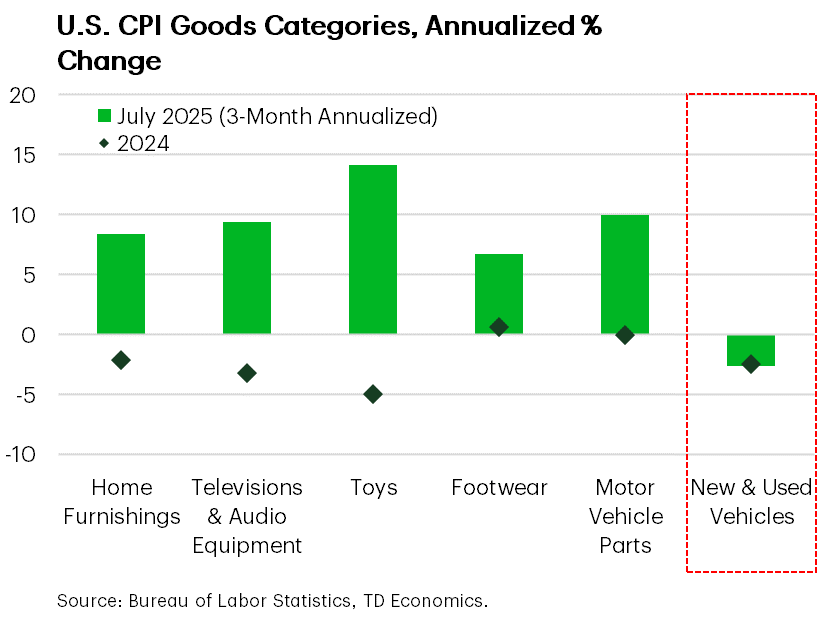
If we dissect this grey bar into its components, we see that new and used vehicle prices are the posterchild of this stockpile narrative, having fallen since the auto tariffs were first announced in March. However, this industry was the exception. Other tariffed products reflect strong price movements over the past three months in a departure of recent behaviors.
Keep in mind that this occurred with many starts-and-stops on tariffs. Except for China, most countries were tariffed at only 10% between April and early August, albeit higher tariffs were snaking through the system on section 232 items like steel, aluminum, and auto parts.
Even with the latest reciprocal tariff announcement in early August that set country ranges of 10-50%, it’ll take several months for the effects to make a fuller appearance in consumer prices. The executive order permitted a grace period until early October for anything loaded for transit by mid-August.
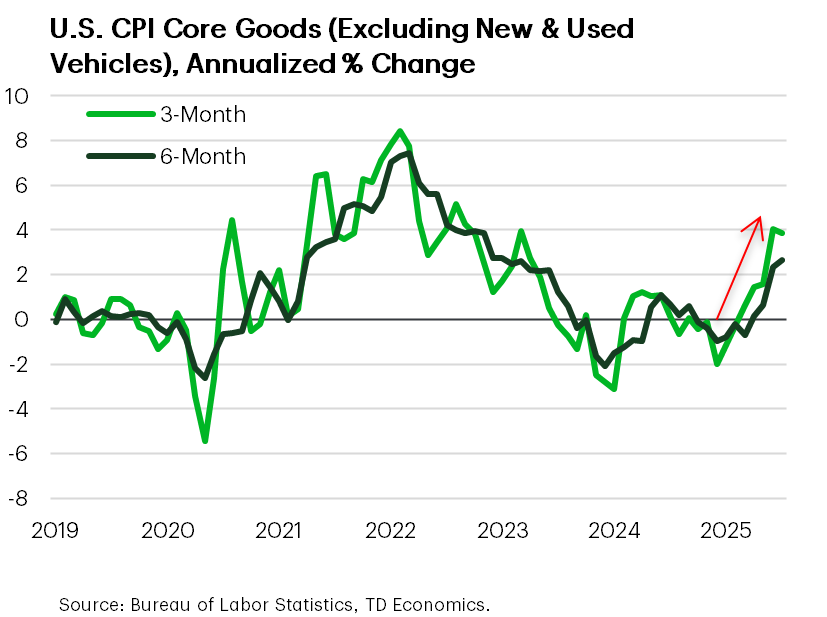
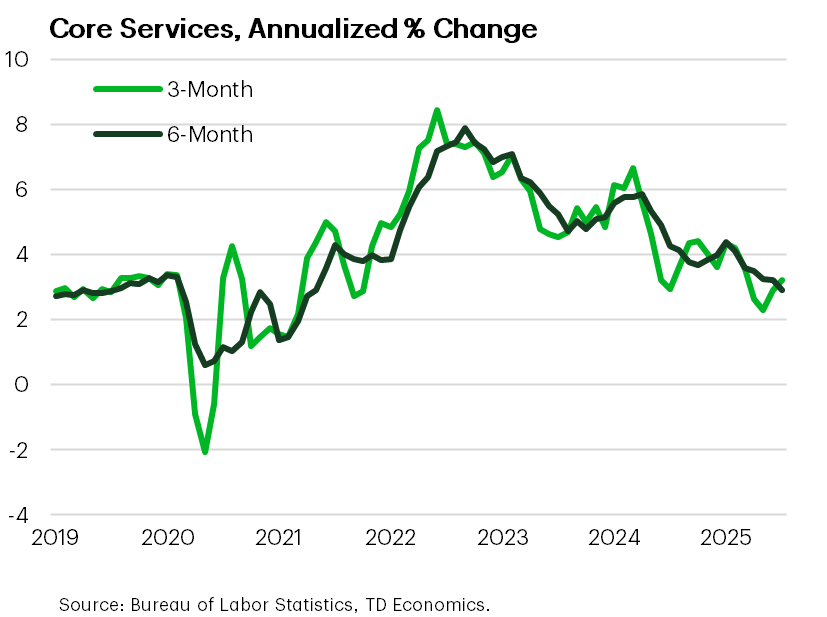
Downside To Services Limited Relative To Upside On Goods Prices
This is a more intuitive graph of the push and pull forces between services and goods.
Core services are usually the dominant influence at 60% of the total measure. But its effectively normalized to 2018-2019 growth (3.3-3.5%), leaving limited scope for another significant leg down.
That leaves overall inflation more susceptible to the future direction and magnitude of goods prices. And as the graph shows, the trend is not our friend on either a three or six-month basis.
As U.S. tariffs move into steady state (hopefully by the end of the year), it’s not realistic to think that tariffing 100% of imports outside of the USMCA will have no consequence to consumers. And we don’t even know what will happen to products currently shielded by the USMCA, should that protection be diminished or removed.
But at the end of the day, even if firms want to push prices higher, all roads lead back to the consumer and their ability to absorb those higher prices.
What's A Fed To Do?
What’s a Fed to do in balancing a mandate to maintain stable inflation and keep a job market in equilibrium? The decision to cut is only a question of when and not if.
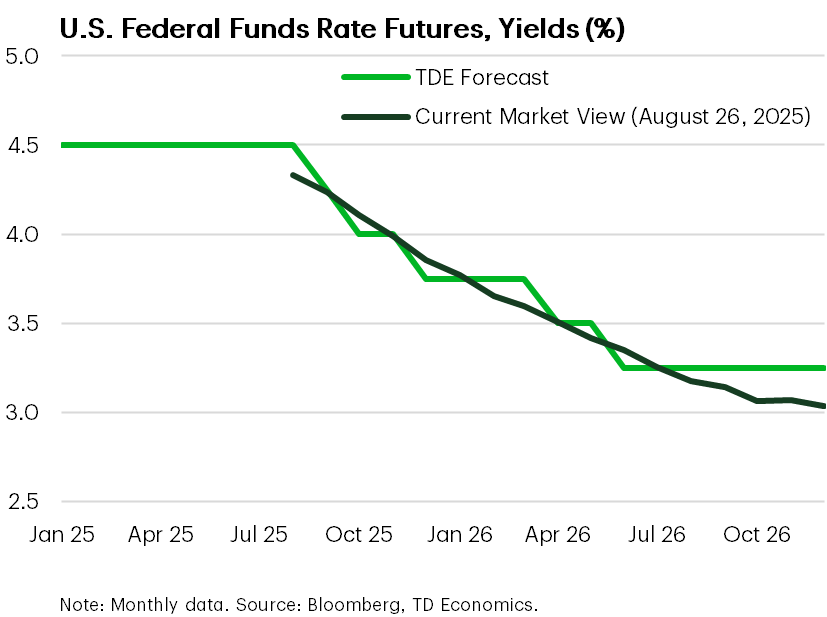
Since April, we’ve had a view that the Fed should cut three times this year, starting on September 17th. That went from being a highly out-of-consensus call, to very much in-consensus in recent weeks.
The reason we stood by that call was because regardless of whether you thought the U.S. would be in recession or just have lower and slower growth, a 4.50% policy rate is too restrictive and inconsistent with both of those scenarios.
Returning to a neutral rate of 3.25% by mid-2026 doesn’t ignore the risk of further pass through of tariffs into inflation, but it balances the nature of two-sided risks. This is particularly true if you believe the tariff impact will be largely a one-time level shift up in prices, which we do.
Governor Bowman and Waller came to a similar conclusion at the last FOMC meeting when they dissented in favor of a rate cut.
Powell’s speech at the Jackson Hole Conference also opened the door wider, when he acknowledged the slowdown was much larger than assessed a month ago.
And now Trump’s appointment of Stephen Miran to the FOMC board, if confirmed by the Senate, would further tip the scales in favor of getting to a neutral rate faster.
U.S. Progress On Trade “Deals” Reveals Broader Strategy
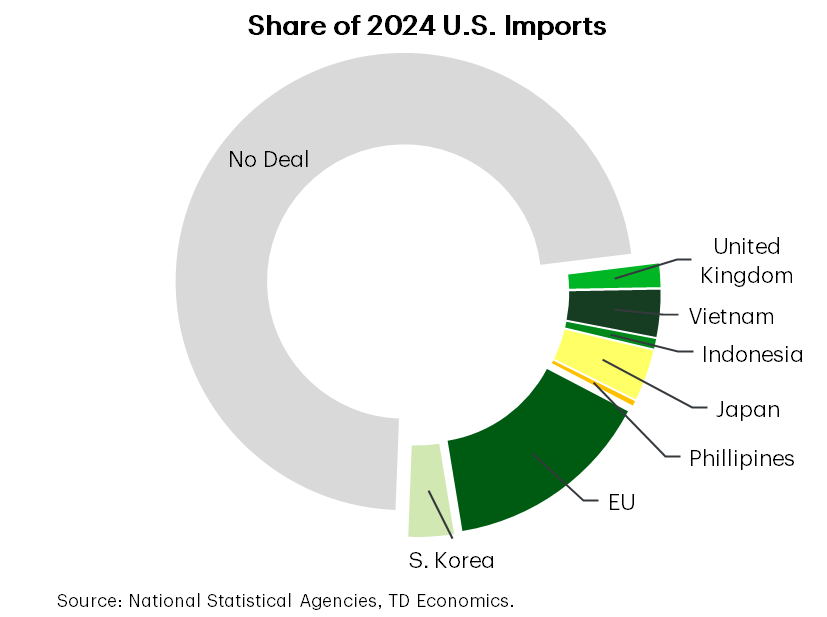
Let’s now take a look under the hood at those tariff deals that will set the course for the economy and inflation. So far, the administration has struck deals with countries that account for about 30% of U.S. imports.
A definite playbook has appeared that will likely come to define the big players of Canada, Mexico and China, captured by three components in the text box below.
- Regarding the first one on a “base rate”, this sometimes also includes export quotas.
- The UK is an example which negotiated a 10% tariff on autos up to a 100,000 annual car limit, after which subsequent cars are tariffed at 25%.
- In contrast, Japan, South Korea, and the E.U. negotiated a 15% tariff on new cars and parts, but no quota.
- Regarding the second point on investment or purchase commitments, so far the frameworks include a combined $1.5 trillion in U.S. energy, agricultural, aerospace, and shipbuilding projects.
Common Features in "Deals":
- A “base rate” on tariffs of 10-15% + requires no retaliation
- Purchase Agreements & Opening Markets to U.S. Exports
- (Some) Section 232 tariff relief
Trade Deals Include Investment Deals
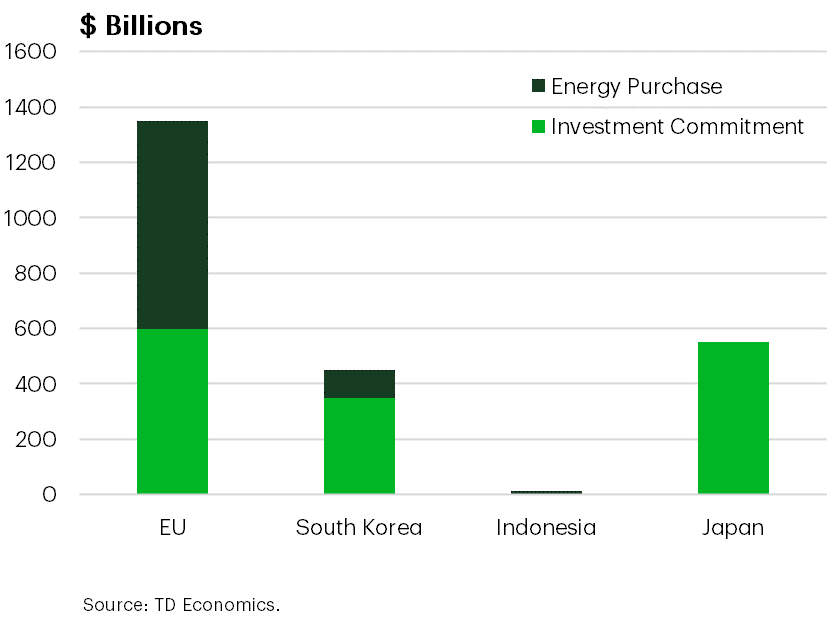
Most of these commitments come from the E.U., Japan, and South Korea, with the details still being worked out. The timeframes are generally thru 2028, coinciding with the end of Trump’s term. Even if only a fraction comes through, it creates upside to the U.S. economic outlook.
And then the third “deal-characteristic” is in how the administration is addressing section 232 tariffs, such as the 50% rate for copper, steel, and aluminum, with more to come on semiconductors and pharmaceuticals.
These are being negotiated on a piece meal basis by countries. For steel and aluminum, the U.K. received a modification that maintained the original 25% tariff, instead of 50%. The EU is still in negotiations, but they are aiming for a quota on steel and aluminum to get to a lower tariff rate.
To show how fluid this remains, steel and aluminum tariffs were in place in February at 25%, lifted to 50% in June, and then on August 18, the White House expanded the tariff list by an additional 407 products, where companies must ascertain the proportion of its value within the total product, while the remainder of that product remains subject to the recipricol or other applicable tariffs. Got it? You can imagine how complex this is to implement, let alone for businesses to have clarity on their future cost structures.
So, what does this look like from the lens of the U.S. government?
Tariffs Bringing In The Bucks For Government
We’ve repeatedly commented in prior notes that the administration was deliberately deploying tariffs as a means for a new and permanent revenue stream to fund government deficits. The premise holds, but we underestimated the base rate, which we thought would be closer to 10% rather than 15%.
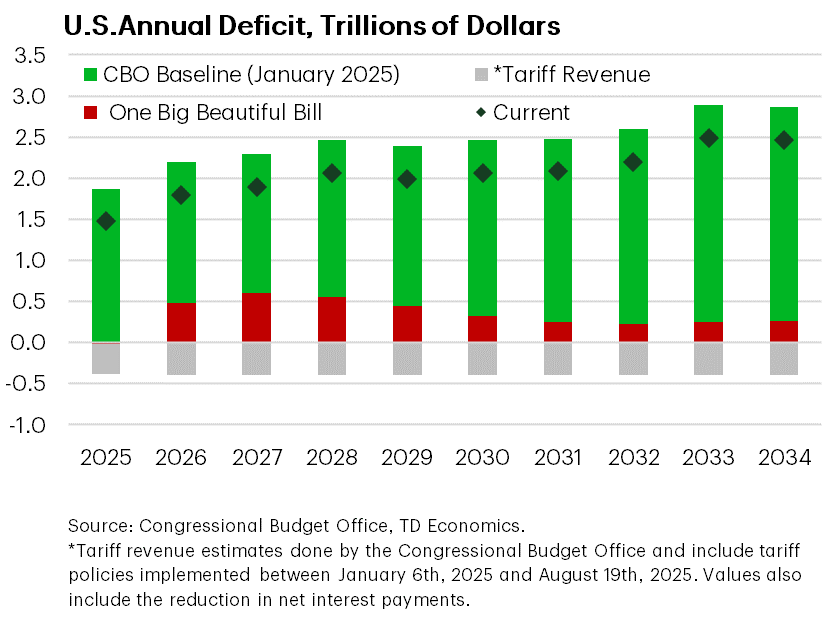
Tariff revenues this year could reach $350 billion, and there are estimates suggesting it gets as high as $500 billion next year. However, that would require no import adjustments by businesses, which is unrealistic.
The CBO makes a reasonable assumption that even with some trade diversion, the government still pulls in a tariff tally of $3.3 trillion over a decade. Applied directly on the debt would further reduce interest obligations by $700 billion over the decade.
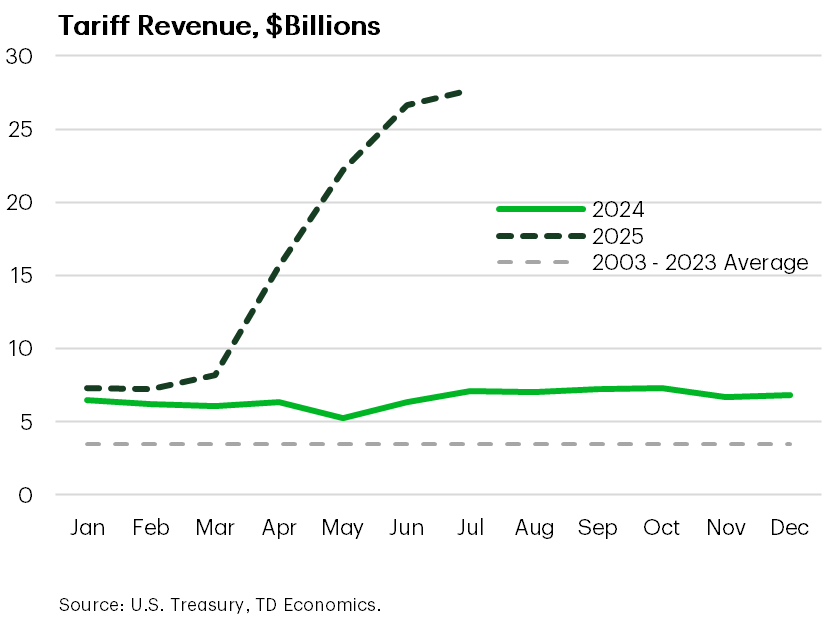
The net effect is shown in this graph on the right. The administration will have succeeded in offsetting the additional deficit created by the OBBB Act, and even a little bit more.
However, a deficit still exists and creeps up, shown by the dots, because there’s still big spend items on Medicare and Social Security that eat up about $36 trillion over the next decade. And this is probably why the administration is seeking new revenue paths that are unconventional for America.
An example is the deal struck with Nvidia and Advanced Micro Devices (AMD) to give the government 15% of their revenues from advanced chips shipments to China. This is effectively an export tax, and Treasury Secretary Bessent has noted that this provision could be a beta test for other industries.
However, this revenue stream can prove limiting or self-defeating for two reasons.
First, Chinese authorities have already advised domestic companies to not use Nvidia H20 chips, they are attempting to triple production of A.I. processors next year, and it is a country that has credibility in solving innovation shortfalls with speed...meaning, it’s probably only a matter of time before there’s catch-up to advance chip technology.
Second, if this export tax were to become a policy broadly applied to companies, it can further encourage trade and production diversion.
In another, but separate, nuance, Secretary Bessent has spoken about monetizing the government’s large balance sheet for other opportunities. This too is playing out in real time with the government becoming a stakeholder in companies like Intel.
Stepping back to look at the big picture, we’re witnessing a shake-up in the traditional role of the American government. They are finding new revenues through the business channel, rather than the household channel. Right now, it’s being done in a manner that’s specific and selective of companies. And it’s not unheard of for governments to take strategic stakeholder positions, like Canada acquiring TMX in 2018 to proceed with the twinning of pipelines.
But if it’s the government’s intention to scale up this model across industries and international firms, it would add complexity to the cost of doing business in the U.S., diminishing one of the key advantages in attracting global capital. And this could prove self-defeating in the long game.
Who’s Paying The Price For U.S. Policy Shifts?
Markets are taking this shifting economic paradigm in stride.
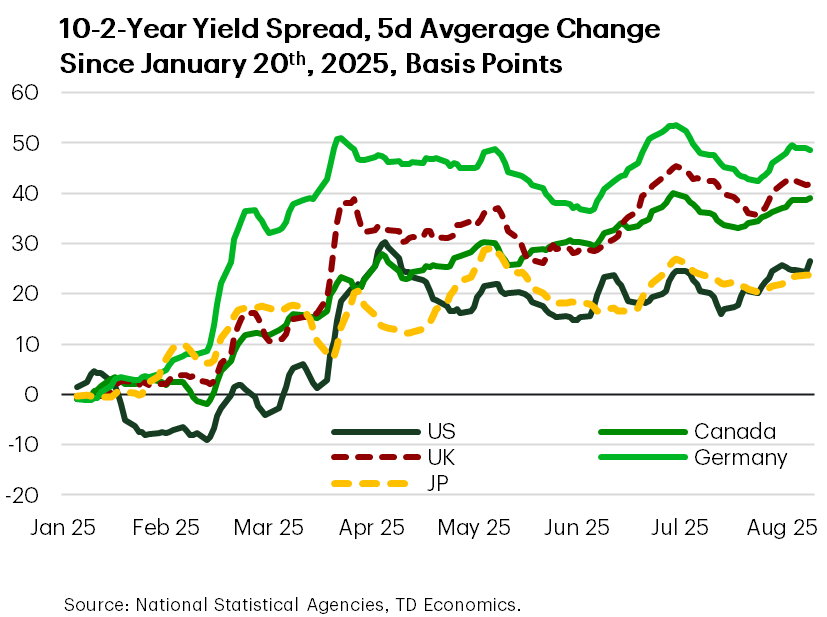
Structural mismatches in U.S. government finances combined with policies that up-end the global trade order have caused the Treasury 10-2 yield curve to steepen, but less than other regions.
The biggest spread-widening push occurred earlier this year within Germany, when the government announced a 900 billion euro fiscal program on defense and infrastructure. In contrast, America’s large deficit did not carry the same embedded risk within the term premium.
The U.S. has many other advantages over peers, like the market’s expectation for relatively stronger growth and the Treasury market’s safe-haven status. And then there’s some orchestrated effects keeping the term premium in check. These include the Treasury’s strategy to tilt issuance toward the front end of the curve, while holding the pool of longer-dated securities steady. They are also expanding the buyback program to retire older, less liquid long bonds.
The net effect is a shrinking pool of long-dated bonds, which helps cap those yields.
There’s always a risk of another leg up in the risk premium, but for now, this is yet another example of why the presentation is titled: tails we win, heads you lose.
At the end of the day, the U.S. is still perceived as having the advantage.
Businesses Look To Technology As The U.S. Growth Impulse
And here’s an example of that point.
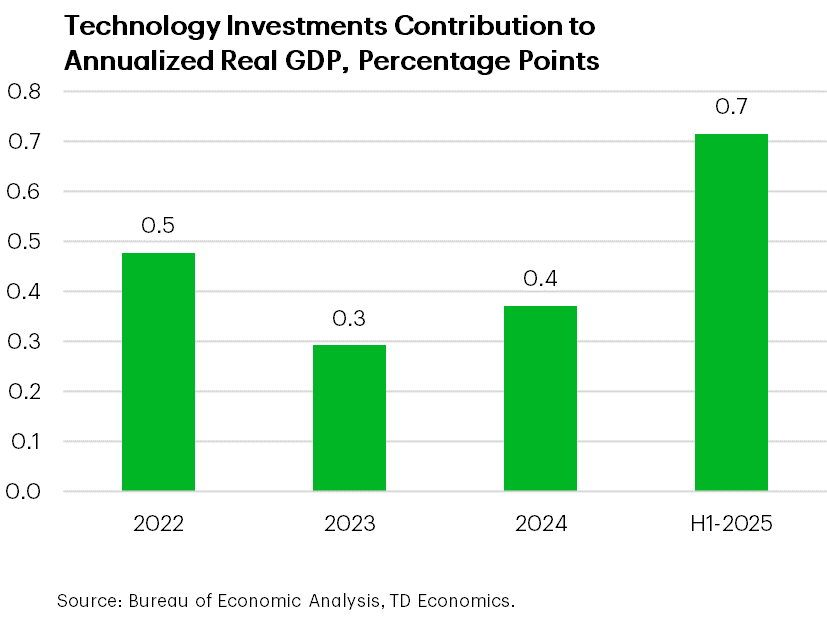
Business investment is a bright light in the American economy, where equipment spending jumped 10% through the first half of this year. It’s possible that some of this was tariff front-running, and some is capturing the animal spirits ignited by this administration’s support in A.I. and other technology.
However, some is also likely a legacy of past policies. Under the Biden administration, there was a surge in data centers and semiconductor facilities that broke ground under the 2022 CHIPS Act incentives. We knew that it would eventually lead to a big push on equipment spending as those projects neared completion – and that day has arrived.
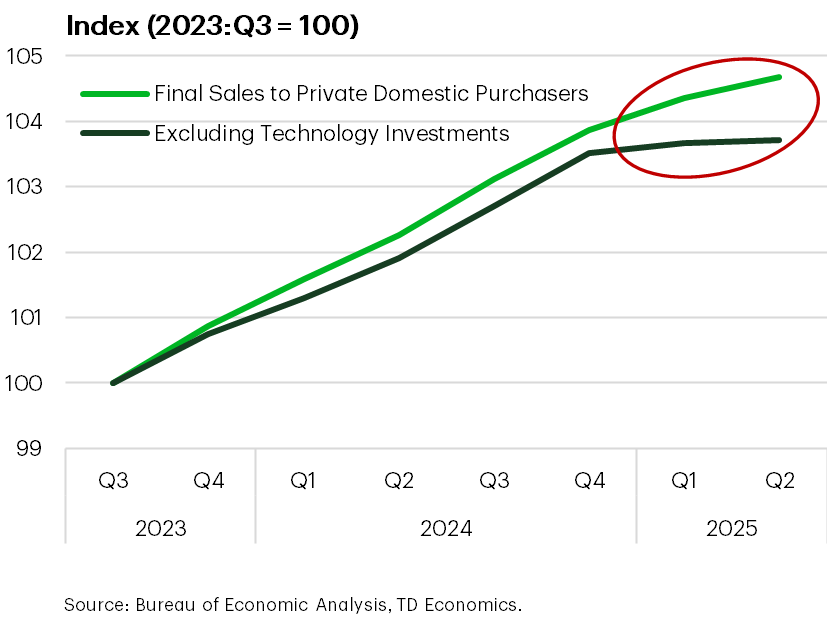
Putting all the pieces together, spending on tech-related projects added 70 basis points to GDP in the first half of this year, and will likely remain a persistent tailwind over the coming years.
However, the flip side of this view isn’t a-win for the U.S. Absent the contribution of technology investments, the entirety of domestic purchasers would have shown zero growth, captured by the black line in the first graph.
All This Agonizing Over The Forecast…For Not Much Difference!
And here’s the punch line of this presentation.
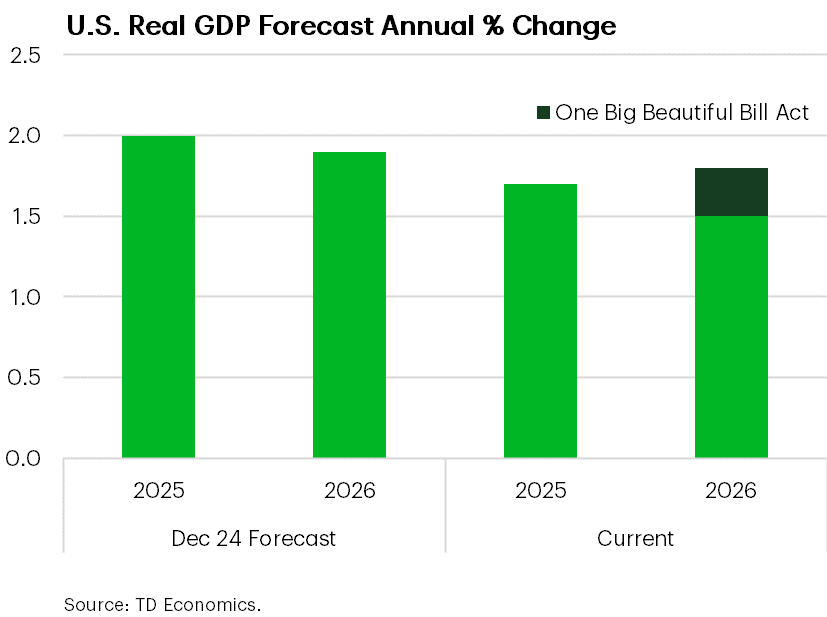
At the end of last year, we were forecasting a U.S. economic expansion of 2% this year and nearly the same in 2026.
We’ve spent eight months agonizing over every twist and turn in policies on trade, fiscal, and immigration – and it hasn’t resulted in a meaningful difference to the outlook!
Our 2025 forecast edged down by only 30 basis points, mainly due to slower consumer momentum. However, we believe a good portion is attributed to immigration policies, where the negative growth-effects will peter out over time.
Meanwhile, for 2026, we took into account higher tariffs on consumers, equivalent to a tax hike of 1% of GDP if half are passed on by businesses. But then we added back into the forecast a fiscal bump from the OBBB Act of 30-50 basis points in each of the next few years.
In the end, we’re nearly back to where we started for 2026, with a deviation of only 10 basis points, albeit the composition of growth-drivers differs.
This revelation became a career existential moment!
Disclaimer
This report is provided by TD Economics. It is for informational and educational purposes only as of the date of writing, and may not be appropriate for other purposes. The views and opinions expressed may change at any time based on market or other conditions and may not come to pass. This material is not intended to be relied upon as investment advice or recommendations, does not constitute a solicitation to buy or sell securities and should not be considered specific legal, investment or tax advice. The report does not provide material information about the business and affairs of TD Bank Group and the members of TD Economics are not spokespersons for TD Bank Group with respect to its business and affairs. The information contained in this report has been drawn from sources believed to be reliable, but is not guaranteed to be accurate or complete. This report contains economic analysis and views, including about future economic and financial markets performance. These are based on certain assumptions and other factors, and are subject to inherent risks and uncertainties. The actual outcome may be materially different. The Toronto-Dominion Bank and its affiliates and related entities that comprise the TD Bank Group are not liable for any errors or omissions in the information, analysis or views contained in this report, or for any loss or damage suffered.
Download
Share this: