Assessing the Stress from the Russia - Ukraine Conflict
James Orlando, CFA, Senior Economist | 416-413-3180
Brett Saldarelli, Economist | 416-542-0072
Date Published: March 18, 2022
- Category:
- Canada
- Financial Markets
Highlights
- Financial and commodity market volatility resulting from the Russia - Ukraine conflict has begun to subside as volatility metrics have retreated from their 2022 highs. This past week, many of the world’s largest stock indexes posted strong gains, while oil declined to around $100 per barrel.
- Bond yields, after initially providing investors with a safe haven, have increased substantially as central banks have committed to tackling inflation by signalling an aggressive policy rate hiking cycle.
- All told, the current conflict has provided financial markets with an obstacle which they appear to be navigating. Should the situation in the Ukraine intensify, it could increase financial market stress not just in Europe, but globally, with implications on the broader financial system..
Equity Markets
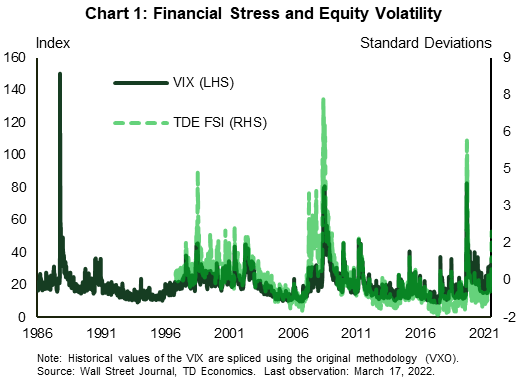
- After reaching record highs in 2021, North American financial markets have gotten off to a rocky start to the year. The S&P 500 is down 8.0% from its peak in early January, even after gaining 4.9% over the past week. The decline, while swift, was more muted than recent episodes of equity market declines. This includes the Global Pandemic in 2020, which saw the S&P 500 decline by 33.9% in just 33 days. As a historical comparison, during the Gulf War in 1990, the S&P 500 declined by 14.6% between July and October but regained its previous high by February of the following year. The heightened volatility had been reflected in the Volatility Index (VIX) which reached an intraday high of 37, but has subsided steadily over recent trading sessions, although it remains above historic norms. Moreover, our Financial Stress Index reached levels last seen in April of 2020 (Chart 1). Comparatively, in Canada, the S&P TSX has posted a 2.6% gain for the year, in part due to the strength of the energy sector, which has gained 26.5% on the back of rising oil prices.
- Across the pond, the Euro STOXX 50 Volatility Index has retreated significantly over the past two weeks, but remains at elevated levels. In addition to heightened financial market volatility, systemic stress indicators from the European Central Bank and the Banque de France had increased sharply since the beginning of the year, but remain below the heights experienced during the 2020 Global Pandemic and European Sovereign Debt Crisis. The moderation in financial market volatility is reflected in the Euro STOXX which has gained 5.5% over the past week, but is still down 11.4% from its 2022 peak. Elsewhere in Europe, the FTSE 100 gained 3.2 % over the last week and is now down just 3.7% from its 2022 highs. The most severe decline can be found in the MOEX Russia Index, which has declined by 36.2% from its 2022 high prior to trading being halted.
- The longer the Russian conflict persists, the greater the downside for global equity indices. This can be illustrated by both the Asian Financial Crisis in 1997 and the European Sovereign Debt Crisis that began in 2010. The Asian Financial Crisis saw multiple stock indexes in Asia decline by more than 60%. The declines cascaded across Europe and into the U.S., with the Euro STOXX falling by 33.9%, while the S&P 500 lost 19.3%. A similar experience occurred during the European Sovereign Debt Crisis when the Euro STOXX fell 32.3%, followed by a 19.4% decline in the S&P 500.
Foreign Exchange
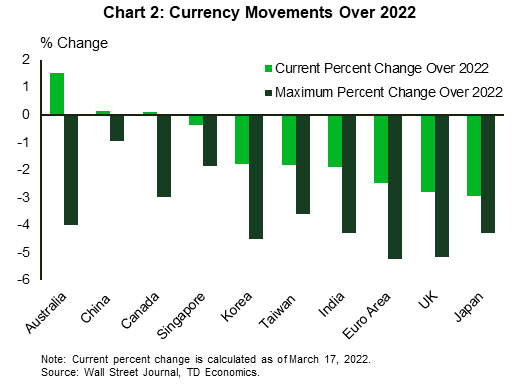
- While equity markets have seen sharp movements to begin the year, currency markets have been more muted for most major currencies. The euro and the pound have depreciated by 2.5% and 2.8%, respectively, while commodity focused currencies such as the Canadian and Australian dollars have changed by less. The Canadian and Australian dollars have gained 0.1% and 1.5%, respectively since the beginning of the year (Chart 2). The modest changes are surprising given the fact that oil has increased 25.9% in 2022 and other commodities are seeing robust gains. The most notable movement in currency markets is the Russian ruble, which has depreciated by 27.2%.
Credit Spreads
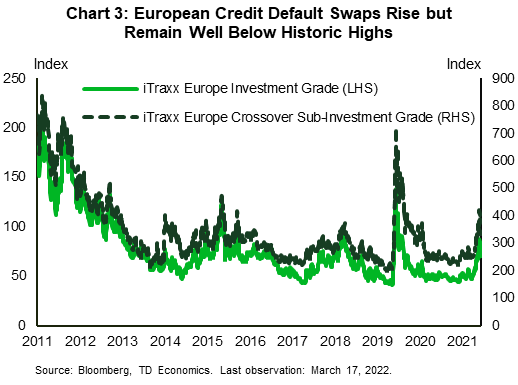
- Credit conditions in Europe have undoubtedly tightened in recent weeks, as indicated by European credit default swaps (CDS). Both investment grade and sub-investment grade CDS have increased notably since the beginning of the year, but remain well below the heights of the recent Global Pandemic and Sovereign Debt Crisis (Chart 3).
- In the U.S., credit spreads started to drift higher, but reversed course this past week. In the investment grade space, the BBB spread declined by 13 basis points to 1.72%, and is 64 basis points higher than the beginning of the year. While this is well below the levels experienced at the onset of the 2008 Global Financial Crisis (GFC) and the 2020 Global Pandemic, the recent levels of the BBB spread are the highest recorded since July 2020. In the non-investment grade space, the decline in spreads has been more notable with the BB and CCC spreads declining by 31 and 21 basis points to 2.6% and 7.8%, respectively. Even with the recent decline, spreads are on par with levels last seen at the tail end of 2020.
Sovereign Bond Yields
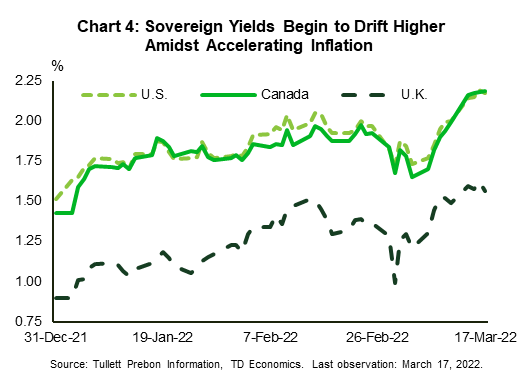
- Bond yields in both the U.S. and Canada have provided investors with a mixed bag. After a swift increase to start 2022, which saw yields in both the U.S. and Canada increase just over 50 basis points, in part due to expectations of tighter monetary conditions, both fell around 30 basis points from their 2022 highs, before reaching new heights over the past week (Chart 4). The recent fluctuations in yields reflect investors moving between flight to safety and uncertainty over rising inflation.
- The story in Europe parallels that of North America as government yields in the UK and Germany have increased markedly over the past two weeks, gaining 36 and 46 basis points after posting sharp declines. The strong uptick in Germany yields is in part due to the European Central Bank’s plan for a faster pace of tapering under its Asset Purchase Programme, while yields in the UK are adjusting to the Bank of England’s withdraw of monetary stimulus.
Short-Term Liquidity and Bank Funding
- Another gauge of tightening financial conditions are inter-bank lending rates. In Europe, the 3-month Euribor has increased a modest 8 basis points since the beginning of the year, which is significantly lower than the 33 basis point increase at the beginning of the 2020 Global Pandemic and the 98 basis point increase at the onset of the European Sovereign Debt crisis in 2010.
- In North America, the 3-month LIBOR OIS spread and the Commercial Paper to OIS spread can provide a gauge of stress in the financial system. Both spreads have increased since the beginning of the year, but neither have approached worrisome levels. In 2008, the LIBOR-OIS spread reached a peak of 365 basis points while the Commercial Paper spread peaked at 284 basis points. Spreads became elevated again in 2020, with the LIBOR OIS and Commercial Paper OIS spread reaching 140 and 244 basis points, respectively. This will be an area for central banks to watch, as elevated funding rates would require swift action to ensure proper market functioning.
- This paper will be updated regularly when instances of financial stress appear.
Table 1: Equity Markets
| Country | Current Drawdown | Max Drawdown Over 2022 | Drawdown During Global Pandemic | Drawdown During Global Financial Crisis | Drawdown During European Debt Crisis | Drawdown During Oil Price Shock 2015 | Drawdown During Asian Financial Crisis |
| US: S&P 500 | -8.0 | -13.0 | -33.9 | -56.8 | -19.4 | -14.2 | -19.3 |
| Canada: S&P/TSX Composite Index | n/a | -4.6 | -37.4 | -49.8 | -21.7 | -24.4 | -31.8 |
| UK: FTSE 100 | -3.7 | -9.3 | -34.9 | -47.8 | -18.8 | -22.1 | -24.8 |
| Euro Area: Euro STOXX Price Index | -11.4 | -20.3 | -37.9 | -61.8 | -32.3 | -27.4 | -33.9 |
| Australia: S&P/ASX 300 Index | -4.6 | -10.0 | -36.8 | -54.6 | -22.5 | -19.1 | -17.3 |
| Japan: Nikkei 225 Average | -9.1 | -15.7 | -31.3 | -61.4 | -28.0 | -28.3 | -37.7 |
| China: Shanghai-Shenzhen 300 Index | -14.2 | -19.4 | -16.1 | -72.3 | -41.0 | -46.7 | n/a |
| Hong Kong: Hang Seng Index | -13.9 | -26.2 | -25.3 | -65.2 | -34.9 | -35.6 | -60.1 |
| Korea: KOSPI Index | -9.9 | -12.5 | -35.7 | -54.5 | -25.9 | -15.8 | -64.7 |
| Taiwan Stock Market | -5.8 | -9.2 | -28.7 | -58.3 | -27.5 | -25.7 | -45.9 |
| Singapore: Straits Times Index | -3.5 | -8.5 | -31.9 | -62.4 | -23.7 | -28.5 | -60.9 |
| India: Nifty 50 Index | -5.6 | -13.4 | -38.4 | -59.9 | -28.0 | -22.5 | -37.5 |
| Russia: MOEX Russia Index | -36.2 | -46.9 | -34.4 | -73.9 | -32.4 | -17.9 | n/a |
Disclaimer
This report is provided by TD Economics. It is for informational and educational purposes only as of the date of writing, and may not be appropriate for other purposes. The views and opinions expressed may change at any time based on market or other conditions and may not come to pass. This material is not intended to be relied upon as investment advice or recommendations, does not constitute a solicitation to buy or sell securities and should not be considered specific legal, investment or tax advice. The report does not provide material information about the business and affairs of TD Bank Group and the members of TD Economics are not spokespersons for TD Bank Group with respect to its business and affairs. The information contained in this report has been drawn from sources believed to be reliable, but is not guaranteed to be accurate or complete. This report contains economic analysis and views, including about future economic and financial markets performance. These are based on certain assumptions and other factors, and are subject to inherent risks and uncertainties. The actual outcome may be materially different. The Toronto-Dominion Bank and its affiliates and related entities that comprise the TD Bank Group are not liable for any errors or omissions in the information, analysis or views contained in this report, or for any loss or damage suffered.
Download
Share this: