Assess the Stress: Checking In On The Health of Canadian Businesses
Beata Caranci, SVP & Chief Economist | 416-982-8067
Ksenia Bushmeneva, Economist | 416-308-7392
Date Published: January 12, 2021
- Category:
- Canada
- Commodities and Industry
Highlights
- The COVID-19 pandemic poses a major challenge for Canadian business, putting many firms in a life and death situation. For nearly a third of firms revenues declined by 30% or more, with small and medium businesses especially hard hit.
- Given the severity of the crisis, all levels of government have rolled out significant financial support measures. These have helped many businesses to stay afloat despite large revenue shortfalls.
- Still, even as fiscal taps remain open, many firms, already weakened by the first bout of the health crisis, will find it harder to survive the second wave. The start of vaccine distribution offers a glimmer of hope, but many businesses are running out of time. Of those that do survive, higher debt burdens are likely to weigh on profitability and growth for years to come.
- Surprisingly, even as other indicators are flashing red, business insolvencies have remained relatively benign last year. Depressed insolvency rates may offer more reasons for concern than optimism, as it likely captures increased reliance on borrowed funds as well as higher business exits.
- Only time will show the true rate of business survivorship and scarring, which will only become evident when temporary financial supports recede along with the pandemic.
- Significant business exits during the pandemic will leave a void that will need to be filled by new businesses once the crisis is over. Elevated personal saving and lower commercial rents should help new businesses to start on a solid footing.
The COVID-19 pandemic poses a major challenge for Canadian business, putting many firms in a life and death situation. For more than half of firms, revenues fell last year, with nearly a third experiencing declines of 30% or more.1 Nearly one-in-five firms state that they cannot survive at their current level of revenue for more than six months.
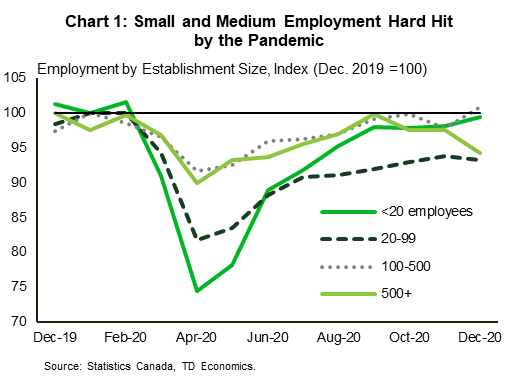
Small and medium businesses have been especially hard hit due their higher representation in industries most impacted by the pandemic (such as retail, transportation, and accommodation). As a result, small and medium firms (those with less than 100 employees) have shed relatively more jobs and have yet to recover to their pre-crisis levels of employment. Payrolls of their larger counterparts are in a comparatively better position (Chart 1). Smaller firms have an added vulnerability related to lower liquidity and fewer sources of financing relative to large companies. This is compounded by being less likely to have the resources and infrastructure needed to sell goods online, which has been paramount in the current crisis.
Given the severity of the crisis, governments at both the federal and provincial levels have rolled out significant financial support measures targeted to small and medium businesses, including rent relief, tax deferrals and grants. These have helped many businesses to stay afloat despite revenue shortfalls. Still, many will find it harder to survive the second wave of the pandemic. Of those that survive, higher debt burdens are likely to weigh on profitability and growth for years to come. True rates of survivorship and scarring will be evident when the temporary financial supports recede alongside with the pandemic pressures under vaccine distribution.
Debt, Revenue and Time That’s Running Out
Various surveys shed light on small business finances during the current health crisis. According to the Canadian Federation of Independent Business (CFIB), three quarters of small businesses have accumulated additional debt as a result of the pandemic, with an average value of $135,000.
However, many firms may be reaching a limit on their ability to layer on more debt. Indeed, a Statistics Canada Survey on Business Conditions conducted through October showed that over 40% of businesses could not take on any more debt. For businesses in the leisure & hospitality sector, the share is even higher at 60%, while other services (a category that includes hair and beauty salons, auto and equipment repairs, and dry-cleaners), it is 53%.
The good news is that vaccines are currently being distributed and a brighter future is around the corner. Still, mass vaccination and full normalization of the economy is more than a few months away. Given this lingering uncertainty about the length of the health crisis and the pace of the recovery thereafter, it is understandable why businesses are hesitant to incur more debt.
Hard-hit sectors, meanwhile, are running out of time. Last fall, nearly half of the firms in the arts, recreation and entertainment sector and 30% of the firms in leisure and hospitality said they would not survive beyond six months if their revenues do not improve (see Table 1). Needless to say, the operating environment has deteriorated even further since then due to new rounds of government-mandated restrictions.
Combining various indicators of business health from the Statistics Canada Survey on Business Conditions into a single index captures the pain points for those industries most impacted by pandemic-related closures or reduced capacity (Tables 1 and 2). Higher values in the index correspond to higher vulnerability. The index is highest for arts & entertainment and accommodation & food. Not surprisingly, these are also the two high-touch industries most impacted by extended government-mandated closures and reduced capacity. Similarly, the index is higher for smaller businesses (Table 2), where more constraints exist on absorbing additional debt, combined with reduced availability of cash or other liquid savings.
Table 1: Business Vulnerability Index by Industry
| Industry | Revenue performance: Revenue decline of 30% or more | Operations Outlook: Business can continue to operate at current level of revenue and expenditure of less than 6 months | Debt: Business or organization cannot take on more debt | Liquidity: Business does not have the cash or liquid assets required to operate, and will not be able to acquire or doesn't know if it will be able to | Closure plans: business or organization plans to close the business or organization | Vulnerability index |
|---|---|---|---|---|---|---|
| All industries (Share of businesses %) | 30.8 | 17.5 | 43.9 | 8.2 | 2.0 | 20.5 |
| Agriculture | 18.8 | 6.5 | 36.0 | 3.6 | 0.4 | 13.1 |
| Mining | 41.4 | 23.5 | 42.8 | 11.4 | 3.5 | 24.5 |
| Construction | 32.2 | 17.5 | 50.6 | 10.2 | 2.8 | 22.7 |
| Manufacturing | 33.6 | 22.4 | 39.3 | 9.1 | 2.8 | 21.4 |
| Wholesale trade | 28.3 | 16.5 | 37.1 | 7.6 | 1.1 | 18.1 |
| Retail trade | 26.4 | 19.3 | 44.7 | 7.9 | 2.9 | 20.2 |
| Transportation & warehousing | 29.8 | 17.3 | 38.9 | 13.0 | 2.7 | 20.3 |
| Information & cultural industries | 43.0 | 19.5 | 41.1 | 6.1 | 2.1 | 22.4 |
| Finance & insurance | 23.5 | 5.0 | 24.7 | 4.9 | 0.8 | 11.8 |
| Real estate | 21.1 | 12.5 | 42.6 | 7.0 | 0.6 | 16.8 |
| Professional, scientific and tech. | 30.6 | 19.5 | 43.2 | 7.4 | 2.8 | 20.7 |
| Administrative, support, waste mgmt. | 35.7 | 17.6 | 45.8 | 11.6 | 1.0 | 22.3 |
| Health care & social assistance | 23.1 | 13.0 | 42.1 | 5.0 | 1.2 | 16.9 |
| Arts, entertainment and recreation | 56.9 | 29.4 | 57.0 | 15.2 | 4.7 | 32.6 |
| Accommodation & food | 43.6 | 29.2 | 46.8 | 13.6 | 1.6 | 27.0 |
| Other services | 36.3 | 15.2 | 53.0 | 4.9 | 1.3 | 22.1 |
Source: Statistics Canada; The Canadian Survey on Business Conditions (responses collected September through October).
Table 2: Business Vulnerability Index by Business Size
| Indicators | 1 to 4 employees | 5 to 19 employees | 20 to 99 employees | 100 or more employees |
|---|---|---|---|---|
| Revenue performance: Revenue decline of 30% or more | 32.8 | 29.7 | 25.3 | 23.4 |
| Operations Outlook: Business can continue to operate at current level of revenue and expenditure of less than 6 months | 17.4 | 17.6 | 18.2 | 10.4 |
| Debt: Business or organization cannot take on more debt | 47.2 | 43.4 | 34.3 | 16.8 |
| Liquidity: Business does not have the cash or liquid assets required to operate, and will not be able to acquire or doesn't know if it will be able to | 9.8 | 7.3 | 5.0 | 1.9 |
| Closure plans: business or organization plans to close the business or organization | 2.9 | 1.0 | 0.5 | 0.1 |
| Vulnerability index | 22.0 | 19.8 | 16.7 | 10.5 |
Source: Statistics Canada (The Canadian Survey on Business Conditions), TD Economics.
Expected Business Closures
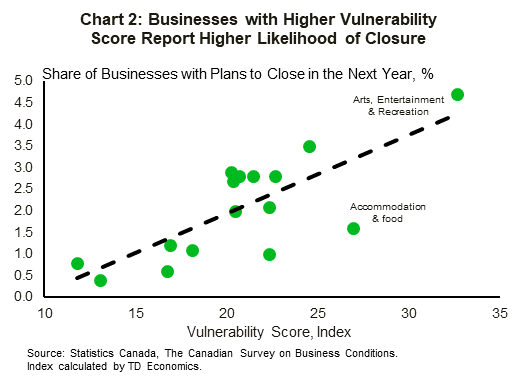
Overall, there appears to be a strong positive correlation between the index and the self-declared share of businesses that are planning to permanently close in 2021 (Chart 2). According to the Survey of Business Conditions, 2% of all businesses reported plans to close over the next twelve months. The share of those planning to close rises to nearly 5% for arts and recreation and 3.5% for mining industries (Table 1). Both are significantly higher than their respective bankruptcy rates of 0.9% and 1.2% registered in 2019.
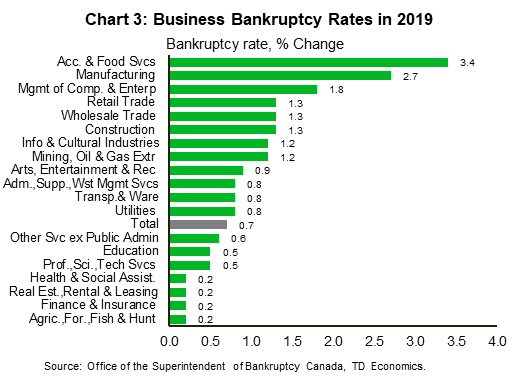
It may seem counter intuitive that only 1.6% of businesses in accommodation & food services had plans to close, given this sector is one of the most impacted by the pandemic. However, this could be for several reasons: many businesses may have already closed last year and thus would not be surveyed, or businesses are being re-organized or sold. Indeed, about 9% of accommodation & food businesses had plans to be sold – the highest of any industry. It’s also important to bear in mind that some industries are more prone to higher closure rates, even in better economic times. Last year’s data (Chart 3) shows that manufacturing and accommodation had a significant number of businesses failures. So, the current environment has pressed on these fault lines even more, but is not the exclusive reason.
Overall, the self-declared share of businesses likely underestimates the number of businesses that could close. Nearly a quarter of respondents to Statistics Canada survey stated that their plans to sell, close, or transfer the business were unknown. The CFIB has estimated that roughly one-in-seven businesses could fail before the pandemic ends.
Why Did Business Insolvencies Remain Relatively Benign?
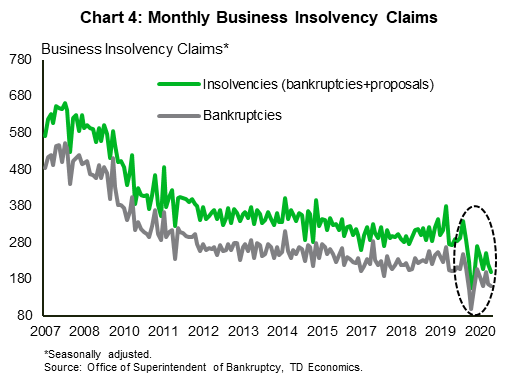
Based on the discussion and indicators above, several sectors are clearly under significant strain, and yet the number of businesses filing for restructuring or bankruptcy has not registered a significant uptick. In fact, fillings declined precipitously in the early months of the pandemic, and while they have begun to rise in recent months, they paradoxically remain below last year’s levels when the economy was healthy and steadily expanding (Chart 4).
What explains this benign behavior? The decline in insolvency filings is not a sign of financial resiliency. The are many factors at play, but it likely reflects more patient creditors as well as extensive government supports. Indeed, the phenomenon of declining insolvency filings is not unique to Canada. As highlighted in a recent article in the Economist2, the same trend has been observed in several developed economies. By contrast, countries that did not impose stringent lockdowns earlier in the year (and had less generous government support programs as a result), such as Sweden and Iceland reported higher business bankruptcy filings relative to a year ago.3,4 A steep drop in filings in the spring could also reflect some interruptions to insolvency filing proceedings during the initial lockdown.
In Canada, government has rolled out significant programs to support businesses during the pandemic, and a majority of Canadian businesses have participated in at least one of them. Programs such as the Canada Emergency Business Account (CEBA), which offered partially-forgivable loans, have had a high uptake rate, with some 800,000 businesses applying (at the time of writing), implying a 50%-60% participation rate (based on various estimates). Based on the survey data, some of the highest CEBA uptake rates were among businesses in accommodation and food and construction sectors, which could explain the drop in insolvencies in these sectors.
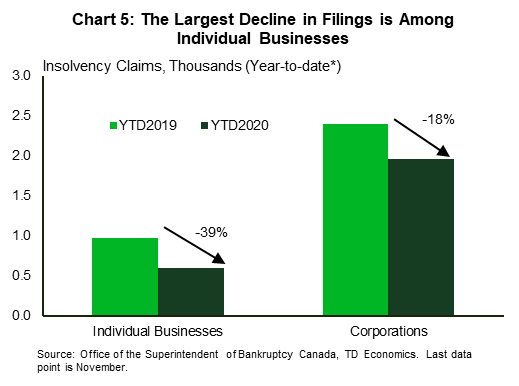
Furthermore, expanded EI benefits and eligibility for CEBA loans for self-employed workers could have helped to lower filings among this type of businesses. Data seems to support this: year-to-date insolvency claims are down by 39% for individual business (Chart 5). By comparison, filings by corporations are down by 17% and have been trending only slightly below year-ago levels in the most recent months.
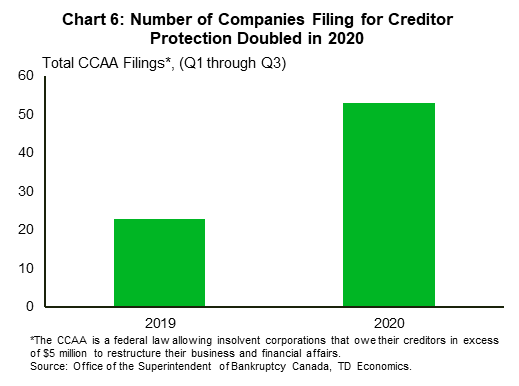
Aside from increased government assistance explaining the apparent drop in business insolvencies, it’s important to understand what is captured in the insolvency data. The data excludes many firms, including smaller firms that may not have a lot of debt and thus have no need to file for insolvency. These may simply wind down their operations. Larger firms with significant debt file under a different act (Companies’ Creditors Arrangement Act (CCAA) rather than Bankruptcy and Insolvency Act (BIA) and thus are not captured in this data. Indeed, if we look at CCAA data, it is showing that filings have nearly doubled last year (Chart 6).
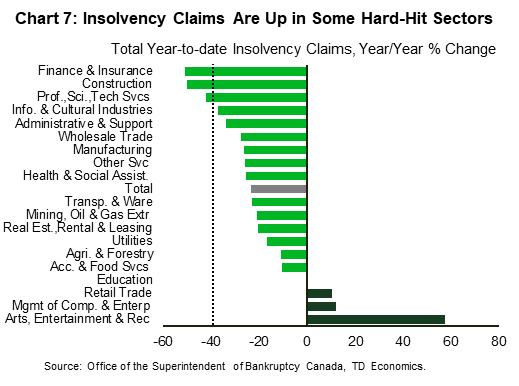
Looking under the hood, the insolvency data still reveals some interesting trends. Namely, filings are most depressed in the proposals category, while bankruptcies, which account for nearly 80% of filings, are much closer to last year’s level. Thus, a higher share of businesses have filed for bankruptcy last year, likely reflecting pessimism among business owners that their fortunes can be turned around. In a similar vein, filings are not down uniformly. Industries that were hardest hit by the pandemic, such as retail trade and arts and recreation, show a noticeable uptick in insolvency. In the case of the latter, filings are up by more than 50% over the same period last year (Chart 7).
Still, in the majority of other sectors, filings are significantly below year-ago levels meaning that the overall business bankruptcy rate has so far remained benign. Last year, Canada had a 0.7% bankruptcy rate per 1,000 businesses. Last year, back of the envelope calculations suggest the bankruptcy rate could be between 0.6%-0.65%, assuming that 2%-9% (as per the survey above) of businesses may have closed.
When all factors are taken into consideration, depressed insolvency rates offer more reason for concern than optimism, as it likely captures increased reliance on borrowed funds as well as higher business exits. It is also not known if, and to what extent, borrowed funds are being used to pay off creditors – a route that would not be readily available in the past. Moreover, this data does not include filings by larger companies, whose financial woes might have significant economic repercussions. Lastly, looking back at the 2008-2009 recession, business insolvencies did not rise noticeably, suggesting that this data may not be the best indicator of business health.
{related-articles-row}
Second Wave To Throw Recovery Into Reverse
Putting the pieces together paints a picture of businesses under intense pressure. Back in October, one-fifth of all firms appeared to be hanging by a thread and could not survive more than six months unless their revenues improved. The latest closures and restraints imposed on businesses this fall and winter will carry a higher burden-rate given firms have already absorbed higher levels of debt, and now face a further dearth of revenues.
Indeed, the U.S. offers some insight here, where permanent business closures have accelerated significantly since July as the economy went through a second round of tightened restraints that Canada avoided until recently. Many American businesses have already failed last year, but even this is likely significantly fewer than would have if not for the extensive financial support measures rolled out by governments and financial institutions. For example, the expiration of the Paycheck Protection Program, (which has since been re-upped), coincided with a noticeable uptick in business closings.
Government support programs are quite different in Canada, with most being steadily rolled over and expanded as feedback emerges on shortcomings. Unlike in the U.S., Canada’s second wave of infections and lockdowns was immediately met with extensions of government-backed programs. These came in many forms, such as interest-free loans, business grants, and wage and rent subsidies. However, as noted earlier, the effectiveness of loan programs may be diminishing as many businesses report that they are reaching a limit in their willingness to absorb additional debt. Even so, with a renewed wave of restrictions, many businesses are once again turning towards CEBA. Over 350,000 businesses have already applied for an additional $20,000 on top of the original $40,000 since the launch of CEBA extension at the start of December.
Given how different this business cycle is from past ones, there is a lot of uncertainty around the outlook for business health and their ability to repay loans that they have amassed during this crisis. Repayment of CEBA loans, for example, is not due until the end of 2022 and could be extended for another three years, although at a higher interest rate of 5%. A longer repayment timeline may give businesses enough time to bounce back, however, it may also simply delay closures and insolvencies rather than prevent them. Furthermore, with CEBA being extended to sole proprietorships, there is a possibility that future financial strain may show up in personal insolvencies rather than business, since sole proprietors may be personally liable for their outstanding debt.
Excessive reliance on credit, particularly while interest rates are so low, could increase the risk of future business failures and defaults once interest rates rise or if profitability does not fully rebound, particularly among businesses that were on the margin prior to the pandemic. In the Statistics Canada Survey of Business Conditions, the highest share of firms that had a negative outlook prior to the pandemic were in mining, transportation & warehousing, and administrative and support services (Table 3). Their challenges may be structural in nature, but made worse by the crisis. Incidentally, these industries did not report the highest rates of applications for CEBA and loans from financial institutions, likely reflecting their hindered ability to take on and service additional debt.
On the other hand, businesses in construction and accommodation & food services were the most active applicants for CEBA and other loans, but also had a relatively positive outlook prior to the pandemic, suggesting that they would likely rebound once the health crisis in the rear-view mirror.
Last, but not least, changes in consumer preferences that occurred last year may prove to be permanent, and this too will create winners and losers even among companies that were previously successful. Thus, government programs should also focus on helping businesses to adapt, on the reallocation of workers and resources from less viable sectors to those offering stronger growth potential, and on encouraging new firm creation.
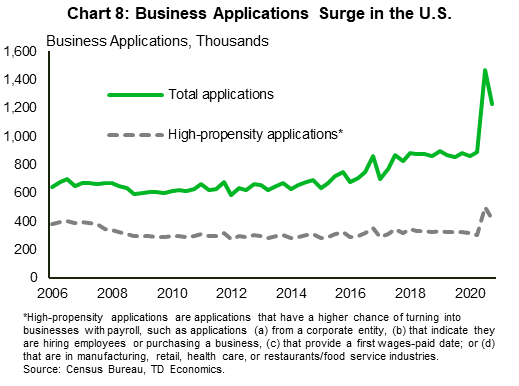
While bringing unprecedented disruption and destruction to the business community last year, the silver lining of the pandemic has been that it has also created opportunities for new businesses – big and small. Similar data for Canada is not available, but U.S. data5 shows that business applications at the end of 2021 were 40% above year-ago level (Chart 8). Looking further ahead, significant business exits during the pandemic will leave a void that will need to be filled by new businesses once the crisis is over. Elevated personal savings would also help boost consumer demand once the pandemic-related restrictions are lifted. While this provides some reasons for optimism, the near-term outlook for many businesses remains perilous.
Table 3: Business Outlook Prior to Pandemic and Share of Businesses With Approved CEBA and Bank Loans
| Industries | Before the pandemic, the general outlook for this business or organization was positive | Approved funding or credit due to COVID-19 |
|---|---|---|
| Disagree and strongly disagree (share of businesses, %) | Canada Emergency Business Account (CEBA) and loans from Financial Institutions (share of businesses, %) | |
| Construction | 1.6 | 64.5 |
| Professional, scientific and tech. | 2.8 | 51.0 |
| Real estate | 2.8 | 45.6 |
| Retail trade | 2.9 | 59.5 |
| Health care & social assistance | 2.9 | 57.9 |
| Accommodation and food services | 3 | 76.9 |
| Finance & insurance | 3.3 | 31.1 |
| All industries average | 3.5 | 58.0 |
| Agriculture | 3.6 | 65.7 |
| Manufacturing | 3.6 | 62.8 |
| Arts, entertainment and recreation | 3.7 | 55.6 |
| Wholesale trade | 4.1 | 54.0 |
| Information & cultural industries | 4.6 | 49.3 |
| Other services | 4.6 | 58.1 |
| Administrative, support, waste management | 5.4 | 56.5 |
| Transportation & warehousing | 7.5 | 57.2 |
| Mining | 9.7 | 46.5 |
Source: Statistics Canada (The Canadian Survey on Business Conditions), TD Economics.
End Notes
- Statistics Canada. Canadian Survey on Business Conditions. Data was collected mid-September to late October. https://www150.statcan.gc.ca/n1/daily-quotidien/201113/dq201113a-eng.htm
- The Economist. September 26, 2020. “Why covid-19 will make killing zombie firms off harder.” https://www.economist.com/finance-and-economics/2020/09/26/why-covid-19-will-make-killing-zombie-firms-off-harder
- Bank for International Settlements. Ryan Banerjee, Giulio Cornelli and Egon Zakrajšek. “The outlook on business bankruptcies.” October 2020. https://www.bis.org/publ/bisbull30.pdf
- London School of Economics. Simeon Djankov, Eva Zhang. “Bankruptcies are down in richer countries – but that won’t last. Start preparing now.” November 2020. https://blogs.lse.ac.uk/covid19/2020/11/27/bankruptcies-are-down-in-richer-countries-but-that-wont-last-start-preparing-now/
- The Economist. September 10, 2020. “The number of new businesses in America is booming”. https://www.economist.com/united-states/2020/10/10/the-number-of-new-businesses-in-america-is-booming
Disclaimer
This report is provided by TD Economics. It is for informational and educational purposes only as of the date of writing, and may not be appropriate for other purposes. The views and opinions expressed may change at any time based on market or other conditions and may not come to pass. This material is not intended to be relied upon as investment advice or recommendations, does not constitute a solicitation to buy or sell securities and should not be considered specific legal, investment or tax advice. The report does not provide material information about the business and affairs of TD Bank Group and the members of TD Economics are not spokespersons for TD Bank Group with respect to its business and affairs. The information contained in this report has been drawn from sources believed to be reliable, but is not guaranteed to be accurate or complete. This report contains economic analysis and views, including about future economic and financial markets performance. These are based on certain assumptions and other factors, and are subject to inherent risks and uncertainties. The actual outcome may be materially different. The Toronto-Dominion Bank and its affiliates and related entities that comprise the TD Bank Group are not liable for any errors or omissions in the information, analysis or views contained in this report, or for any loss or damage suffered.
Download
Share this: