AI in Canada: Sustained Productivity Requires Systematic Integration
Mauri Hall, Economist
Date Published: June 10, 2026
- Category:
- Canada
- Labour
- Commodities & Industry
Highlights
- Generative AI is spreading faster than earlier transformative technologies, driven by low-cost, task-specific tools and ease of use.
- Rapid adoption does not guarantee sustained productivity gains. As in past technology cycles, lasting gains require complementary investment in data, systems, skills, and organizational changes that embed AI into core workflows.
- The United States leads in AI investment and computing capacity, but early gains reflect the scale of spending on data centers and hardware rather than broad integration into production.
- Canada’s weaker investment in intangibles, smaller firm size, and fragmented markets raise the bar, particularly where coordination and reuse matter. Progress on these fronts, as well as shared standards for data and interopability could help AI adoption translate into more durable productivity gains.
Generative artificial intelligence (AI) is diffusing through the global economy faster than previous technology waves. Low‑cost tools and task‑level applications have allowed adoption to spread in months rather than years, reaching workers and firms well beyond the technology sector. That speed reflects low upfront costs of experimentation and high rates of improvement relative to earlier technologies.
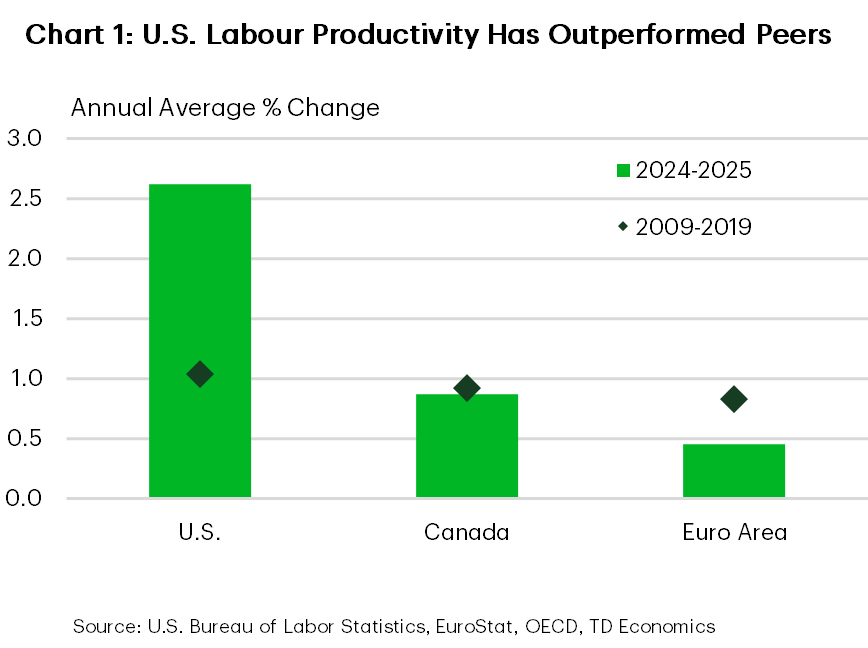
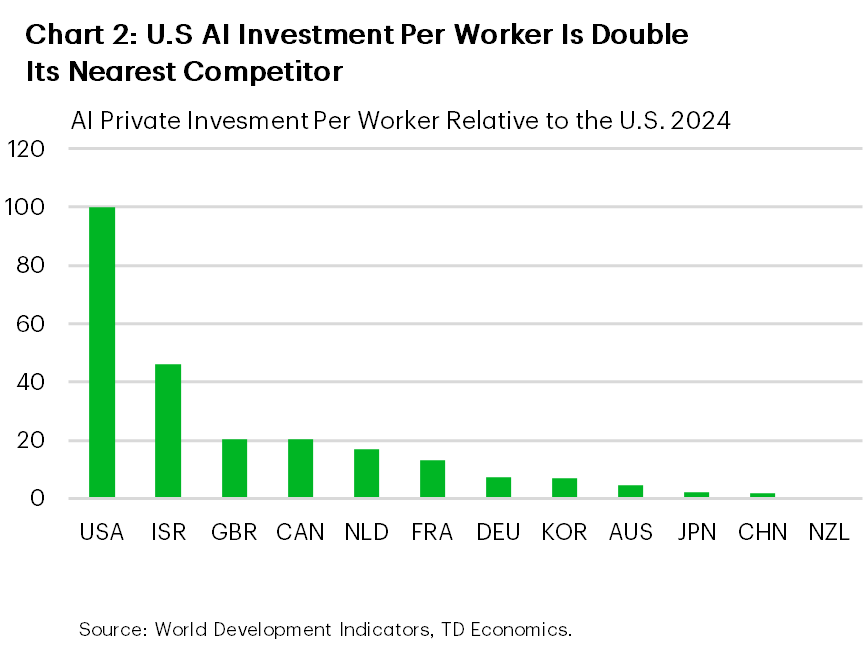
Rapid diffusion has raised expectations that AI could also meaningfully improve productivity. The United States is leading in terms of AI adoption and scaling computing investment. U.S. business labour productivity grew at an average annual rate of 2.6% over the past two years, more than double its ten‑year pre‑COVID average of 1% and well ahead of international peers (Chart 1).1 While AI does not explain all of this outperformance, gains have coincided with a surge in investment in computing infrastructure and AI‑related capital (Chart 2).
This early strength does not, on its own, point to durable gains. Whether AI lifts productivity over time depends on how deeply it is embedded into core production processes. As in past technology waves, lasting gains emerge only once complementary investments allow businesses to reorganize workflows and scale new production methods. For AI, this includes structured data, integrated systems, relevant skills, verification protocols and updated governance. Absent these complements, task-level efficiency gains risk being eroded by coordination, verification, and rework costs.
This distinction matters even more for Canada. Long‑standing underinvestment in intangible assets, a greater concentration of economic activity in small and mid-sized firms, and fragmented markets increase the risk that AI adoption remains surface‑level. Without deeper integration and stronger complementary investment, rapid diffusion may boost usage but fail to deliver a durable lift to productivity.
From Early Uplift to Enduring Productivity Gains
Over the long-term, productivity growth is driven primarily by technological change. While innovation is ongoing where incentives support it, a small number of breakthroughs—electricity, the internal combustion engine, computers and the internet—have durably lifted the pace of productivity growth. What made these innovations stand out was their broad applicability across the economy, transforming how production is organized rather than improving a single sector.
The payoff from these general-purpose technologies (GPTs) was not immediate. Productivity gains emerged only after signficant investment in infrastructure, skills, and organizational change allowed them to be deployed reliably at scale.
Generative AI shares many of the features of these past GPTs, and may, over time transform production across the economy. However, similar to past technologies, sustainable gains will require complementary investment. While AI may lower the cost of specific tasks, and may generate early, investment‑led gains (see textbox next page), sustained productivity growth will only materialize once AI has been integrated into workflows.
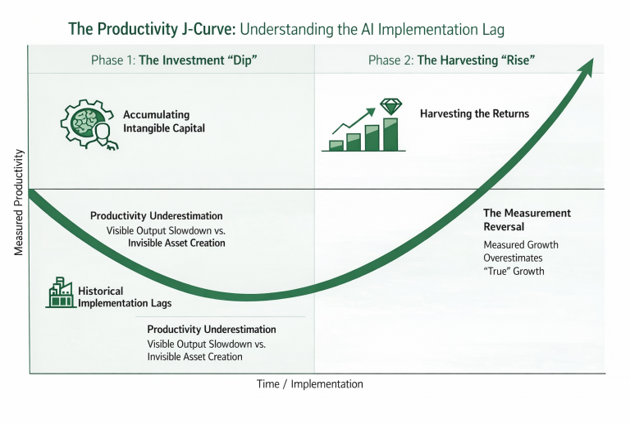
Recent firm level evidence highlights this distinction. A survey of roughly 6,000 executives across the U.S., UK, Germany, and Australia points to widespread AI adoption but minimal realized AI-driven productivity gains within their firms.2 Delayed productivity gains are consistent with the productivity J-Curve observed for earlier general purpose technologies. In past technology waves, adoption typically accelerated ahead of measured productivity as firms absorbed the costs of reorganizing production and investing in complementary intangible assets, whose benefits materialized only with a lag.3
Although generative AI has spread more quickly than past technology waves, the underlying economics remain the same. The largest and most durable gains will follow complementary investments that allow firms to integrate new A.I. technology into core operations where they can reshape production processes rather than merely assist with individual tasks.
Clean Data, Integrated Systems, and Skilled Teams Drive AI Success
To fully realize AI’s potential, firms need clean, interoperable data, systems that communicate seamlessly, and workers trained to use new tools. Equally important, managers must be willing to redesign processes so that AI output can be trusted and acted upon.
These investments are largely intangible, firm‑specific, and difficult to reverse, making them persistent. When taken into account, this type of complementary investment becomes an important driver of productivity growth alongside the initial innovation—particularly in sectors where coordination and the flow of information are central to output.
For AI, this distinction is critical. While these capabilities are difficult to build, they are not limited to early‑moving firms or economies, especially where smaller firms can access shared data, advisory support, and implementation tools. The payoff depends on whether firms can rely on AI within core production systems without rising error or oversight costs as use expands, rather than on AI itself.
Early U.S. Productivity Gains Reflect Investment, Not Transformation
Early productivity gains from AI in the United States have so far arrived mainly through capital deepening, as firms invest heavily in data centres, computing hardware, and information‑and‑communications technology (ICT). These investments lift measured productivity directly through higher capital intensity and, to a lesser extent, shifts in activity toward higher‑productivity firms and sectors.
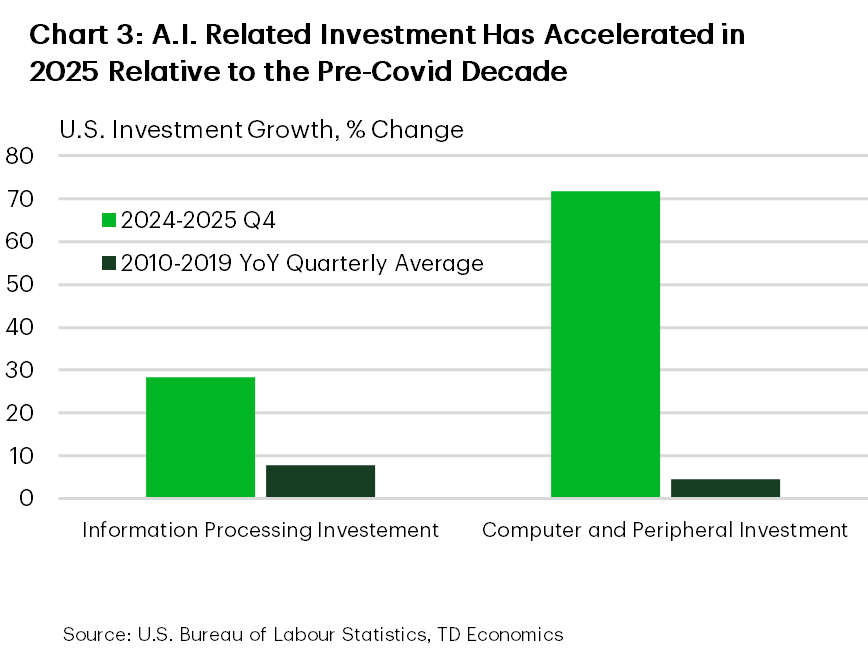
Economic data over the past year bear this out. Real non residential investment in information processing equipment rose roughly 28% year-over-year in the fourth quarter of 2025. Within that category, investment in computers and peripheral equipment increased by 72% year-over-year in the fourth quarter of 2025, pointing to an intensive scale up of compute capacity (Chart 3). Physical infrastructure expanded sharply alongside it, with U.S. data centre construction starts rising by about 190% year-over-year in 2025, reflecting the pace of the build out.4
These early gains are investment‑driven and concentrated, rather than the result of broad-based changes in how production is organized. Earlier technological episodes exhibited similar patterns; measured productivity improved during periods of heavy infrastructure build‑out before firms completed the more difficult task of reorganizing production.
The current pattern does not, on its own, signal how widely or how durably these gains will persist. Early improvements reflect where investment is concentrated, rather than a broad shift in how production is organized.
This distinction is critical for interpreting the next phase. The same cycle that can produce an early burst of measured gains, driven by capital deepening and activity shifting toward high‑productivity ICT segments, can also produce a period of slower measured productivity as firms absorb the cost of integration and build intangible capital that standard metrics undercount.
Sustained gains emerge only in the final stage of this process. For AI, this implies that the ultimate payoff will depend not on the pace of today’s build‑out, but on how effectively it is converted into lasting improvements in production across firms and sectors.
Verification Challenges Limit Deeper AI Integration
One critical component of the intangible investment required to scale AI is verification. Productivity gains are most likely where output can be tested and corrected quickly and cheaply.5 This helps explain why early gains tend to appear in areas such as software development, where errors are immediately visible and feedback loops are built into the production process. Where verification is costly or uncertain, firms are more likely to limit AI deployment to peripheral tasks rather than embedding it into end‑to‑end production processes; AI applied to the wrong class of tasks may decrease productivity.6
Verification is not a feature of the AI model itself but of the surrounding production system. Integrated data, clear process handoffs, and rapid feedback loops make errors visible and correctable. Where these complements are in place, firms can scale AI use more confidently. Where they are not, adoption may be widespread but shallow.
Infrastructure control may also shape firms’ willingness to embed AI into workflows. Integration requires confidence that data, models and outputs can be relied upon over time. When infrastructure is externally hosted, firms face compliance uncertainty. This consideration is relevant for economies such as Canada’s, which hosts fewer than 500 data centres (compared to over 5000 in the U.S.)7 and is a net importer of compute capacity. This may lead to shallower integration, especially for firms already facing scale and verification constraints.
AI Adoption Surges, But Integration Remains Limited
There is little doubt that AI use among Canadian firms is rising. A growing share of businesses report using AI to produce goods or deliver services, with adoption concentrated within industries that were already digitally intensive (professional services, finance, and information sectors) where task level applications can be deployed with minimal system change.8
At the worker level, AI use is broader still. Many employees report using AI tools as part of their job. This pattern points to experimentation and task‑level use, where AI can diffuse quickly even when firms have not yet made the complementary investments required for system‑level change or established clear boundaries around optimal use.
System‑level integration is harder to establish. Targeted business surveys suggest that full integration is still limited, particularly among mid‑sized firms. The emergent picture is one of growing interest and experimentation, with few examples of end‑to‑end transformation that alters how production is organized.
These patterns suggest AI in Canada is spreading first through low‑verification, low‑integration channels. Adoption, enabled by fast‑diffusing, user‑level tools, has moved ahead of the organizational, data, and verification investments needed to deliver broad, durable productivity gains. Whether that gap closes depends critically on firms’ starting conditions and the economic incentives they face to invest in integration.
This gap between rapid adoption and limited integration defines both Canada’s challenge and the scope for catch‑up if firms invest in system‑level capability.
Canada’s Starting Point Raises the Bar
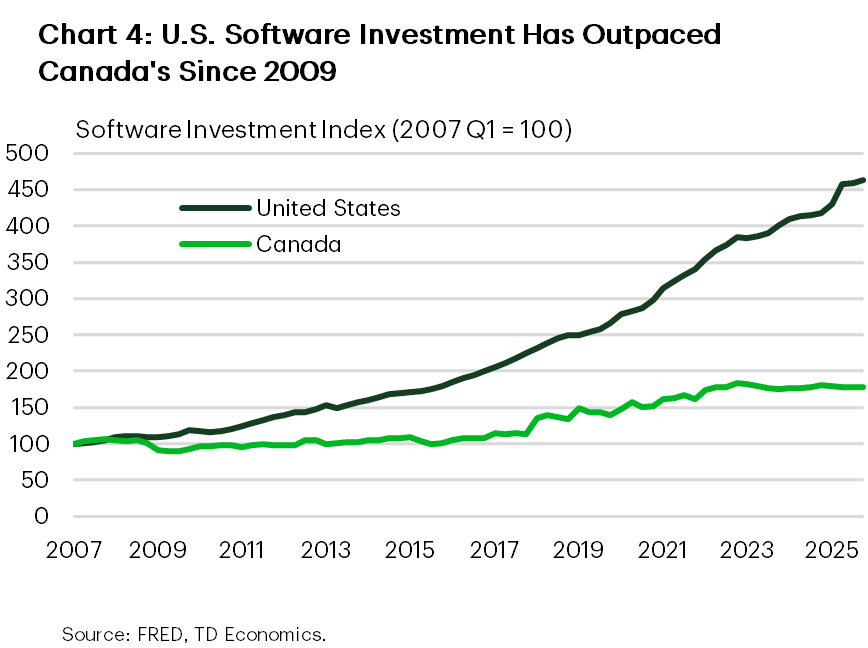
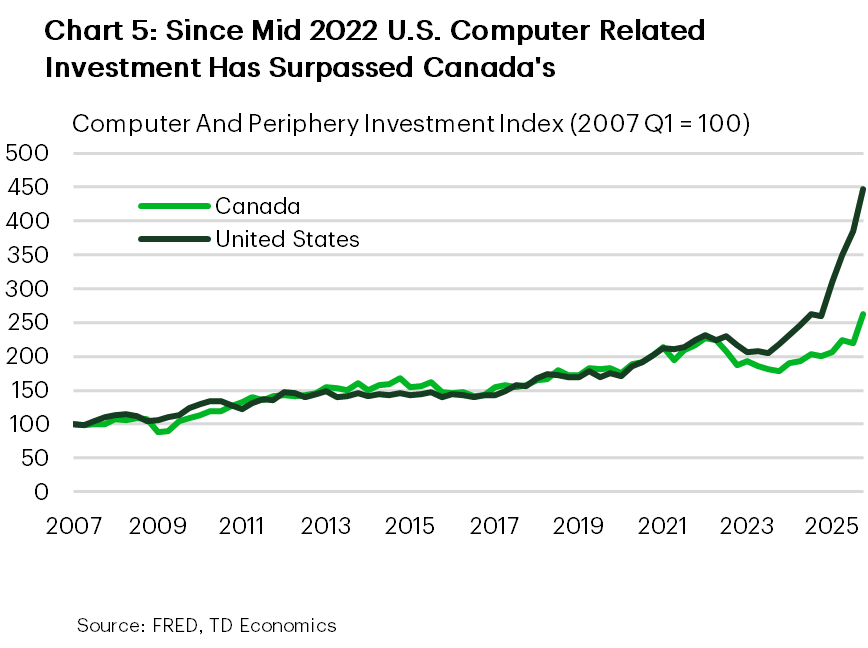
Unfortunately, Canada’s starting conditions are less favourable than in many peer economies. Canada’s long‑standing productivity gap with the United States reflects, in large part, weaker investment in intangible capital and slower multifactor productivity growth. Over time, Canadian firms have invested less in assets that support production such as software (Chart 4). More recently, the US’s advantage has shown up as a growing lead in computer hardware, leaving a weaker foundation on which to layer AI effectively (Chart 5).
Research suggests that this shortfall, in part, reflects a higher share of economic activity (e.g. hours worked) occuring in smaller firms.9,10 For AI technology, whose payoff depends on scale and fixed investments in data, systems, and organizational capabilities, these features materially raise the threshold for successful integration.
Market fragmentation compounds the challenge. Barriers within Canada’s internal market limit firm scale, particularly in services. Smaller effective markets reduce the returns to large fixed‑cost investments, including those required to integrate AI across production systems. For a technology whose benefits rise with scale and diffusion, this constraint is binding and shapes firms’ investment decisions accordingly.
These conditions do not preclude catch‑up, but they raise the cost of achieving deep integration and therefore shape how adoption occurs. In the absence of sufficient scale, integration capacity, and verification infrastructure, firms rationally favour shallow, task‑level use.
What Would Make the Difference
Firms are more likely to invest in production grade, integrated AI systems when they operate at scale and face competitive pressure to raise efficiency. Where markets are fragmented and firms remain small, the fixed costs of data integration, systems redesign, and organizational change are harder to justify—even when AI tools are widely available. As such, policies that expand scale and intensify competition would raise the payoff to deeper adoption, making complementary investment in data, systems, and skills more economically viable and necessary.
Scale alone, however, may not be sufficient. Many high value AI applications depend on coordination across firms and projects, particularly where production spans multiple participants. When standards, data formats, and processes differ, firms are forced to rebuild similar solutions repeatedly, raising costs and slowing diffusion. Targeted efforts to reduce duplication, such as shared reference standards, interoperability frameworks, and procurement that addresses clear coordination failures, can support reuse and integration without directing firm level decisions.
 Construction Illustrates Canada’s Challenge
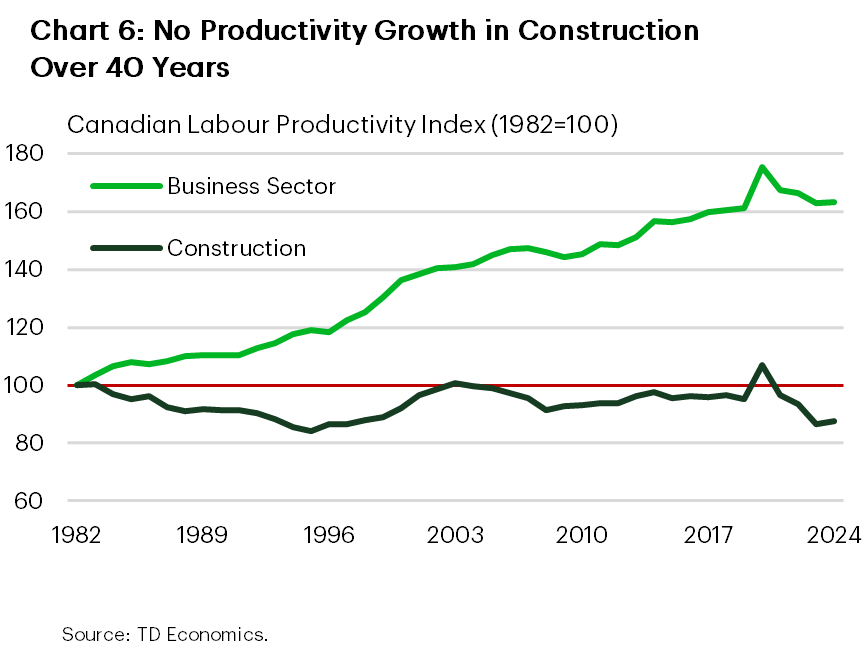
The construction sector illustrates how these constraints reinforce one another. The industry combines limited firm scale with heavy reliance on coordination across firms and projects. The AI applications with the largest productivity potential—such as BIM integrated design, scheduling, and project management—also require a high degree of systems integration.11 In the absence of scale and coordination, adoption tends to remain piecemeal, and productivity gains remain limited (Chart 6).
For small and mid‑sized businesses, the fixed costs of intangible investment are often the binding constraint. “AI starter packs” that bundle diagnostics, training, governance templates, and implementation help. Shared standards for data and interoperability; and clearer regulatory guidance that gives firms confidence to invest may be particularly helpful. The aim is to replace narrow tasks, reimagine workflows, and recombine capabilities across functions as standards and confidence build. This shifts the agenda from frontier research and national champions toward economy‑wide diffusion.12
For SMEs, access matters as much as incentives: shared access to trusted data assets, secure compute, and off‑the‑shelf integration components can make production‑grade adoption feasible without each firm having to rebuild the same intangible stack from scratch. Given the rapid evolution of AI, firms stand to benefit from early adoption paired with continuous adaptation as AI capabilities expand.
Bottom Line
AI use is spreading rapidly, but integration remains uneven. The technology has the potential to lift Canadian productivity, but history shows us that the realization of productivity gains depends on complementary investment and organizational change. For AI, the ability to verify and use outputs reliably at scale is a central constraint.
Canada’s weaker investment in intangibles, smaller firm size, and fragmented markets raise the bar for success relative to peer economies. Closing this gap requires that firms move beyond experimentation and build the capabilities needed for system‑level integration. This includes improvements in data connectivity, interoperability across systems, and production environments that allow output to be tested, validated, and used with confidence. Where firms operate at sufficient scale and face incentives to invest in these capabilities, AI is more likely to be integrated into core workflows rather than applied at the margins.
The key test for Canada is whether adoption is accompanied by a shift in how production is carried out across firms. Without that shift, AI use may remain broad but shallow, improving efficiency in isolated tasks without delivering a sustained, economy‑wide lift in productivity. The strongest gains lie in the later stage of this process, once earlier investments translate into new ways of working that can be deployed at scale across the economy.
End Notes
- The Euro Area data is labour productivity per hour worked for all workers, U.S. and Canadian data are productivity per hour worked for workers in the business sector only.
- AI Index Steering Committee (2026). The AI Index 2026 Annual Report. Stanford Institute for Human-Centered AI, Stanford University.
- Brynjolfsson, E., Rock, D., & Syverson, C. (2020). The Productivity J-Curve: How Intangibles Complement General Purpose Technologies. NBER Working Paper 25148.
- Michael Gucks and Devin Bell, “Data Center Construction Starts Continue to Blow Past Expectations”, ConstructConnect, February 3, 2026.
- Fruits, E., & Stout, M. (2026). AI, Productivity, and Labor. ICLE Issue Brief 2026-02-05.
- Dell’Acqua, F., et al. (2026). Navigating the Jagged Technological Frontier: Field Experimental Evidence of the Effects of AI on Knowledge Worker Productivity and Quality. Organization Science.
- AI Index Steering Committee (2026). The AI Index 2026 Annual Report. Stanford Institute for Human-Centered AI, Stanford University.
- OECD (2025), OECD Economic Surveys: Canada. Volume 2025/12.
- Gu, W., Allen, R., Macdonald, R. (2025). Data, Intangible Capital and Economic Growth in Canada. Analytical Studies Branch Research Paper Series, Statistics Canada.
- Gu, W., & Lesica, J. (2025). The role of firm size in the Canada–U.S. labour productivity gap since 2000. Economic and Social Reports, Statistics Canada.
- BIM (Building Information Modeling) refers to the use of a single, shared digital model to design and manage a construction project. Rather than relying on separate drawings and documents for architecture, engineering, scheduling, and construction, BIM links these elements in one integrated model. Changes made in one part of the design automatically update related components, allowing conflicts to be identified earlier and coordination to improve across firms and stages of production to improve.
- Bilt, J. (2025) Replace, Reimagine, Recombine: Building an AI Nation to Fix Canada’s Productivity Crisis. University of Waterloo.
Disclaimer
This report is provided by TD Economics. It is for informational and educational purposes only as of the date of writing, and may not be appropriate for other purposes. The views and opinions expressed may change at any time based on market or other conditions and may not come to pass. This material is not intended to be relied upon as investment advice or recommendations, does not constitute a solicitation to buy or sell securities and should not be considered specific legal, investment or tax advice. The report does not provide material information about the business and affairs of TD Bank Group and the members of TD Economics are not spokespersons for TD Bank Group with respect to its business and affairs. The information contained in this report has been drawn from sources believed to be reliable, but is not guaranteed to be accurate or complete. This report contains economic analysis and views, including about future economic and financial markets performance. These are based on certain assumptions and other factors, and are subject to inherent risks and uncertainties. The actual outcome may be materially different. The Toronto-Dominion Bank and its affiliates and related entities that comprise the TD Bank Group are not liable for any errors or omissions in the information, analysis or views contained in this report, or for any loss or damage suffered.
Download
Share: